


Hi Everyone,
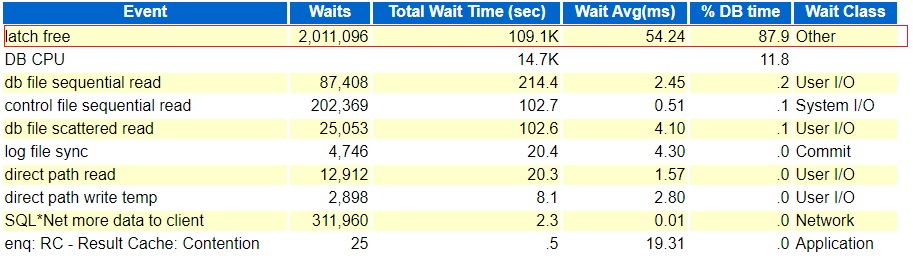
This is one of the latest issue that I will be discussing next where in one of the 12c (12.1.0.2.0) Non-RAC production box we suddenly started seeing a huge spike in database workload (or AAS). As usual I started with some live monitoring using scripts, OEM Performance page and tools and saw huge numbers of sessions waiting on ‘Latch Free’ (Others classed event) waits. Next I saw the event wait were contributing more than 87% of the total DBTime % with exceptionally high latch wait times of 54 ms (Yes, that’s too much for latch gets) and what else caught my eye was ‘enq: RC – Result Cache: Contention’ with average wait times of 19.31 ms.
But lets not jump directly to the conclusion, next I checked SQLs with excessive buffer scans (SQL Ordered by Gets) and saw the source statement that caused the mess with exceptionally high number of buffer scan requests and as you must be aware that each scan that you do in memory buffers (db buffer cache) you will have to acquire a latch for your scan. This one SQL was responsible for around 85% of total buffer reads or gets and interestingly within three hours of AWR report not even a single execution was completed.

Alright now next task was to identify the type of latch which was causing ‘latch free’ or latch shortage in the database. And for that I checked ‘Latch Statistics’ section and ‘Latch Sleep Breakdown’ subsection to see what latch was frequently missed to get and with more sleep requests, and I have got the culprit, ‘Result Cache: RC Latch’ was coming with huge Miss and sleep ratio. The latch was sleeping mainly for ‘Result Cache: Serialization12’ and little bit on ‘Result Cache: Serialization01’.

Next just to be double sure, I checked for P2 value for ‘Latch Free’ event which was coming as 559. So I queried V$Latchname to see if it’s matching the same what we identified so far. And yes, it was same RC Latch!
> SELECT latch#,name FROM gv$latchname WHERE latch#=559;

    LATCH# NAME
---------- ----------------------------------------------------------------
       559 Result Cache: RC Latch
You can do more deep down analysis and troubleshooting on such issues, Tanel Poder has written a great presentation for all who want to dig deep and want to pin point the addresses, code etc.
Download the copy of the document, click next –> Oracle_Latch_And_Mutex_Contention_Troubleshooting
Alright, now when the latch name, SQL is identified lets check more about the RESULT CACHE, and it’s set to MANUAL (parameter result_cache_mode) and this is strange. Next we saw that the SQL using the RC contains DS_SVC hints and are part of dynamic statistics activity.
Then I thought to look out for some official documentation on the same, and luckily found one official note from Oracle Doc ID 2002089.1 which is matching almost same with my problem.
And as per the document the workload we can apply is to disable the Adaptive Dynamic Statistics mechanism.
alter system set "_optimizer_ads_use_result_cache" = FALSE;
or else One-off Patch 26436717 can be requested and applied to fix the issue for a permanent fix.
Hope It Helps
Prashant Dixit
