I’m excited to announce that I’ve authored my first blog post on Oracle’s multi-cloud observability and management platform. My post “Real Application Testing for Capture and Replay in a PDB, a great addition in 19c.” recently got published by Oracle Corporation on their blogging platform 🙂 🙂 🙂 🙂
CHA GUI (CHAG) is a graphical user interface for Cluster Health Advisor (CHA) which was earlier internal to Oracle teams but its now available to the customers. It is a standalone, interactive, real-time capable front-end/GUI to the classic CHA utility. Oracle 12.2 is the first version that is supported by CHA GUI (CHAG). You only require RAC license and there is no need for any additional license to use CHAG tool.
CHAG communicates directly with the Grid Infrastructure Management Repository (GIMR) using a JDBC connection.. GIMR is mandatory for CHAG to work as it fetches the data out of the GIMR repository. In case you don’t have the GIMR repo installed, for example on 19c databases as GIMR is optional there, you can use the local mode for CHAG to work, but in absence of GIMR mgmt repo you will not get the historical abilities to go back in time.
Installation is quite simple, you have to download and unzip the software on one of your cluster machines and I recommend not to dump it inside your ORACLE HOME, but in a separate place. CHAG requires X11 or XHost and Java as it uses Java Swing to open the GUI. CHAG can operate in several modes:
With a default connection to GIMR Database. This option initiate a live session and provide real-time monitoring.
With a user specified location of a GIMR Database (option -P). This option initiate a live session and provide real-time monitoring.
Read in a text file with monitoring data (option -f). This initiates a passive session, which allow to analyze textual data extracted from a GIMR, or data collected during a live session. This data is held in a “*.mdb” file.
Parse text file with data and generate JSON object with information similar to query “diagnosis” (option -C). This mode of operation ‘chag -C -f ‘ directs CHAG to parse a *.mdb file and to generate a summary of its content in JSON format.
For the offline mode you can get the “mdb” file to analyze using below command. Depending on the time model you will get n number of mdb files for the period.
About the usage, CHAG is invoked using the ‘chag’ script available in the bin directory of the CHA Home. CHAG is designed primarily for Cluster or Database experts. Usage is quite simple and straight forward, you can move the pointer/slider to choose any particular timeframe to catch problems, their cause and the corrective actions. You can use it both in real time and offline version, its just that for real time you have to be on any of the cluster node, for offline you can generate the MDB file (cha datafile) and can run it anywhere on the client machine with no need of oracle home and only Java will be needed.
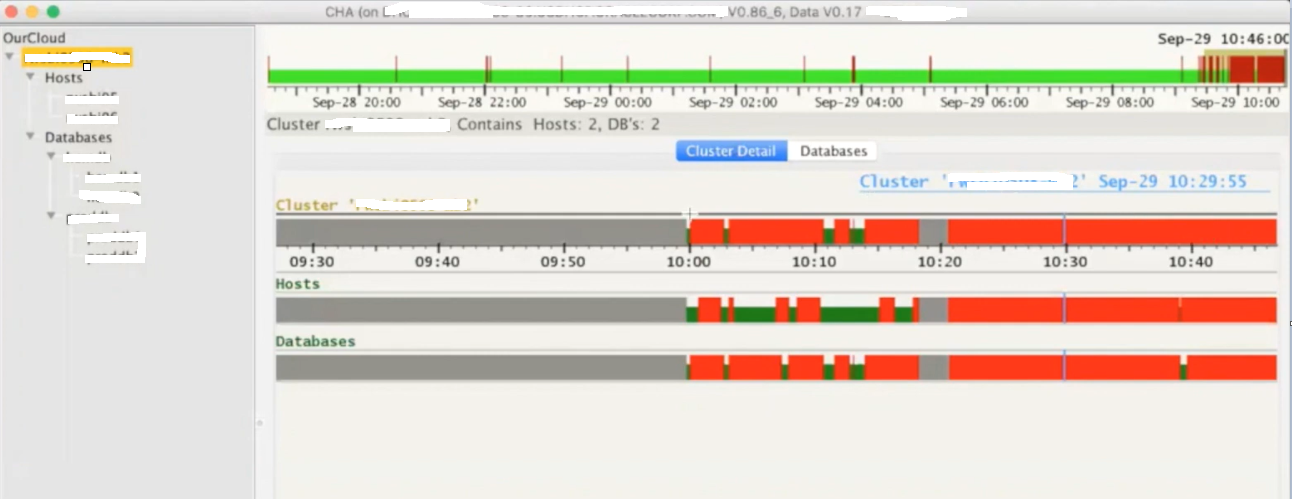
Below is the CHAG look and feel, its running on a 2 node RAC cluster where we have two databases installed. Here you see few color codes, where red colors means there were few problems during that interval.
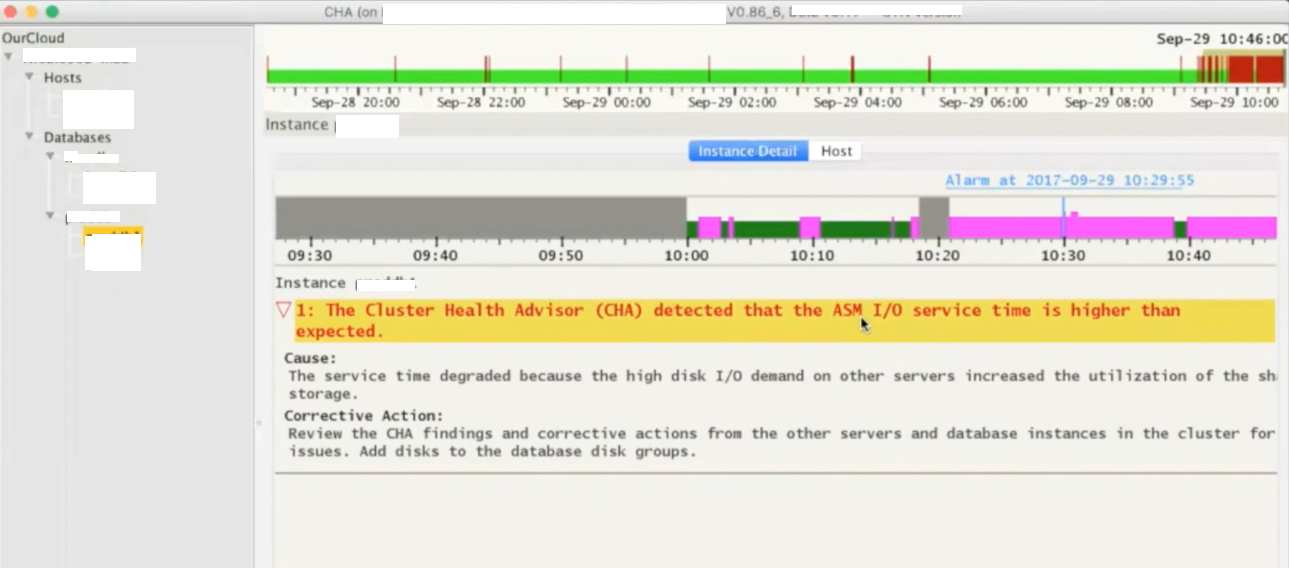
Next is how it explains more about any particular problem caught for the timeslot. Gives you cause and the corrective action, for example in below screenshot it has detected that the ASM IO service time is higher than the expected which points to the underlying IO Subsystem used by ASM disks.
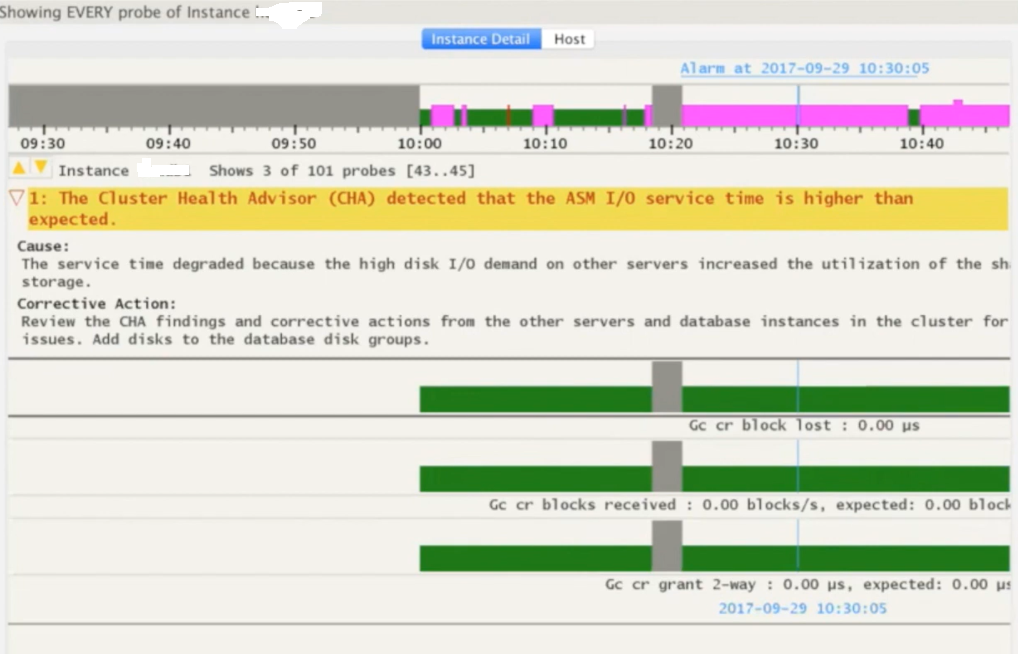
You can use SHIFT keys combinations to get wait event specific details for the selected time period.
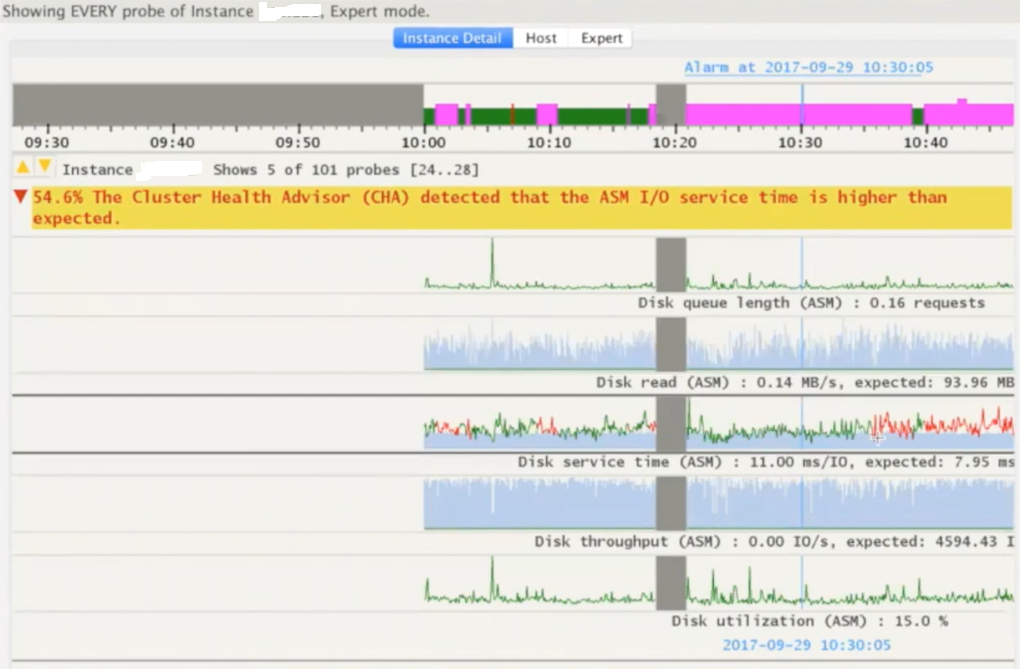
You can use few other SHIFT key combinations to present the same data in the form of line graphs.
Few more examples or problems detected by the CHAG. This time it was reporting for redo log writes which are slower and that is something expected as ASM IO is slow too means the entire IO subsystem is impacted.
I highly recommend all readers to go through Doc ID 2340062.1 on metalink for more details on Cluster Health Advisor Graphical User Interface – CHAG.