Recently one of the customer asked me about their critical SQL on a production system running on Oracle 12cR2, if there is a way to pin it in the AWR. I mean the query was already super fast, gets completed very fast and doesn’t consume any system resources, or isn’t a ‘Top SQL’. He still want to track this low resource SQL historically to check few stats, the guys was coming from an Oracle DBA background, and got the impression that the AWR only captures statements considered to be Top N (DBA_HIST_WR_CONTROL.TOPNSQL) which is by default 30. So, If you require any SQL to be always available in the top SQL, then you need to modify the default value to store those many SQLs. But this will create a AWR snapshot stress and that he don’t want.
The answer was ‘Yes’, there is a way how this can be achieved, and that’s too quite easily, and is even present since 11gR1 without making any modifications to your snapshot settings of topnsql. This is by using DBMS_WORKLOAD_REPOSITORY.ADD_COLORED_SQL API to pin any SQL into the AWR report as long as the SQL is in memory. So, if you mark your SQL or color it, it will be captured in every snapshot and it doesn’t have to be a TOP-N SQL to present in an AWR.
Let’s do a demo to understand how we can do that. I am going to run a test SQL to count number of rows into the table.
SQL> select count(*) from TABLE_GROWTH_MB;

  COUNT(*)
----------
      2868

SQL> select sql_id, plan_hash_value, sql_text from  v$sqlarea where sql_text like '%TABLE_GROWTH_MB%';

SQL_ID        PLAN_HASH_VALUE SQL_TEXT
------------- --------------- --------------------------------------------------
4n3x6w1vhn1k3      1134407048  select count(*) from TABLE_GROWTH_MB
Okay, so we have executed the SQL and we have its SQL_ID with us now. Lets try to use awr_sql_report_text function that displays an Automatic Workload Repository (AWR) SQL report as plain text to see if the SQL is present under the latest snapshot range.
SQL>
SQL> select output from table (dbms_workload_repository.awr_sql_report_text(l_dbid => 2592296819 , l_inst_num => 2,
l_bid => 36708, l_eid => 36718, l_sqlid => '4n3x6w1vhn1k3'));

OUTPUT
--------------------------------------------------------------------------------
WORKLOAD REPOSITORY SQL Report

Snapshot Period Summary

DB Name         DB Id    Unique Name DB Role          Edition Release    RAC CDB
------------ ----------- ----------- ---------------- ------- ---------- --- ---
FATDBACA      2592296819 FATDBACA    PRIMARY          EE      12.2.0.1.0 YES NO

Instance     Inst Num Startup Time
------------ -------- ---------------
FATDBACA2           2 26-Oct-21 23:10

              Snap Id      Snap Time      Sessions Curs/Sess
            --------- ------------------- -------- ---------
Begin Snap:     36708 10-Mar-22 16:00:37       190       2.5
  End Snap:     36718 10-Mar-22 18:30:06       181       2.6
   Elapsed:              149.48 (mins)
   DB Time:               91.13 (mins)

SQL Summary                    DB/Inst: FATDBACA/FATDBACA2  Snaps: 36708-36718

                  No data exists for this section of the report.
          -------------------------------------------------------------

SQL ID: 4n3x6w1vhn1k3          DB/Inst: FATDBACA/FATDBACA2  Snaps: 36708-36718

                  No data exists for this section of the report.
          -------------------------------------------------------------

Full SQL Text

                  No data exists for this section of the report.
SQL>
SQL>
SQL>
SQL>
And the report has no data about the SQL as the SQL was pretty fast, and hardly took few milliseconds to finish and is expected as it didn’t qualified as a TOP-SQL hence found no place in the AWR report. I am now going to color the SQLID and will re-run the SQL and check if its there in AWR now or not …
-- to PIN the SQLID in question
SQL> exec dbms_workload_repository.add_colored_sql('4n3x6w1vhn1k3');

PL/SQL procedure successfully completed.

SQL>

-- To UNPIN or remove the COLOR SQLID from repo
SQL> exec dbms_workload_repository.remove_colored_sql('<SQL_ID>');

-- Query below view to see list of all colored SQLs
SQL>  select * from DBA_HIST_COLORED_SQL;

   DB Id    SQL_ID        CREATE_TI     CON_ID
----------- ------------- --------- ----------
 2592296819 4n3x6w1vhn1k3 10-MAR-22          0


-- Re ran the SQL
SQL> select count(*) from TABLE_GROWTH_MB;

  COUNT(*)
----------
      2868


-- Let me generate a manual snap to capture fresh data
SQL>
SQL>
SQL> var n_snapid number
set feed off term on head off
set serveroutput on size unlimited
begin
        :n_snapid := dbms_workload_repository.create_snapshot();
        dbms_output.put_line('snap_id: ' || to_char(:n_snapid));
end;
/
snap_id: 36719
SQL>


-- Let me retry again to see if the SQLID details are there in the AWR after I have colored it
SQL> SQL> select output from table (dbms_workload_repository.awr_sql_report_text(l_dbid => 2592296819 , l_inst_num => 2,
l_bid => 36718, l_eid => 36719, l_sqlid => '4n3x6w1vhn1k3'));

OUTPUT
---------------------------------------------------------------------------------------------------------------------------------
WORKLOAD REPOSITORY SQL Report

Snapshot Period Summary

DB Name         DB Id    Unique Name DB Role          Edition Release    RAC CDB
------------ ----------- ----------- ---------------- ------- ---------- --- ---
FATDBACA      2592296819 FATDBACA    PRIMARY          EE      12.2.0.1.0 YES NO

Instance     Inst Num Startup Time
------------ -------- ---------------
FATDBACA2           2 26-Oct-21 23:10

              Snap Id      Snap Time      Sessions Curs/Sess
            --------- ------------------- -------- ---------
Begin Snap:     36708 10-Mar-22 16:00:37       190       2.5
  End Snap:     36719 10-Mar-22 18:39:40       177       2.6
   Elapsed:              159.06 (mins)
   DB Time:               93.43 (mins)

SQL Summary                    DB/Inst: FATDBACA/FATDBACA2  Snaps: 36708-36719

                Elapsed
   SQL Id      Time (ms)
------------- ----------

 Container DB
 ------------
4n3x6w1vhn1k3          0
Module: SQL*Plus
select count(*) from TABLE_GROWTH_MB
   2592296819

          -------------------------------------------------------------

SQL ID: 4n3x6w1vhn1k3          DB/Inst: FATDBACA/FATDBACA2  Snaps: 36708-36719
-> 1st Capture and Last Capture Snap IDs
   refer to Snapshot IDs witin the snapshot range
-> select count(*) from TABLE_GROWTH_MB

    Plan Hash           Total Elapsed                 1st Capture   Last Capture
#   Value                    Time(ms)    Executions       Snap ID        Snap ID
--- ---------------- ---------------- ------------- ------------- --------------
1   1134407048                      0             1         36719          36719
          -------------------------------------------------------------


Plan 1(PHV: 1134407048)
-----------------------

Plan Statistics                DB/Inst: FATDBACA/FATDBACA2  Snaps: 36708-36719
-> % Total DB Time is the Elapsed Time of the SQL statement divided
   into the Total Database Time multiplied by 100

Stat Name                                Statement   Per Execution % Snap
---------------------------------------- ---------- -------------- -------
Elapsed Time (ms)                                 0            0.2     0.0
CPU Time (ms)                                     0            0.2     0.0
Executions                                        1            N/A     N/A
Buffer Gets                                      22           22.0     0.0
Disk Reads                                        0            0.0     0.0
Parse Calls                                       1            1.0     0.0
Rows                                              1            1.0     N/A
User I/O Wait Time (ms)                           0            N/A     N/A
Cluster Wait Time (ms)                            0            N/A     N/A
Application Wait Time (ms)                        0            N/A     N/A
Concurrency Wait Time (ms)                        0            N/A     N/A
Invalidations                                     0            N/A     N/A
Version Count                                     1            N/A     N/A
Sharable Mem(KB)                                 19            N/A     N/A
          -------------------------------------------------------------

Execution Plan
------------------------------------------------------------------------------
| Id  | Operation          | Name            | Rows  | Cost (%CPU)| Time     |
------------------------------------------------------------------------------
|   0 | SELECT STATEMENT   |                 |       |    10 (100)|          |
|   1 |  SORT AGGREGATE    |                 |     1 |            |          |
|   2 |   TABLE ACCESS FULL| TABLE_GROWTH_MB |  2624 |    10   (0)| 00:00:01 |
------------------------------------------------------------------------------


Full SQL Text

SQL ID        SQL Text
------------- -----------------------------------------------------------------
4n3x6w1vhn1k3 select count(*) from TABLE_GROWTH_MB
Perfect, the SQLID is there in the AWR now, and we can see all runtime stats, execution plan, SQL Text etc.
Oracle 19c has a great enhancement added to the DBMS_XPLAN package called the ‘Hint Usage Report’, which is pretty helpful in reporting if an incorrect hint was used, or there was any syntax error with the hint or if there was an unresolved hint used in the SQL.
This you can use with the DBMS_XPLAN package and its functions like DISPLAY, DISPLAY_CURSOR, DISPLAY_WORKLOAD_REPOSITORY or DISPLAY_SQL_PLAN_BASELINE. By default, DBMS_XPLAN in the default TYPICAL format will report only invalid hints. The report shows the text of the hints. The hint may also have one of the following annotations:
E : indicates a syntax error. N : indicates an unresolved hint. U : indicates that the corresponding hint was not used in the final plan.
Lets do some tests to understand it better. For our tests I have a test table created called BIGTAB and loaded it with sample data. First case, I will try the PARALLEL_INDEX hint with one of the Index (non-partitioned) to see what the Hint Report says.
SQL> explain plan for select /*+ PARALLEL_INDEX(BIGTAB,WEIGHT_IDX,2) */ * from bigtab where weight between -168444405 and 639413572;

Explained.

SQL> SELECT * FROM table(DBMS_XPLAN.DISPLAY(FORMAT=>'TYPICAL'));

PLAN_TABLE_OUTPUT
--------------------------------------------------------------------------------
Plan hash value: 441133017

----------------------------------------------------------------------------
| Id  | Operation         | Name   | Rows  | Bytes | Cost (%CPU)| Time     |
----------------------------------------------------------------------------
|   0 | SELECT STATEMENT  |        | 13613 |   252K|    70   (2)| 00:00:01 |
|*  1 |  TABLE ACCESS FULL| BIGTAB | 13613 |   252K|    70   (2)| 00:00:01 |
----------------------------------------------------------------------------

Predicate Information (identified by operation id):
---------------------------------------------------

PLAN_TABLE_OUTPUT
--------------------------------------------------------------------------------

   1 - filter("WEIGHT">=(-168444405) AND "WEIGHT"<=639413572)

Hint Report (identified by operation id / Query Block Name / Object Alias):
Total hints for statement: 1 (U - Unused (1))
---------------------------------------------------------------------------

   1 -  SEL$1 / BIGTAB@SEL$1
         U -  PARALLEL_INDEX(BIGTAB,WEIGHT_IDX,4)

20 rows selected.

SQL>
Here we are getting UNUSED (U) for PARALLEL_INDEX hint that we have used against index WEIGHT_INDEX, but it wasn’t honored because the PARALLEL_INDEX hint parallelizes an index range scan of a partitioned index. This is a common mistake with parallel_index hint is using it against a non-partitioned index, where it will be ignored.
Let me try the next case where I will make a syntax error with the hint INDEX, will pass it as INDEXX and see what the report says.
06:04:55 SQL>
06:04:55 SQL>
06:04:55 SQL> explain plan for select /*+ INDEXX(BIGTAB,WEIGHT_IDX) */ * from bigtab where weight between -168444405 and 639413572;

Explained.

Elapsed: 00:00:00.05
06:08:35 SQL> SELECT * FROM table(DBMS_XPLAN.DISPLAY(FORMAT=>'BASIC +HINT_REPORT'));

PLAN_TABLE_OUTPUT
----------------------------------------------------------------------------------------------------------------------------------------------------------------------------------------------------------------------------------------------------------------------------------------------------------------------------------------------------------------------------------------------------------------
Plan hash value: 441133017

------------------------------------
| Id  | Operation         | Name   |
------------------------------------
|   0 | SELECT STATEMENT  |        |
|   1 |  TABLE ACCESS FULL| BIGTAB |
------------------------------------

Hint Report (identified by operation id / Query Block Name / Object Alias):
Total hints for statement: 1 (E - Syntax error (1))
---------------------------------------------------------------------------

   1 -  SEL$1
         E -  INDEXX

15 rows selected.

Elapsed: 00:00:00.17
06:08:40 SQL>
And it says that there is was a syntax error (E) with the HINT, hence ignored by the optimizer.
Now, I will be trying a correct/valid hint with the SQL Statement and see what the hint report says about it.
SQL> explain plan for select /*+ INDEX(BIGTAB,WEIGHT_IDX) */ * from bigtab where weight between -168444405 and 639413572;

Explained.

SQL>

SQL> SELECT * FROM table(DBMS_XPLAN.DISPLAY(FORMAT=>'BASIC +HINT_REPORT'));

PLAN_TABLE_OUTPUT
----------------------------------------------------------------------------------------------------------------------------------------------------------------------------------------------------------------------------------------------------------------------------------------------------------------------------------------------------------------------------------------------------------------
Plan hash value: 2994241301

----------------------------------------------------------
| Id  | Operation                           | Name       |
----------------------------------------------------------
|   0 | SELECT STATEMENT                    |            |
|   1 |  TABLE ACCESS BY INDEX ROWID BATCHED| BIGTAB     |
|   2 |   INDEX RANGE SCAN                  | WEIGHT_IDX |
----------------------------------------------------------

Hint Report (identified by operation id / Query Block Name / Object Alias):
Total hints for statement: 1
---------------------------------------------------------------------------

   1 -  SEL$1 / BIGTAB@SEL$1
           -  INDEX(BIGTAB,WEIGHT_IDX)

16 rows selected.
And the report says that no error was reported and hint was correctly used, same can be seen in the change of access path of the execution plan.
Next, let me try any optimizer related hint, I will try the optimizer_index_cost_adj HINT to make the SQL more or less index friendly
03:32:43 SQL> explain plan for select /*+ opt_param('optimizer_index_cost_adj',20) */ * from bigtab where weight between -168444405 and 639413572;

Explained.

Elapsed: 00:00:00.00
03:32:53 SQL>

03:32:58 SQL> SELECT * FROM table(DBMS_XPLAN.DISPLAY(FORMAT=>'BASIC +HINT_REPORT'));

PLAN_TABLE_OUTPUT
----------------------------------------------------------------------------------------------------------------------------------------------------------------------------------------------------------------------------------------------------------------------------------------------------------------------------------------------------------------------------------------------------------------
Plan hash value: 441133017

------------------------------------
| Id  | Operation         | Name   |
------------------------------------
|   0 | SELECT STATEMENT  |        |
|   1 |  TABLE ACCESS FULL| BIGTAB |
------------------------------------

Hint Report (identified by operation id / Query Block Name / Object Alias):
Total hints for statement: 1
---------------------------------------------------------------------------

   0 -  STATEMENT
           -  opt_param('optimizer_index_cost_adj',20)

15 rows selected.

Elapsed: 00:00:00.02
And that worked too as no error or any status flag was reported in the hint report.
Next, I will try a non existing Index and will see what the report says about it.
SQL> explain plan for select /*+ INDEX(FATDBA_INDEX) */ * from bigtab where weight between -168444405 and 639413572;

Explained.

SQL> SELECT * FROM table(DBMS_XPLAN.DISPLAY(FORMAT=>'BASIC +HINT_REPORT'));

PLAN_TABLE_OUTPUT
--------------------------------------------------------------------------------
Plan hash value: 441133017

------------------------------------
| Id  | Operation         | Name   |
------------------------------------
|   0 | SELECT STATEMENT  |        |
|   1 |  TABLE ACCESS FULL| BIGTAB |
------------------------------------

Hint Report (identified by operation id / Query Block Name / Object Alias):
Total hints for statement: 1 (N - Unresolved (1))

PLAN_TABLE_OUTPUT
--------------------------------------------------------------------------------
---------------------------------------------------------------------------

   1 -  SEL$1
         N -  INDEX(FATDBA_INDEX)

15 rows selected.

SQL>
And the report says it was UNRESOLVED (N) as the Index doesn’t exists.
Let me try one more case where I will pass two bad or contradictory hints, will use both first_rows and all_rows together and will see what happens.
SQL> explain plan for select /*+ first_rows(1) all_rows */ * from BIGTAB;

Explained.

SQL> select * from dbms_xplan.display(format=>'basic +alias +hint_report');

PLAN_TABLE_OUTPUT
--------------------------------------------------------------------------------
Plan hash value: 441133017

------------------------------------
| Id  | Operation         | Name   |
------------------------------------
|   0 | SELECT STATEMENT  |        |
|   1 |  TABLE ACCESS FULL| BIGTAB |
------------------------------------

Query Block Name / Object Alias (identified by operation id):
-------------------------------------------------------------

PLAN_TABLE_OUTPUT
--------------------------------------------------------------------------------

   1 - SEL$1 / BIGTAB@SEL$1

Hint Report (identified by operation id / Query Block Name / Object Alias):
Total hints for statement: 2 (U - Unused (2))
---------------------------------------------------------------------------

   0 -  STATEMENT
         U -  all_rows / hint conflicts with another in sibling query block
         U -  first_rows(1) / hint conflicts with another in sibling query block

21 rows selected.

SQL>
The preceding report shows that the all_rows and first_rows(1) CBO mode hints conflict with one other. As the First_rows attempts to optimize the query to get the very first row back to the client as fast as possible, whereas All_rows attempts to optimize the query to get the very last row as fast as possible.
Last example I will try to pass multiple hints where few of them will be valid and rest invalid. I will pass FULL & PARALLEL valid hints, and will use two INDEX unresolved hints and one UNRESOLVED hint of MERGE with query block.
SQL> explain plan for select /*+ FULL(bigtab) INDEX(WEIGHT_IDX) INDEX(ID_IDX) MERGE(@SEL$1) PARALLEL(2) */ * from bigtab where weight between -168444405 and 639413572;

Explained.

SQL> select * from dbms_xplan.display(format=>'basic +alias +hint_report');

PLAN_TABLE_OUTPUT
----------------------------------------------------------------------------------------------------------------------------------------------------------------------------------------------------------------------------------------------------------------------------------------------------------------------------------------------------------------------------------------------------------------
Plan hash value: 305217024

-----------------------------------------
| Id  | Operation            | Name     |
-----------------------------------------
|   0 | SELECT STATEMENT     |          |
|   1 |  PX COORDINATOR      |          |
|   2 |   PX SEND QC (RANDOM)| :TQ10000 |
|   3 |    PX BLOCK ITERATOR |          |
|   4 |     TABLE ACCESS FULL| BIGTAB   |
-----------------------------------------

Query Block Name / Object Alias (identified by operation id):
-------------------------------------------------------------

   1 - SEL$1
   4 - SEL$1 / BIGTAB@SEL$1

Hint Report (identified by operation id / Query Block Name / Object Alias):
Total hints for statement: 5 (U - Unused (1), N - Unresolved (2))
---------------------------------------------------------------------------

   0 -  STATEMENT
           -  PARALLEL(2)

   1 -  SEL$1
         N -  INDEX(ID_IDX)
         N -  INDEX(WEIGHT_IDX)
         U -  MERGE(@SEL$1)

   4 -  SEL$1 / BIGTAB@SEL$1
           -  FULL(bigtab)

32 rows selected.
One of the very common scenarios that we DBAs has encountered are when the database is hanging, freeze or totally non responsive, or when your database crashes with a serious performance problem, or when the SQLPlus cannot connect to the server or when you noticed that we can not save the instance/node then most of the time DBA take the system state dump for further analysis or you can say for RCA purpose. In this case, if you want to obtain the current status of the database for later diagnosis, then we need to use SYSTEMSTATE dump to know what the process is doing, what it is waiting for, who is the resource owner, and who is blocking others. In case of the above problems, it is very helpful to analyze the cause of the problem by collecting SYSTEMSTATE dump in time.
In order to understand the purpose, let me create a situation, a problem, I will simulate a row locking (pessimistic type) case in to the database. From the first session I had created a table and insert few rows into it and didn’t commit and opened few others sessions and tried to update same row. And I can see a good amount of blocking is created in the database!
LOCK_TREE
----------
1.97
  1.58
  1.60
  1.75

USERNAME           SID    SERIAL# TY LOCK_TYPE     LOCK_REQUESTE       ID1        ID2 SQL_TEXT
----------- ---------- ---------- -- ------------- ------------- ---------- ---------- ----------------------------------------
SYS                 58      17036 TX None               Exclusive    589839       1777 update test set id=09 where ID=10
SYS                 60      21943 TX None               Exclusive    589839       1777 update test set id=09 where ID=10
SYS                 75         91 TX None               Exclusive    589839       1777 update test set id=09 where ID=10
Right time to generate the SYSTEMSTATE dump, below is how you can generate that. Do system state dump few times in a row, so we can determine whether the processes are hung or active.
-- connect with the database if its not hang or freeze
SQL>  connect / as sysdba

-- Connect using prelim option if its stalled or freeze
SQL>  sqlplus -prelim / as sysdba

-- Use SETMYPID command to select the current process as the ORADEBUG process
SQL>  oradebug setmypid
Statement processed.

-- This is to remove the limitation on the size of the trace file use.
-- In Oracle 8.1.6 and above the maximum size of the trace file defaults to UNLIMITED
SQL> oradebug unlimit
Statement processed.

-- This is to take the systemstate dumps with 266 level (short stack + dump)
SQL>  oradebug dump systemstate 266
Statement processed.

-- Or use below in case running on a RAC setup
SQL>  oradebug -g all dump systemstate 266

SQL>  oradebug dump systemstate 266
Statement processed.

SQL>  oradebug dump systemstate 266
Statement processed.

-- This command prints the name of the current trace file
SQL>  Oradebug tracefile_name
/u01/oracle/diag/rdbms/dixitdb/dixitdb/trace/dixitdb_ora_191381.trc
There are few other levels which you can use and are discussed below. Note: I highly recommend to check with Oracle support to use there levels as few of them with higher level are little risky and known to crash instances.
Level 2 : Takes a dump (not including the lock element)
Level 10 : Takes a dump including lock details
Level 11 : Takes a dump + global cache of RAC
Level 256 : Takes short stacks (function stack)
Level 258 (256 + 2) : Takes a short stack + dump (not including the lock element)
Level 266 (256 + 10) : Takes a short stack + dump
Level 267 (256 + 11) : Takes a short stack + dump + global cache of RAC
So we have artificially created a locking scenario on the database and we are aware about the sessions involved in this pessimistic type locking. Now we will use the same information and that will help us to navigate through the massive SYSTEMSTATE dumps. Lets dig into the trace file that we have generated for the session.
The first part or the header contains details like hostname, machine info, service, module and client details, followed by command processing’s that we did through ORADEBUG.
Next part is where you will see process summary and its dumps, including all user OSPIDs, their commands and blocking details with wait information and is the most interesting one and important section of the dump to understand the wait/blocking chain.
Dumping the Process Summary
       1: PSEUDO process
       2: PMON ospid 3904 sid 2 ser 9826, waiting for 'pmon timer'
       3: CLMN ospid 3906 sid 3 ser 8008, waiting for 'pmon timer'
       4: PSP0 ospid 3908 sid 4 ser 46393, waiting for 'rdbms ipc message'
       5: VKTM ospid 3910 sid 5 ser 26025, waiting for 'VKTM Logical Idle Wait'
       6: GEN0 ospid 3915 sid 6 ser 36023, waiting for 'rdbms ipc message'
       7: MMAN ospid 3917 sid 7 ser 17720, waiting for 'rdbms ipc message'
.....
......
.......
      47: USER ospid 5516 sid 79 ser 52211,
      49: USER ospid 4429 sid 58 ser 17036, waiting for 'enq: TX - row lock contention'
          Cmd: UPDATE
          Blocked by inst: 1, sid: 97, ser: 2507
          Final Blocker inst: 1, sid: 97, ser: 2507
      50: USER ospid 4538 sid 75 ser 91, waiting for 'enq: TX - row lock contention'
          Cmd: UPDATE
          Blocked by inst: 1, sid: 97, ser: 2507
          Final Blocker inst: 1, sid: 97, ser: 2507
      51: W006 ospid 4290 sid 76 ser 17641, waiting for 'Space Manager: slave idle wait'
      52: USER ospid 4636 sid 60 ser 21943, waiting for 'enq: TX - row lock contention'
          Cmd: UPDATE
          Blocked by inst: 1, sid: 97, ser: 2507
          Final Blocker inst: 1, sid: 97, ser: 2507
      55: M004 ospid 4722 sid 74 ser 6422, waiting for 'class slave wait'
And from the above trace section we understood that the final blocker is with SID 97, serial 2507 where SIDs 58,75 and 60 all waiting on event ‘enq: TX – row lock contention’.
Next section is where it dumps buffer cache working set information which contains size of the BC, number of pools, state information and other information. Followed by process level statistics – state, session, latching, post information along with short stack dumps which is debugging/triggering events that generates a trace file in case of any error and full chain. The trace also contains details about wait stacks, blocking chains (waiters), session event history,
Here in below section you will also see the SQL text (update test set id=09 where ID=10) and its details which has caused the blocking, its statistics, execution counts, active locking info, SQL ID, Table Info, HashValues and namespace info.
Next we will check more details about the blocker or the session that has blocked others, here SID 97 is the case.
    (session) sid: 97 ser: 2507 trans: 0x7815a9a8, creator: 0x7d3d9878
              flags: (0x41) USR/- flags2: (0x40009) -/-/INC
              flags_idl: (0x0) status: -/-/-/- kill: -/-/-/-
              DID: 0001-002E-000000010000-0000-00000000, short-term DID:
              txn branch: (nil)
              edition#: 134              user#/name: 0/SYS
              oct: 0, prv: 0, sql: (nil), psql: 0x71cc7dc8
              stats: 0x705a2930, PX stats: 0x128f8d84
    service name: SYS$USERS
    client details:
      O/S info: user: oracle, term: pts/1, ospid: 4321
      machine: oracleontario.ontadomain program: sqlplus@oracleontario.ontadomain (TNS V1-V3)
      application name: sqlplus@oracleontario.ontadomain (TNS V1-V3), hash value=2432467899
.....
........
.........
    Current Wait Stack:
     0: waiting for 'SQL*Net message from client'
        driver id=0x62657100, #bytes=0x1, =0x0
        wait_id=650 seq_num=652 snap_id=1
        wait times: snap=11 min 38 sec, exc=11 min 38 sec, total=11 min 38 sec
        wait times: max=infinite, heur=11 min 38 sec
        wait counts: calls=0 os=0
        in_wait=1 iflags=0x1a0
    There are 3 sessions blocked by this session.
    Dumping one waiter:
      inst: 1, sid: 58, ser: 17036
      wait event: 'enq: TX - row lock contention'
        p1: 'name|mode'=0x54580006
        p2: 'usn<<16 | slot'=0x9000f
        p3: 'sequence'=0x6f1
      row_wait_obj#: 77878, block#: 122337, row#: 0, file# 1
.........
............
.............
    Session Wait History:
        elapsed time of 0.000001 sec since current wait
     0: waited for 'SQL*Net message to client'
        driver id=0x62657100, #bytes=0x1, =0x0
        wait_id=649 seq_num=651 snap_id=1
        wait times: snap=0.000001 sec, exc=0.000001 sec, total=0.000001 sec
        wait times: max=infinite
        wait counts: calls=0 os=0
        occurred after 0.000040 sec of elapsed time
     1: waited for 'SQL*Net message from client'
        driver id=0x62657100, #bytes=0x1, =0x0
        wait_id=648 seq_num=650 snap_id=1
        wait times: snap=0.000557 sec, exc=0.000557 sec, total=0.000557 sec
        wait times: max=infinite
        wait counts: calls=0 os=0
        occurred after 0.000017 sec of elapsed time
     2: waited for 'SQL*Net message to client'
        driver id=0x62657100, #bytes=0x1, =0x0
        wait_id=647 seq_num=649 snap_id=1
        wait times: snap=0.000001 sec, exc=0.000001 sec, total=0.000001 sec
        wait times: max=infinite
        wait counts: calls=0 os=0
        occurred after 0.000015 sec of elapsed time
     3: waited for 'SQL*Net message from client'
        driver id=0x62657100, #bytes=0x1, =0x0
        wait_id=646 seq_num=648 snap_id=1
        wait times: snap=0.000280 sec, exc=0.000280 sec, total=0.000280 sec
        wait times: max=infinite
        wait counts: calls=0 os=0
        occurred after 0.000014 sec of elapsed time
     4: waited for 'PGA memory operation'
        =0x0, =0x0, =0x0
        wait_id=645 seq_num=647 snap_id=1
        wait times: snap=0.000349 sec, exc=0.000349 sec, total=0.000349 sec
        wait times: max=infinite
        wait counts: calls=0 os=0

....
......
........
You will also see details on SQLs that we’ve executed using same SID (97), here in my case I was running few SQLs to identify locking in the database and were captured in the dump along with its parent and child cursor details, followed by some object level stats.
Other important section is the ‘Enqueue Dump‘. Here in our case this section discloses that enqueue name was “TX-0009000F-000006F1-00000000-00000000” and was acquired in ‘X’ (Exclusive) mode by the holder session ID 97.
At the end it prints details about the redo transport, ASM File Info, SGA Information, PDB/CDB details …
KGSKSGA info:
is the system running: yes
  session that stopped the system: (nil)
number of plans 1 classes 4
low threshold delta 0
high threshold delta 2
number of cpus[0]: 1
thresholds - low[0]: 1, high[0]: 3
dynamic threshold adjustments - misbehave_adjust[0]: 0, cpu_util_adj[0]: 2
dynamic thresholds - low[0]: 3, high[0]: 5
running cnt[0]: 1, runnable cnt[0]: 3
flags: 0x0
debug: 0x0
all pointers:
num_latches 300 current 222 chg_class 0x74e364a0 chg_state 0x74e42020
class_list 0x74dfaa88,top_plan 0x7084e9d8, plan_list 0x74e03d38
heaps - kgsk subheap 0x74e142f0, plan heap 0x7b5d7438
backgrounds in_sched (pids):

.....
..........
...............
Redo Log Management (from krsk_dump_rlm)
  SRL min count:  0
  SRL max count:  0
  SRL min avail:  0
  SRL file size:  0
  SRL block size: 0
  SRL use FRA :   FALSE
So, if you want to dig in deep and want more proofs and details about the incident, SYSTEMSTATE dumps is a great source of all internals that were involved at the time of the problem. This isn’t limited to row locking problems, you can generate it for all sort of events, problems or issues i.e. Row cache, latch free, LC Locks, CBC are few of the common ones …
‘Outline Data’ section displays the list of hints that would be needed to replicate the execution plan, even if the statistics change., but in case of a complex execution plans it comes with lot of strange looking and obscure terms used. As there isn’t any published explanation of stored outline hints, so today’s post is to decipher few of the terms that you see in an outline data of an execution plan.
Okay, coming back to the post, let me quickly generate the outline data for one of the test SQL and will try to explain about each of the hints, query blocks, aliases and other representations used.
SQL>
SQL> explain plan for
SELECT d.department_name,e.employee_name
FROM departments d
LEFT OUTER JOIN employees e ON d.department_id = e.department_id
WHERE d.department_id >= 30
ORDER BY d.department_name, e.employee_name;

Explained.

SQL> select * from table(dbms_xplan.display('PLAN_TABLE',NULL,'+alias +outline'));

PLAN_TABLE_OUTPUT
---------------------------------------------------------------------------------------------------------
Plan hash value: 3871261979
-----------------------------------------------------------------------------------
| Id  | Operation           | Name        | Rows  | Bytes | Cost (%CPU)| Time     |
-----------------------------------------------------------------------------------
|   0 | SELECT STATEMENT    |             |     4 |   168 |     7  (15)| 00:00:01 |
|   1 |  SORT ORDER BY      |             |     4 |   168 |     7  (15)| 00:00:01 |
|*  2 |   HASH JOIN OUTER   |             |     4 |   168 |     6   (0)| 00:00:01 |
|*  3 |    TABLE ACCESS FULL| DEPARTMENTS |     2 |    44 |     3   (0)| 00:00:01 |
|*  4 |    TABLE ACCESS FULL| EMPLOYEES   |     6 |   120 |     3   (0)| 00:00:01 |
-----------------------------------------------------------------------------------

Query Block Name / Object Alias (identified by operation id):
-------------------------------------------------------------
   1 - SEL$2BFA4EE4
   3 - SEL$2BFA4EE4 / D@SEL$1
   4 - SEL$2BFA4EE4 / E@SEL$1

Outline Data
-------------
  /*+
      BEGIN_OUTLINE_DATA
      USE_HASH(@"SEL$2BFA4EE4" "E"@"SEL$1")
      LEADING(@"SEL$2BFA4EE4" "D"@"SEL$1" "E"@"SEL$1")
      FULL(@"SEL$2BFA4EE4" "E"@"SEL$1")
      FULL(@"SEL$2BFA4EE4" "D"@"SEL$1")
      OUTLINE(@"SEL$1")
      OUTLINE(@"SEL$2")
      ANSI_REARCH(@"SEL$1")
      OUTLINE(@"SEL$8812AA4E")
      ANSI_REARCH(@"SEL$2")
      OUTLINE(@"SEL$948754D7")
      MERGE(@"SEL$8812AA4E" >"SEL$948754D7")
      OUTLINE_LEAF(@"SEL$2BFA4EE4")
      ALL_ROWS
      DB_VERSION('19.1.0')
      OPTIMIZER_FEATURES_ENABLE('19.1.0')
      IGNORE_OPTIM_EMBEDDED_HINTS
      END_OUTLINE_DATA
  */

Predicate Information (identified by operation id):
---------------------------------------------------

   2 - access("D"."DEPARTMENT_ID"="E"."DEPARTMENT_ID"(+))
   3 - filter("D"."DEPARTMENT_ID">=30)
   4 - filter("E"."DEPARTMENT_ID"(+)>=30)
As per the above outline data captured for the execution plan, the very first entry is USE_HASH(@”SEL$2BFA4EE4″ “E”@”SEL$1”) This represents the use of HASH join methods used in the query. Other join method outline options you might see are USE_NL and USE_MERGE. Here in our example we’ve used the LEFT OUTER JOIN which will return all valid rows from the table on the left side of the JOIN keyword, that’s table EMPLOYEE (alias ‘E’) along with the values from the table on the right side.
i.e LEFT OUTER JOIN employees e ON d.department_id = e.department_id
LEADING(@”SEL$2BFA4EE4″ “D”@”SEL$1” “E”@”SEL$1”) The LEADING hints specifies the exact join order for the SQL that is followed by the optimizer in the plan. It displays the join order as an ordered list of table aliases and query block names. The aliases appears in the ordering in which we access those tables in the query.
The first part of the hint @”SEL$2BFA4EE4″ represents the main SELECT block and if you closely see the full hint definition you will see “D”@”SEL$1”, where “SEL$1” is the query block name for table alias ‘D’ for Department table, which is followed by “E”@”SEL$1”, that represents query block name “SEL$1” on second table joined ‘E’ for Employee table.
FULL(@”SEL$2BFA4EE4″“E”@”SEL$1”) & FULL(@”SEL$2BFA4EE4″ “D”@”SEL$1”) are what you see next and these two hints for FULL TABLE SCANS on table alias “E”, that is EMPLOYEE table, followed by FTS on table alias “D”, that is DEPARTMENT table. Same you can see in the execution plan too.
OUTLINE(@”SEL$1″) & OUTLINE(@”SEL$2″) These two OUTLINE hints correspond to initial and the intermediate query blocks.
ANSI_REARCH(@”SEL$1″) This is the hint that instructs the optimizer to re-architecture of ANSI left, right, and full outer joins. In our case this was to re-arch the left outer join.
MERGE(@”SEL$8812AA4E” >”SEL$948754D7″) is the MERGE query block hint. SEL$8812AA4E and SEL$948754D7 are the transformed query blocks.
OUTLINE_LEAF(@”SEL$2BFA4EE4″) This hint builds an outline leaf for the specified query block. In our example it represents that the query block SEL$2BFA4EE4 is a “final” query block that has actually been subject to independent optimization. Outline leaf cannot be transformed. You can see multiple outline_leaf hints for the query blocks.
IGNORE_OPTIM_EMBEDDED_HINTS is a special hint instructs the CBO to ignore most of all the other supplied hints.
ALL_ROWS This hint instructs to optimize the query/statement block for best throughput with lowest resource utilization.
DB_VERSION(‘19.1.0’) & OPTIMIZER_FEATURES_ENABLE(‘19.1.0’) these two hints allows for the CBO to process the SQL on the said version of the database, 19.1.0 in our case.
Few others that you might see in OUTLINE DATA sections and are easy to decipher are INDEX_RS_ASC (Index Range Scan in ascending order) and it happens when the INDEX RANGE SCAN is used as an access path/method in SQL execution plan. Few others that you can see in case of Nested Loop Joins are NLJ_BATCHING which happens when Oracle batches multiple physical I/O requests and process them using a vector I/O (array) instead of processing them one at a time, and batching improves performance because it uses asynchronous reads.. Few others that you can see in case of NL’s are USE_NL, NLJ_PREFETCH etc.
INDEX_FFS in case of Index Fast Full Scans and the list is long …
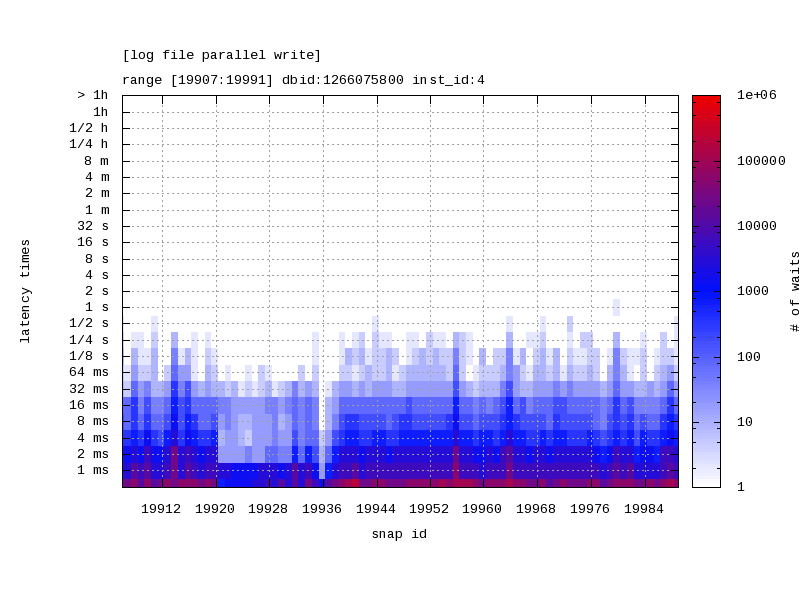
Today’s post if about a brilliant tool/script that I frequently use to get the outputs/graphs for customer meetings, presentations and for quick analysis of any performance problem …
This is one of the awesome Oracle provided tool/script that generates a heat map of latency times for a given wait event. The script takes the output from DBA_HIST_EVENT_HISTOGRAM and produces a heat map and a JPG version of the heat map is also produced representing the wait time latency for the given wait event over a specific time frame identified by range of snapshots.
Source : Script to Display Latency Wait Time From DBA_HIST_EVENT_HISTOGRAM Using Heat Map (Doc ID 1931492.1)
Note: This script queries ASH views, specially DBA_HIST_EVENT_HISTOGRAM which requires license as its part of the Diagnostics Pack on Oracle EE
The scripts takes the following input parameters:
Snapshot id range (first snapshot id and last snapshot id)