Tales From A Lazy Fat DBA

Its all about Databases & their performance, troubleshooting & much more …. ¯\_(ツ)_/¯

Archive for October, 2021

DDL stalled Golden Gate replicat : A quick damage control !

Posted by FatDBA on October 31, 2021

Hi Everyone,

Recently I was asked to check a mono-directional Integrated Golden Gate (Version 12.3.0.1.2) replication problem where the replicat was not processing the data and got struck with a huge lag of ~ 3.5 hours. Customer reported that the GG stuck due to CREATE INDEX statements running from last 3 hours and want to skip those transactions.

This being an ad-hoc request, I didn’t had any direct access to their systems and can only ask for files or outputs from their operations team. And as per reports shared, yes, there was a delay of around 3.5 hours for the replicat and was showing in RUNNING state.

-- Process stats on the target
GGSCI (cana01db66664b.prod.sdt.monkey12.se) 1> info all
Program     Status      Group       Lag at Chkpt  Time Since Chkpt
MANAGER     RUNNING
REPLICAT    RUNNING     TORONTO       03:29:11      00:00:03


-- From replicat parameter file
--DDL Options Used --
DDL INCLUDE MAPPED OBJNAME PDIXIT.*
DDLERROR DEFAULT IGNORE
DDLERROR 942 IGNORE
DDLERROR 955 IGNORE
DDLERROR 1435 IGNORE INCLUDE OPTYPE ALTER OBJTYPE SESSION
DDLERROR 904 IGNORE
DDLERROR 1430 IGNORE

While I was examining their parameter file saw they’re using BATCHSQL and HANDLECOLLISIONS to improve performance. Updated them that the use of the HANDLECOLLISIONS parameter can also cause performance issues if there are collisions since there needs to be additional processing done with those records. Hence, It is recommended to remove this parameter, if you are “not doing your initial load” for your tables. Most of transactions are happening in normal mode, hence, asked them to remove BATCHSQL parameter too.

Next, I asked them to try with DDLOPTIONS REPORT to be set in the parameter file, as this settings causes Integrated Extract to write a step-by-step history of all DDL operations captured to it’s report file; which is very useful when troubleshooting DDL replication issues. After they made a change to the parameter file and a bounce of replicat, I checked the logs, and per logs, below DDL was already executed

--> 2021-10-20 08:19:30 INFO OGG-00489 DDL is of mapped scope, after mapping new operation [create index "PDIXIT"."IDX_TEST121" on "PDIXIT"."TAB12"(C1666600563,C737666607) (size 82)]. 

However , DDL error ignored due to ORA-04021 and as they have DDLERROR ignore parameters in parameter file.

--> 2021-10-20 08:34:32 INFO OGG-00492 DDL error ignored: error code [DEFAULT], filter [include all (default)], error text [Error code [4021], ORA-04021: timeout occurred while waiting to lock object PDIXIT.IDX_TEST121 SQL create index "PDIXIT"."IDX_TEST121" on "PDIXIT"."TAB12"(C1666600563,C737666607) /* GOLDENGATE_DDL_REPLICATION */].

Asked them to check whether the index “PDIXIT”.”IDX_TEST121″ has been created on the target. If not then they may manually need to create this index on the target, but as per them, the index statement can be ignored and they only want to move the GG further, as their entire processing system was stopped and caused a massive delay.

Sid,Ser#      USERNAME      STATUS          SQL_ID          SQL_CHILD_NUMBER SQL_HASH_VALUE Logon Time    OSUser@Machine         pid   
TERMINAL PROGRAM                            MODULE
------------- ------------- --------------- --------------- ---------------- -------------- ------------- -------------------- ------- 
-------- ----------------------------------- -----------------------------------
6781,54621    GGGTEST       ACTIVE          u52csv8kcnb34                  0      617229321 23-AUG 06:55  oracle@cana01db66664 33329  r
eplicat@cana01db66664b.prod.sdt.er OGG-RCITSA00-CANA_DAIS_GREATC
                                                                                                          b.prod.sdt.monkey12.
                                                                                                          se

SQL> select sql_fulltext from gv$sql where sql_id='u52csv8kcnb34';


SQL_FULLTEXT
--------------------------------------------------------------------------------
create index "PDIXIT"."IDX_TEST121" on "PDIXIT"."TAB12"(C1666600563,C737666607
)  /* GOLDENGATE_DDL_REPLICATION */

create index "PDIXIT"."IDX_TEST121" on "PDIXIT"."TAB12"(C1666600563,C737666607
)  /* GOLDENGATE_DDL_REPLICATION */


                                    Locking                                                         Object                 Object            Lock
 SID     SER# STATUS                  User               Os user              Os Proc               Owner                   Name             Mode
------ ------ --------------- -------------------- -------------------- -------------------- -------------------- ------------------------- ----------
  6781  54621 ACTIVE          GGGTEST              oracle               33329                SYS                  OBJ$                    Row-X (SX)
  6781  54621 ACTIVE          GGGTEST              oracle               33329                PDIXIT               TAB12                   Share
 

I immediately asked them to kill those database session which was running above DDLs, and the lock issue got resolved the moment they killed them the lag was drained in few seconds. Next we added below parameter in to the replicat to exclude CREATE INDEX statements.

DDL INCLUDE MAPPED OBJNAME PDIXIT.* exclude INSTR 'CREATE INDEX' 

Customer also wanted to remove few of the rebuild online index DDLs, since those are taking too much time and causing lag in replicat, so we tried one more parameter to exclude INDEX REBUILD ONLINE operations from the specific user to happen on the target

DDL INCLUDE MAPPED OBJNAME PDIXIT.* exclude optype alter objtype 'INDEX' instr 'rebuild online'

And told them to remove added parameters to IGNORE DDLs and revert back to original once lag is zero and go back to original parameter of

DDL INCLUDE MAPPED OBJNAME PDIXIT.*

So, that’s how we fixed the issue and the flow we adopted to handle the situation.

Hope It Helped!
Prashant Dixit

Advertisement

Posted in Advanced, troubleshooting | Tagged: , , | 4 Comments »

Another 10053 trace viewer : Best of the Best …

Posted by FatDBA on October 21, 2021

Finally, I’ve got a working copy of my favorite 10053 optimizer trace viewer from one of my connection. This one was written by Sergei Romanenko. I love it because it allows direct jumps to the most important parts of the trace and also uses highlighter to improve the readability of the trace and optionally formats the final query after transformations. It’s pretty easy to use, and you can directly search the keywords within these big thumping traces. And you can also wrap your text and can also format the final query.

Click here to download!

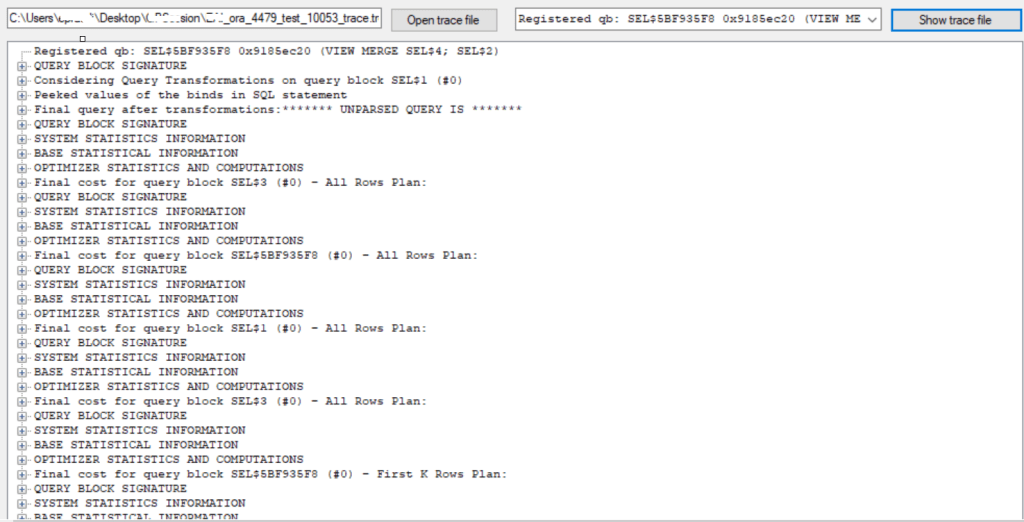
This is how the interface looks like.

Hope It Helped!
Prashant Dixit

Posted in Uncategorized | Tagged: , , , | 12 Comments »

10053 Trace Viewer : A life savior when handling colossal optimizer traces

Posted by FatDBA on October 18, 2021

Hi Everyone,

I am sure that my last post about 10053 debug traces has sparked some interest in optimizer cost calculations and estimations 🙂 As you guys are familiar that these traces aren’t that easy to digest and interpret, as they are pretty complicated, a humongous pile of internal cryptic information’s. One of the reader asked – If there are any tool that can help to at least format the trace and its sections ? Yes, there are few and one of my favorite is the 10053 viewer, and is what I am using from last few years now (lucky that I found that great blog post by Jonathan Lewis).

Click here if want to download it!

The tool is pretty easy to use! You have to click on ‘open trace file’ button and browse the 10053 trace from the system and click on ‘show trace file’ (next button).

Now load the trace file.

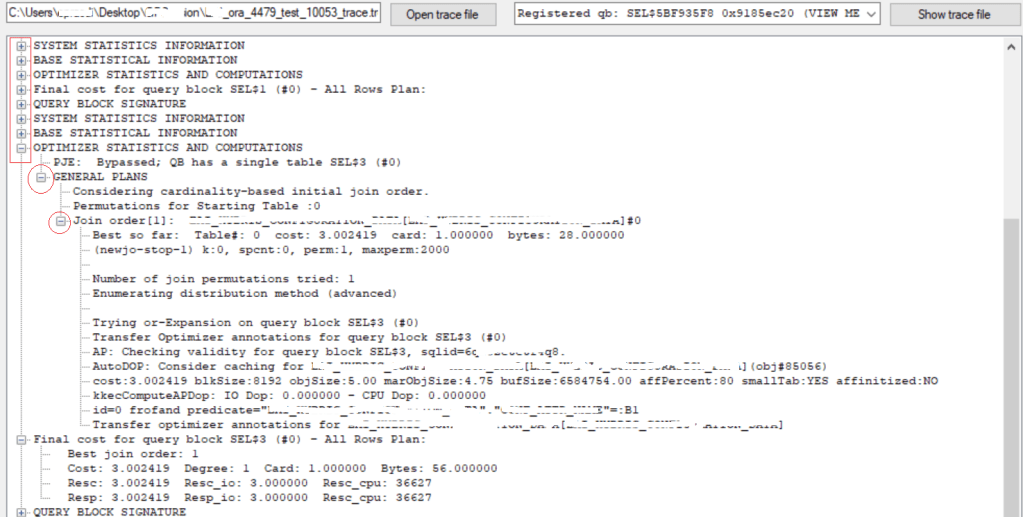
Now you’ll have a drop down view to select from. Once the trace is loaded, you can access sections by using ‘+’ to expand and ‘‘-‘ to minimize the section.

Expand to get more details about any particular section.

Hope It Helped!
Prashant Dixit

Posted in Uncategorized | Tagged: , , , | Leave a Comment »

Oracle event 10046 debug traces, they really aren’t that ‘complicated’ as we think – A 10046 trace break apart!

Posted by FatDBA on October 16, 2021

Hi Everyone,

Oracle has a long list of internal debug codes and this tracing is an art and a real craft. 10046 debug traces is one of the popular method for collecting extended SQL trace (like SQL_TRACE=TRUE) information for Oracle sessions. This we specially use to determine or distinguish the nature of a SQL Tuning problem. By setting this event, you can get detailed trace information of Oracle’s internal execution system analysis, call, wait, and bind variables, which plays a very important role in analyzing the performance of the system. This provides a great source and different levels of details about SQLs.

This post is all about breaking the parts of the trace and understand some of the critical sections to help understanding about SQL stats that it captures. I am not going to show how to generate them as the steps are pretty straight forward and are available on metalink.

Though there are multiple use cases of 10046, but I recently used them to understand a complicated and costly PL/SQL program which has got more than 1000 different SQL’s inside that it calls and I was interested to check on the costliest among them and why is that …. Though there are surely other ways to get the details of same level like using SQL Profiler, SQL Traces etc. but none of them provides the level of details what 10046 gives) and elapsed time parsing (prsela).

Above used snippet is from live 10046 sorted traces from a production system running on 10.2.0.5.0 (Yes, an old application). There isn’t much different that you will notice if you execute it on any new version of database too, there are very few changes that you will notice in case running on a latest oracle DB version. Okay let’s first understand few of the keywords or column names used in the result.

TKPROF: Release 10.2.0.5.0 - Production on Fri Sep 27 03:31:42 2021

Copyright (c) 1982, 2007, Oracle.  All rights reserved.

Trace file: dixitdb_ora_28282_10046_for_spdixitM.trc
Sort options: exeela  fchela  prsela  
********************************************************************************

SELECT COUNT(*) 
FROM
 CANONTALAB.DIXIT1_SAMPLE WHERE DIXIT1_SAMPLE_NO=:B1 


call     count       cpu    elapsed       disk      query    current        rows
------- ------  -------- ---------- ---------- ---------- ----------  ----------
Parse      134      0.00       0.00          0          0          0           0
Execute    862      0.03       0.03          0          0          0           0
Fetch      862     46.59      45.52          0    1235246          0         862
------- ------  -------- ---------- ---------- ---------- ----------  ----------
total     1858     46.63      45.55          0    1235246          0         862

Misses in library cache during parse: 1
Misses in library cache during execute: 1
Optimizer mode: ALL_ROWS
Parsing user id: 296  (CANONTALAB)   (recursive depth: 3)

Rows     Row Source Operation
-------  ---------------------------------------------------
      2  SORT AGGREGATE (cr=2866 pr=0 pw=0 time=114898 us)
      2   INDEX FAST FULL SCAN PK_DIXIT1_SAMPLE (cr=2866 pr=0 pw=0 time=114888 us)(object id 125001)


Rows     Execution Plan
-------  ---------------------------------------------------
      0  SELECT STATEMENT   MODE: ALL_ROWS
      2   SORT (AGGREGATE)
      2    INDEX   MODE: ANALYZED (UNIQUE SCAN) OF 'PK_DIXIT1_SAMPLE' 
               (INDEX (UNIQUE))

Elapsed times include waiting on following events:
  Event waited on                             Times   Max. Wait  Total Waited
  ----------------------------------------   Waited  ----------  ------------
  db file sequential read                        60       12.17         43.54
  
********************************************************************************

COUNT – Represents the umber of times a SQL statement was parsed, executed, or was fetched.
CPU – Total CPU time in seconds for all parse, execute, or fetch calls for the SQL.
ELAPSED – Total elapsed time in seconds for all parse, execute, or fetch calls for the SQL statement.
DISK – Total number of data blocks physically read from the datafiles on disk for all parse, execute, or fetch calls.
QUERY – Total number of buffers retrieved in consistent mode for all parse, execute, or fetch calls. Usually, buffers are retrieved in consistent mode for queries. A Consistent Get is where oracle returns a block from the block buffer cache but has to take into account checking to make sure it is the block current at the time the query started. Or is a normal reading of a block from the buffer cache. A check will be made if the data needs reconstructing from rollback info to give you a consistent view
CURRENT – Total number of buffers retrieved in current mode. Buffers are retrieved in current mode for statements such as INSERT, UPDATE, and DELETE. A DB block get (or current get in TKPROF) not only gets the block as it is right now, but it stops anyone else from getting that block (in current mode!) until we change it and release it. If someone else got there first, we wait.
ROWS – Total number of rows processed by the SQL statement. This total does not include rows processed by subqueries of the SQL statement. Also the rows gives statistics about 3 calls: Parse, Execute & Fetch
PARSE – Translates the SQL statement into an execution plan, including checks for proper security authorization and checks for the existence of tables, columns, and other referenced objects. This is where the physical and logical transformations and optimizations happens.
EXECUTE – Actual execution of the statement by Oracle. For INSERT, UPDATE, and DELETE statements, this modifies the data. For SELECT statements, this identifies the selected rows.
FETCH – Retrieves rows returned by a query. Fetches are only performed for SELECT statements.

Okay, now when all the column names and table entries are explained, let me try to explain what it represents in the form of those numbers.

It says 1235246 blocks were received in consistent mode during fetch operation. Since this is a SELECT statement, the blocks are shown during Fetch operation. If its a DML statement then blocks will be shown during Execute operation. Misses in library cache during each call. If there is no miss then it wont be mentioned. The 1 miss for the SQL is very much acceptable since when a SQL runs for the first time it need to be parsed and executed and execution plan will be stored. So parse and execute call will have 1 misses. If you see the statement parse call happened 134 times but the miss count is only 1, meaning that the statement was parsed only once and was stored in library cache. For next 133 parses the same parsed statement from library cache was used. So we have miss 1 and hit 133. Similarly execution plan was made only once and 861 times Oracle used same execution plan from library cache.

Now next jump to the row source operations and codes that it uses. cr = Consistent Reads, pr = Physical Reads, pw = Physical Writes, time = time taken by this step in microseconds. You might see some other codes used i.e. cost = cost incured by the step, size = represent the size of data in that step and card = cardinality.

So, the query was found doing an UNIQUE SCAN on it’s primary key index with name PK_DIXIT1_SAMPLE in ALL_ROWS mode and which is pretty understood as an equality predicate was used and the unique or primary key constraint was sufficient by itself to produce an index unique scan. And finally it shows wait event details and is pretty straight forward and says that it waits on ‘db file sequential read‘ with max wait time of 12.17

With the values above we need make a decision to whether to tune the SQL or not. Unless we have a locking problem or bad performing SQLs we shouldn’t worry about CPU time or the elapsed time. because timings come into consideration only when we have bad performing SQLs. The important factor is the number of block visits, both query (that is, subject to read consistency) and current (that is, not subject to read consistency). Segment headers and blocks that are going to be updated are acquired in current mode, but all query and subquery processing requests the data in query mode.

Hope It Helped
Prashant Dixit

Posted in Uncategorized | Tagged: , , , | 4 Comments »

A ‘simple’ dissection of an optimizer decision and cost using Oracle 10053 trace event … Yes, it’s simple!

Posted by FatDBA on October 10, 2021

Hi Guys,

In today’s post I will try to explain the cost, stats (system & object level), join order, cardinality & the selectivity calculations about execution plan entries and will take help of the infamous 10053 optimizer traces. Though 10053 is notoriously complicated, detailed and extensive even for simple SQL statements but always has the wealth of information about optimizer decisions like plan directives, peeked bind values, predicate move around, Join elimination stats, query transformations, fix controls, join eliminations, join orders (easily complicated) & other computations or calculations. So, I will try to keep it as simple as I can.

About ways of generating the report, you can access it via ALTER SESSION, ORADEBUG or even through DBMS_SQLDIAG.DUMP_TRACE (does not require diagnostic pack). There are multiple use cases of using 10053, but the most common is when you want to compare any best or worst plans and you want to see the difference in cost calculations.

Alright, so this is the complete SQL statement followed up by its execution plan and predicate details.

SELECT * FROM (SELECT n.object_inst_id, n.name, n.type, rownum idx
FROM testsch.PDI_FBI_HASHAH1 n join testsch.PDI_FBI_HASHAH1_b on  TESTID_name = :"SYS_B_00"  and owning_object_id = n.object_inst_id
and n.name = NVL(null, n.name) AND n.status = NVL(:"SYS_B_01", :"SYS_B_02")
AND n.type = NVL(:"SYS_B_03", n.type) AND NVL(n.test_allocation,:"SYS_B_04") = NVL(NVL(null, n.test_allocation),:"SYS_B_05")
AND  NVL(n.number_usage, :"SYS_B_06")=:"SYS_B_07" AND ( n.owner IS NULL OR instr(lower(n.owner), :"SYS_B_08") > :"SYS_B_09" )
AND n.assigned_csn_id IS NULL AND n.locked_on IS NULL AND n.lock_owner IS NULL
AND (n.lock_id IS NULL OR n.LOCK_DATE <= (sysdate - NVL(n.lock_period,
(SELECT dixi_trait_values FROM testsch.PDI_HASHIS_MERGEDINFO_DATA WHERE HASH_BATTR_SHA = :"SYS_B_10")) / :"SYS_B_11" / :"SYS_B_12"))
AND target_object_id = :"SYS_B_13" ORDER BY TO_NUMBER(n.name)) OUTPUTS WHERE OUTPUTS.idx between :"SYS_B_14" and :"SYS_B_15"


----------------------------------------------------------------------------------------------------------------
| Id  | Operation                      | Name                          | Rows  | Bytes | Cost (%CPU)| Time     |
----------------------------------------------------------------------------------------------------------------
|   0 | SELECT STATEMENT               |                               |     2 |   364 |   107   (0)| 00:00:01 |
|*  1 |  VIEW                          |                               |     2 |   364 |   107   (0)| 00:00:01 |
|   2 |   COUNT                        |                               |       |       |            |          |
|   3 |    NESTED LOOPS                |                               |     2 |   340 |   107   (0)| 00:00:01 |
|*  4 |     TABLE ACCESS BY INDEX ROWID| PDI_FBI_HASHAH1               |  6719 |   505K|   106   (0)| 00:00:01 |
|*  5 |      INDEX FULL SCAN           | PDI_FBI_NNAME_UTYPE_STA_NPFIX |  3065 |       |     7   (0)| 00:00:01 |
|*  6 |      TABLE ACCESS FULL         | PDI_HASHIS_MERGEDINFO_DATA    |     1 |    28 |     3   (0)| 00:00:01 | --> How the CBO decided cost 3 ? 
|*  7 |     INDEX RANGE SCAN           | IDX_TRNNUMBERB_SMOKE          |     1 |    93 |     1   (0)| 00:00:01 |
----------------------------------------------------------------------------------------------------------------


Predicate Information (identified by operation id):
---------------------------------------------------
   1 - filter("OUTPUTS"."IDX"<=10 AND "OUTPUTS"."IDX">=1)
   4 - filter("N"."TYPE"='MOBILE' AND ("N"."OWNER" IS NULL OR INSTR(LOWER("N"."OWNER"),'dna oyj')>0)
              AND NVL("N"."NUMBER_USAGE",'External')='Internal' AND "N"."ASSIGNED_CSN_ID" IS NULL AND
              NVL("N"."TEST_ALLOCATION",'EAI')=NVL(NVL(NULL,"N"."TEST_ALLOCATION"),'EAI') AND "N"."LOCKED_ON" IS NULL
              AND "N"."LOCK_OWNER" IS NULL AND ("N"."LOCK_ID" IS NULL OR
              "N"."LOCK_DATE"<=SYSDATE@!-NVL("N"."LOCK_PERIOD", (SELECT "DIXI_TRAIT_VALUES" FROM
              "TESTSCH"."PDI_HASHIS_MERGEDINFO_DATA" "PDI_HASHIS_MERGEDINFO_DATA" WHERE
              "HASH_BATTR_SHA"='MY_CALL_DURATION'))/60/24))
   5 - access("N"."STATUS"='Available')
       filter("N"."STATUS"='Available')
   6 - filter("HASH_BATTR_SHA"='MY_CALL_DURATION')
   7 - access("TESTID_NAME"='ind.fatdba.application.dss.more.production.BESTID.PDINumberBestSubClass'
               AND "OWNING_OBJECT_ID"="N"."OBJECT_INST_ID" AND "TARGET_OBJECT_ID"=21)

Let’s try to understand how optimizer come up with the cost numbers, how it derives these values, on what basis and what all it considers during the calculations. I will explaining about one of the access operation at Line ID 6 of the plan where it’s doing a TABLE ACCESS FULL on table PDI_HASHIS_MERGEDINFO_DATA and has a final cost of 3 associated with it.

So, what it is ? what all was happened under the hood by the optimizer to get this value of 3 for this operation ?

This is the subquery for which we will be checking the cost calculations within 10053 trace files.

(SELECT dixi_trait_values FROM testsch.PDI_HASHIS_MERGEDINFO_DATA WHERE HASH_BATTR_SHA = :"SYS_B_10")) / :"SYS_B_11" / :"SYS_B_12"))

Let me replace the sys generated values with their original values, for this I will be checking under “Peeked values of the binds in SQL statement” section. The same you can get from ‘predicate information’ section of the execution plan too, but let’s stick to 10053 for the moment.

*******************************************
Peeked values of the binds in SQL statement
*******************************************
----- Bind Info (kkscoacd) -----
 Bind#0
  oacdty=01 mxl=128(73) mxlc=00 mal=00 scl=00 pre=00
  oacflg=10 fl2=0100 frm=01 csi=873 siz=128 off=0
  kxsbbbfp=7f3791745ee0  bln=128  avl=73  flg=09
  value="ind.fatdba.application.dss.more.production.BESTID.PDINumberBestSubClass"
...
......
........

 Bind#10
  oacdty=01 mxl=32(19) mxlc=00 mal=00 scl=00 pre=00
  oacflg=10 fl2=0100 frm=01 csi=873 siz=32 off=0
  kxsbbbfp=7f3791745d48  bln=32  avl=19  flg=09
  value="MY_CALL_DURATION"
 Bind#11
  oacdty=02 mxl=22(02) mxlc=00 mal=00 scl=00 pre=00
  oacflg=10 fl2=0100 frm=00 csi=00 siz=24 off=0
  kxsbbbfp=7f3791745d20  bln=22  avl=02  flg=09
  value=60
 Bind#12
  oacdty=02 mxl=22(02) mxlc=00 mal=00 scl=00 pre=00
  oacflg=10 fl2=0100 frm=00 csi=00 siz=24 off=0
  kxsbbbfp=7f3791745cf8  bln=22  avl=02  flg=09
  value=24

Okay, let’s place them in the subquery.

SELECT dixi_trait_values FROM testsch.PDI_HASHIS_MERGEDINFO_DATA WHERE HASH_BATTR_SHA='MY_CALL_DURATION/60/24';

These are the contents of the column.

SQL> SELECT dixi_trait_values FROM testsch.PDI_HASHIS_MERGEDINFO_DATA;

DIXI_TRAIT_VALUES
-----------------
             60
            120
            200
             10
             60

Let’s check for access path analysis for this SQL.

***************************************
BASE STATISTICAL INFORMATION
***********************
Table Stats::
  Table: PDI_HASHIS_MERGEDINFO_DATA  Alias: PDI_HASHIS_MERGEDINFO_DATA
  #Rows: 5  SSZ: 0  LGR: 0  #Blks:  5  AvgRowLen:  31.00  NEB: 0  ChainCnt:  0.00  SPC: 0  RFL: 0  RNF: 0  CBK: 0  CHR: 0  KQDFLG: 1
  #IMCUs: 0  IMCRowCnt: 0  IMCJournalRowCnt: 0  #IMCBlocks: 0  IMCQuotient: 0.000000
try to generate single-table filter predicates from ORs for query block SEL$3 (#0)
finally: "PDI_HASHIS_MERGEDINFO_DATA"."DIXI_TRAIT_VALUES"=:B1

=======================================
SPD: BEGIN context at query block level
=======================================
Query Block SEL$3 (#0)
Applicable DS directives:
Return code in qosdSetupDirCtx4QB: NODIR
=====================================
SPD: END context at query block level
=====================================
Access path analysis for PDI_HASHIS_MERGEDINFO_DATA
***************************************
SINGLE TABLE ACCESS PATH 
  Single Table Cardinality Estimation for PDI_HASHIS_MERGEDINFO_DATA[PDI_HASHIS_MERGEDINFO_DATA] 
  SPD: Return code in qosdDSDirSetup: NOQBCTX, estType = TABLE
  Column (#1): CONF_ATTR_NAME(VARCHAR2)
    AvgLen: 24 NDV: 5 Nulls: 0 Density: 0.200000
  Table: PDI_HASHIS_MERGEDINFO_DATA  Alias: PDI_HASHIS_MERGEDINFO_DATA
    Card: Original: 5.000000  Rounded: 1  Computed: 1.000000  Non Adjusted: 1.000000
  Scan IO  Cost (Disk) =   3.000000
  Scan CPU Cost (Disk) =   36377.200000
  Total Scan IO  Cost  =   3.000000 (scan (Disk))
                         + 0.000000 (io filter eval) (= 0.000000 (per row) * 5.000000 (#rows))
                       =   3.000000
  Total Scan CPU  Cost =   36377.200000 (scan (Disk))
                         + 250.000000 (cpu filter eval) (= 50.000000 (per row) * 5.000000 (#rows))
                       =   36627.200000
  Access Path: TableScan
    Cost:  3.002419  Resp: 3.002419  Degree: 0
      Cost_io: 3.000000  Cost_cpu: 36627
      Resp_io: 3.000000  Resp_cpu: 36627
  Best:: AccessPath: TableScan
         Cost: 3.002419  Degree: 1  Resp: 3.002419  Card: 1.000000  Bytes: 0.000000

.....
.......

OPTIMIZER STATISTICS AND COMPUTATIONS
PJE:  Bypassed; QB has a single table SEL$3 (#0)
***************************************
GENERAL PLANS
***************************************
Considering cardinality-based initial join order.
Permutations for Starting Table :0
Join order[1]:  PDI_HASHIS_MERGEDINFO_DATA[PDI_HASHIS_MERGEDINFO_DATA]#0
***********************
Best so far:  Table#: 0  cost: 3.002419  card: 1.000000  bytes: 28.000000
***********************

If you check above you will see it considers the CPU & IO to generate the final cost values and that’s what we already know. Cost is the amount of work the optimizer estimates to run your query via a specific plan. The optimizer generally prefers lower cost plans. The optimizer’s cost model accounts for the IO, CPU, and network resources that will be used by the query.
IO_COST: I/O cost of the operation as estimated by the query optimizer’s approach. The value of this column is proportional to the number of data blocks read by the operation. For statements that use the rule-based approach, this column is null.
CPU_COST: CPU cost of the operation as estimated by the query optimizer’s approach. The value of this column is proportional to the number of machine cycles required for the operation. For statements that use the rule-based approach, this column is null.

At the same time it checks for dictionary stats to get table level information i.e. average row lenght, blocks, total rows and takes help of metrics NDV (nuber of distinct values), nulls, density of rows etc. to calculate the original cardinality of 5 (number of distinct entries) and the rounded cardinality of 1 – this SQL has resulted only into 1 row as an output, hence 1 is the rounded cardinality.

So, the main elements are ‘Scan IO Cost (Disk)’, ‘Scan CPU Cost (Disk)’ which finally derives the ‘Total Scan IO Cost’ value of 3.

That’s how the optimizer has calculated this value of 3 for this specific access operation, similarly you understand any of the other access entries in plan, and their associated costs.

If you want to read more on 10053 traces, I recommend you a great article by Wolfgang Breitling, Jonathan Lewis (his book cost-based Oracle fundamentals) & few posts from Maria Colgan.

Hope It Helped
Prashant Dixit

Posted in Uncategorized | Tagged: , | 1 Comment »

 
%d bloggers like this: