


10053 Trace Viewer : A life savior when handling colossal optimizer traces
Posted by FatDBA on October 18, 2021
Hi Everyone,
I am sure that my last post about 10053 debug traces has sparked some interest in optimizer cost calculations and estimations 🙂 As you guys are familiar that these traces aren’t that easy to digest and interpret, as they are pretty complicated, a humongous pile of internal cryptic information’s. One of the reader asked – If there are any tool that can help to at least format the trace and its sections ? Yes, there are few and one of my favorite is the 10053 viewer, and is what I am using from last few years now (lucky that I found that great blog post by Jonathan Lewis).
Click here if want to download it!
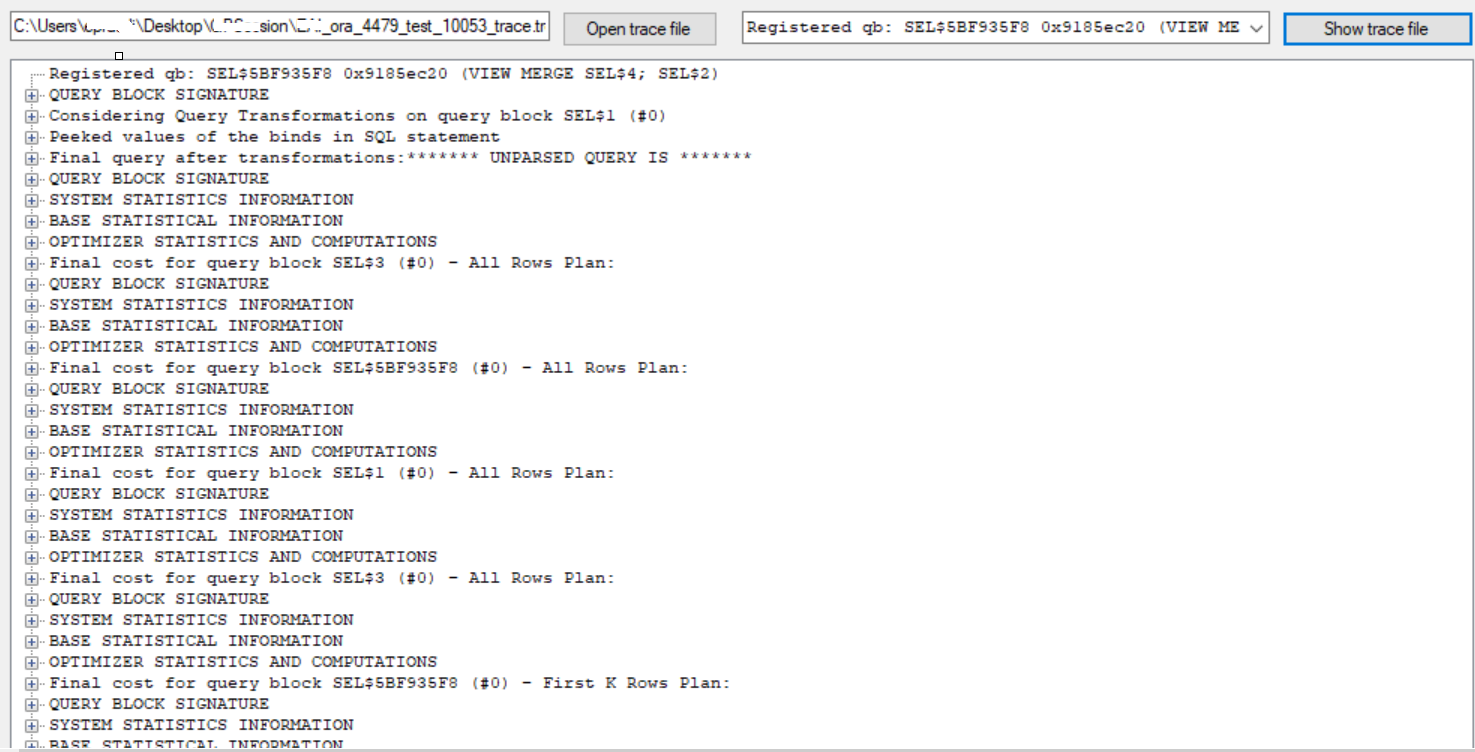
The tool is pretty easy to use! You have to click on ‘open trace file’ button and browse the 10053 trace from the system and click on ‘show trace file’ (next button).

Now load the trace file.

Now you’ll have a drop down view to select from. Once the trace is loaded, you can access sections by using ‘+’ to expand and ‘‘-‘ to minimize the section.
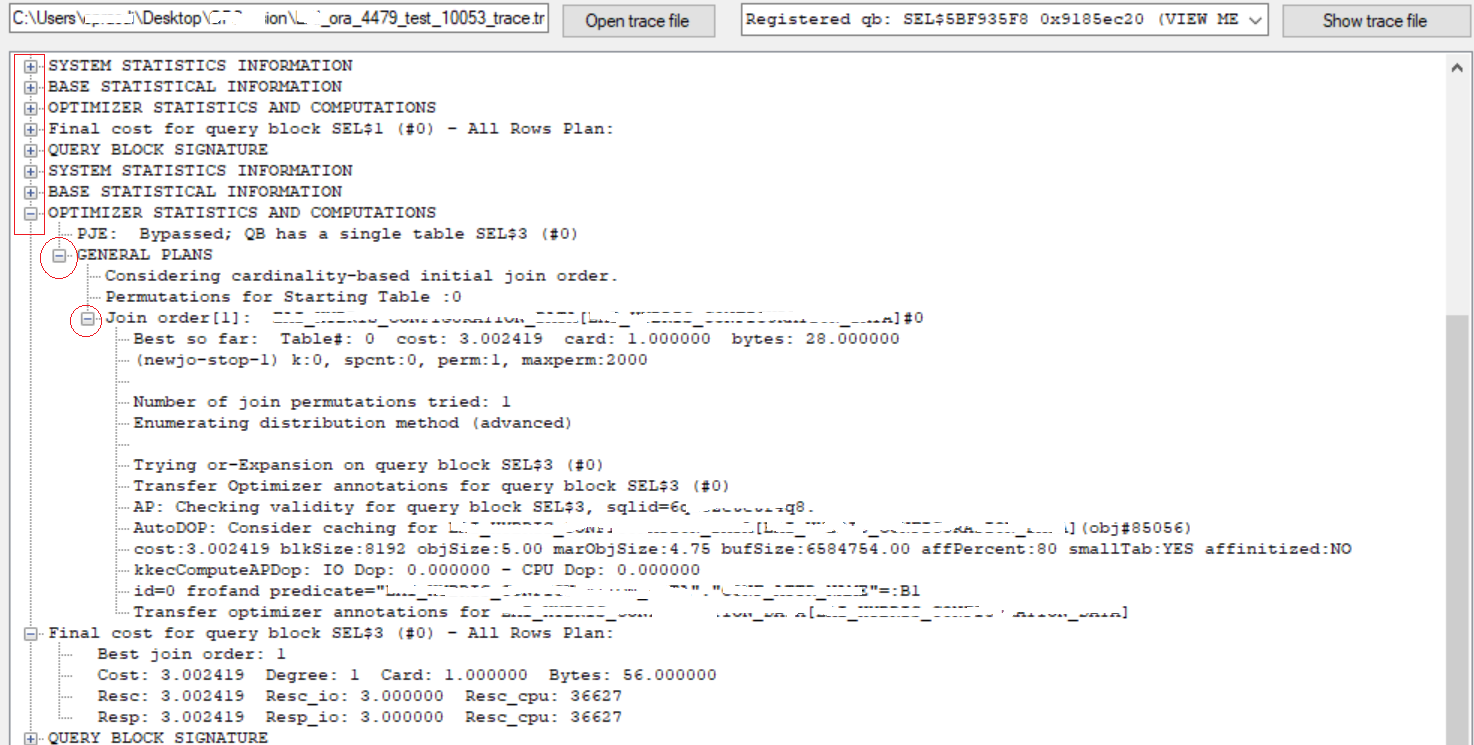
Expand to get more details about any particular section.
Hope It Helped!
Prashant Dixit

Leave a comment