I’m excited to announce that I’ve authored my first blog post on Oracle’s multi-cloud observability and management platform. My post “Real Application Testing for Capture and Replay in a PDB, a great addition in 19c.” recently got published by Oracle Corporation on their blogging platform 🙂 🙂 🙂 🙂
CHA GUI (CHAG) is a graphical user interface for Cluster Health Advisor (CHA) which was earlier internal to Oracle teams but its now available to the customers. It is a standalone, interactive, real-time capable front-end/GUI to the classic CHA utility. Oracle 12.2 is the first version that is supported by CHA GUI (CHAG). You only require RAC license and there is no need for any additional license to use CHAG tool.
CHAG communicates directly with the Grid Infrastructure Management Repository (GIMR) using a JDBC connection.. GIMR is mandatory for CHAG to work as it fetches the data out of the GIMR repository. In case you don’t have the GIMR repo installed, for example on 19c databases as GIMR is optional there, you can use the local mode for CHAG to work, but in absence of GIMR mgmt repo you will not get the historical abilities to go back in time.
Installation is quite simple, you have to download and unzip the software on one of your cluster machines and I recommend not to dump it inside your ORACLE HOME, but in a separate place. CHAG requires X11 or XHost and Java as it uses Java Swing to open the GUI. CHAG can operate in several modes:
With a default connection to GIMR Database. This option initiate a live session and provide real-time monitoring.
With a user specified location of a GIMR Database (option -P). This option initiate a live session and provide real-time monitoring.
Read in a text file with monitoring data (option -f). This initiates a passive session, which allow to analyze textual data extracted from a GIMR, or data collected during a live session. This data is held in a “*.mdb” file.
Parse text file with data and generate JSON object with information similar to query “diagnosis” (option -C). This mode of operation ‘chag -C -f ‘ directs CHAG to parse a *.mdb file and to generate a summary of its content in JSON format.
For the offline mode you can get the “mdb” file to analyze using below command. Depending on the time model you will get n number of mdb files for the period.
About the usage, CHAG is invoked using the ‘chag’ script available in the bin directory of the CHA Home. CHAG is designed primarily for Cluster or Database experts. Usage is quite simple and straight forward, you can move the pointer/slider to choose any particular timeframe to catch problems, their cause and the corrective actions. You can use it both in real time and offline version, its just that for real time you have to be on any of the cluster node, for offline you can generate the MDB file (cha datafile) and can run it anywhere on the client machine with no need of oracle home and only Java will be needed.
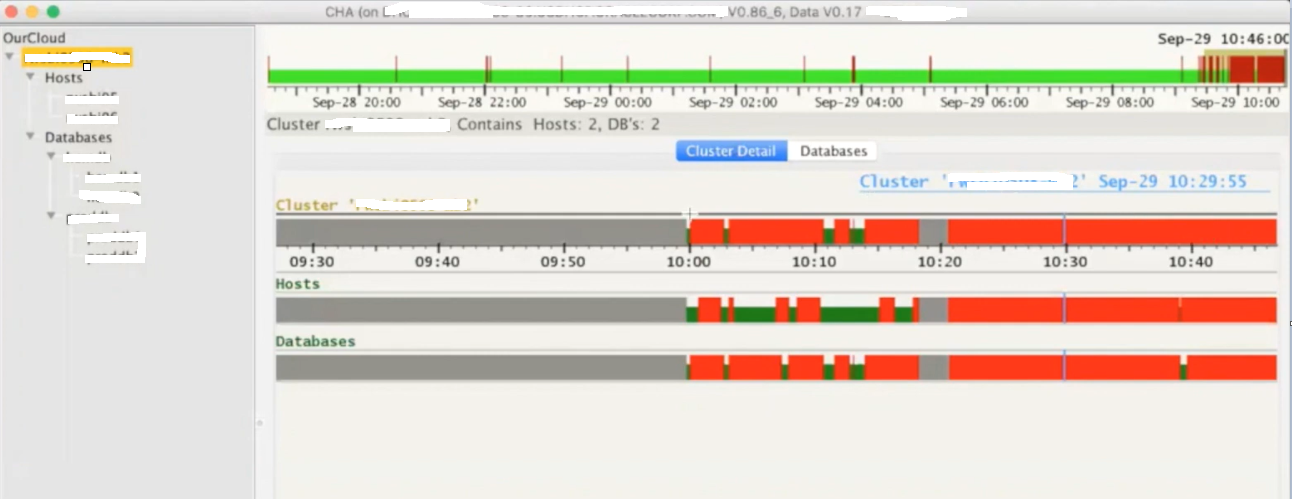
Below is the CHAG look and feel, its running on a 2 node RAC cluster where we have two databases installed. Here you see few color codes, where red colors means there were few problems during that interval.
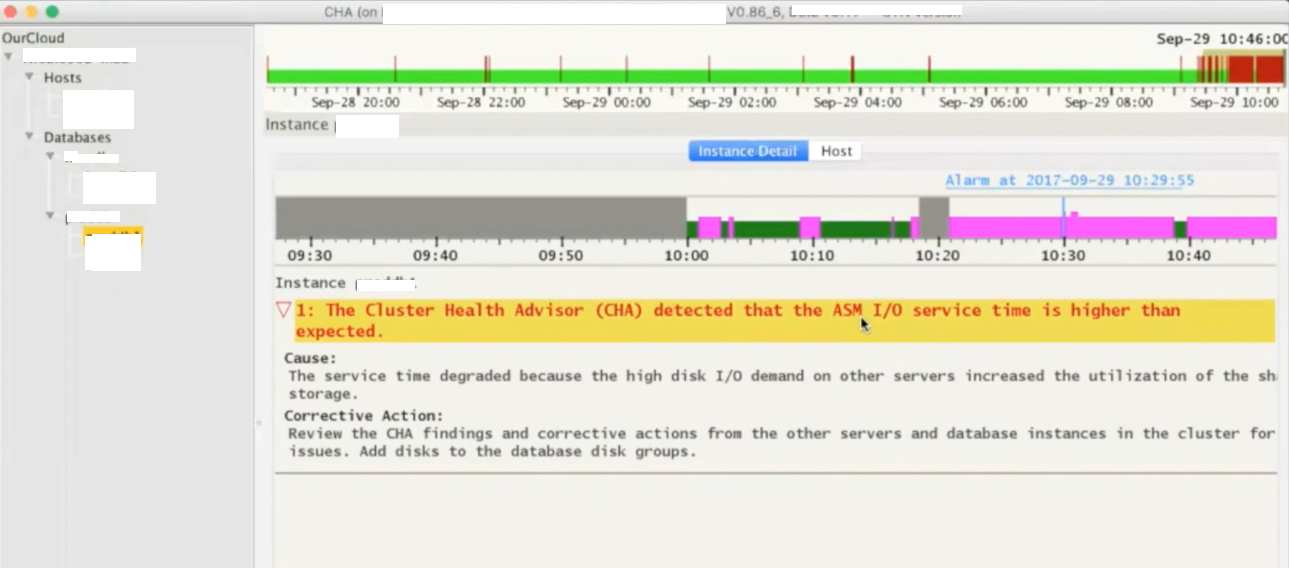
Next is how it explains more about any particular problem caught for the timeslot. Gives you cause and the corrective action, for example in below screenshot it has detected that the ASM IO service time is higher than the expected which points to the underlying IO Subsystem used by ASM disks.
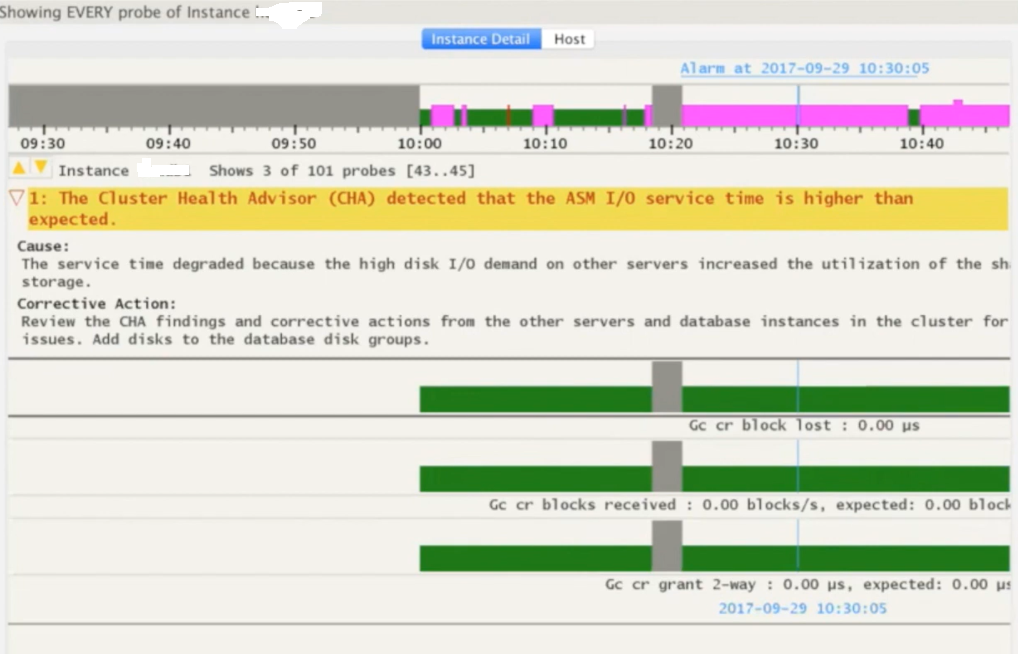
You can use SHIFT keys combinations to get wait event specific details for the selected time period.
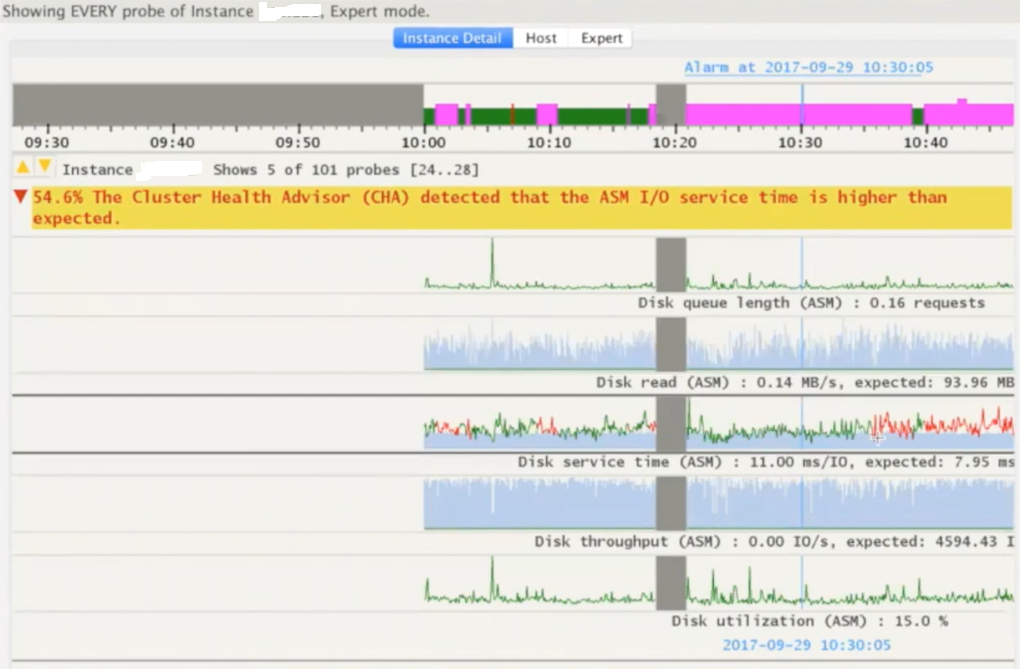
You can use few other SHIFT key combinations to present the same data in the form of line graphs.
Few more examples or problems detected by the CHAG. This time it was reporting for redo log writes which are slower and that is something expected as ASM IO is slow too means the entire IO subsystem is impacted.
I highly recommend all readers to go through Doc ID 2340062.1 on metalink for more details on Cluster Health Advisor Graphical User Interface – CHAG.
Recently I was working on a performance problem where customer reported few of their SQL statements going for parallelism even when they are not forcing DOP via any HINT, and all of the referenced table and underlying Indexes were with degree=1
I was asked to take a look, and I immediately checked if Auto DOP was the reason forcing unwanted parallelism, but parallel_degree_policy was set to MANUAL which means the auto DOP, statement queuing and in-memory parallel execution all were disabled.
SQL> show parameter parallel_degree_policy

NAME                                 TYPE        VALUE
------------------------------------ ----------- ------------------------------
parallel_degree_policy               string      MANUAL
Next, I thought to verify Table and Indexes general stats or details and I queried DBA_TABLES & DBA_INDEXES for Instances column, and found one of the table was set to value ‘DEFAULT’. If we have a value of DEFAULT set for INSTANCES, it will always force the query use DEFAULT degree of parallelism.
Let me explain the impact of having DEFAULT value for Instances, and how it forces SQL to spawn parallelism. For demo purpose, I am going to create a test table and an index with INSTANCES value set to DEFAULT.
[oracle@oracleontario ~]$ sqlplus / as sysdba

SQL*Plus: Release 19.0.0.0.0 - Production on Mon Dec 19 08:23:12 2022
Version 19.15.0.0.0

Copyright (c) 1982, 2022, Oracle.  All rights reserved.


SQL> create table fatdba_table as select * from dba_objects;

Table created.

SQL>
SQL> select count(*) from fatdba_table;

  COUNT(*)
----------
     74932

SQL>

SQL> create index fatdba_table_idx on fatdba_table(OBJECT_TYPE,object_name) parallel(DEGREE 1 INSTANCES DEFAULT);

Index created.

SQL>
SQL> select index_name,degree,instances from dba_indexes where index_name='FATDBA_TABLE_IDX';

INDEX_NAME                     DEGREE                                   INSTANCES
------------------------------ ---------------------------------------- ----------------------------------------
FATDBA_TABLE_IDX               1                                        DEFAULT

SQL>
Alright the stage is set, lets run a SQL statement and force it to use that Index and see its impact on the execution.
One of the crucial performance parameter for Golden gate extract process is TRANLOGOPTIONS which controls the way that it interacts with the transaction log. You can use multiple TRANLOGOPTIONS statements in the same parameter file, or you can specify multiple options within the same TRANLOGOPTIONS statement.
There are lot of performance related options i.e. INCLUDEAUX (AUX trails when reading audit trails), DBLOGREADERBUFSIZE etc. that you can use with TRANLOGOPTIONS parameter, but recently I’d tried one of the tuning parameter PERFORMANCEPROFILE with our medium intensity workload. It can be set to HIGH and MEDIUM (default). It helps achieve better performance by grouping the parameters that affect performance. Once the performance profile is set up, this option automatically configures the applicable parameters, to achieve the desired throughput and latency.
We’d used this parameter in one of our 21c (21.7.0) GG installation with TRANLOGOPTIONS PERFORMANCEPROFILE HIGH, but immediately we’d started seeing spikes in extract’s latency. This was might be because it increases the Extract’s read buffer size to 8MB and the rule to purge the extract read buffer is either when the buffer is full or there is no ingress records for 0.2 seconds. Therefore, any uninterrupted workload with Extract consumption rate below 8MB will result in integrated Extract latency to exceed 1 second.
We’d checked with Oracle support and as a quick temporary solution they’d suggested to not use PERFORMANCEPROFILE parameter with HIGH flag, as the Extract consumption/intake rates are below specific value, such as ~15 MB/sec to get ~0.5 second extract response times. Hence we’d set the buffer size to one-third of the redo generation rate in MB/sec to get ~0.3 second maximum Extract latency. They also marked this as Bug 33772499 for GG 21c for July 2022 release.
Trace File Analyzer (TFA) is one of the popular Oracle provided toolkit that is very useful when you are dealing with any ORA error and want to pack incident files or when you want to monitor your database using oratop (now part of tfa), or want to run orachk (part of tfa) for a health check of your entire Oracle software stack for issue detection. It also comes with support tools like OSWatcher, process watcher and darda which we all are very much familiar. Today’s post is about one of my favorite TFA utilities option/flag ‘Summary’ which is not that commonly used, but is one of the cool things that we you can do with the TFA.
For this post I have used TFA version 21.2.0.0.0, I suggest to use latest version as it comes with bug fixes and lot of new features.
Feature : ‘summary‘ This flag/function of TFA provides you a detailed (high level) real time status summary of your full DB system. It collects stats of your CRS, ASM, ACFS, Database, Patching Info, Network, Listeners and Operating System. Once you execute ‘summary’ mode within TFA command line (TFACTL), it will take you to tfactl_summary mode or SUMMARY Command-Line Interface (CLI) from where you can select from multiple options to view component wise statistics. The best part is you can even save the report in the form of HTML page (using option q) which is more fancy and easy to read version, otherwise text based is the default version.
Alright lets get started, I am going to call the ‘summary’ option and will see what is there for us.
Now when all statistics summaries are collected, this will automatically take us to the SUMMARY Command-Line Interface (tfactl_summary>) where if we use ‘list’ option will bring the entire chart of options to choose from (see above all 11 different areas). Next I am going to select option 3 to get ASM_OVERVIEW from tfactl_summary CLI which when selected will further take you to another linked CLI that is tfactl_summary_asmoverview> which will further gives you details of your entire cluster, like in my case I have node machines as a part of this cluster.
So basically the flow will be something like this tfactl —> Use summary command and enter into tfactl_summary —> Choose option from the list using ‘list’ command and enter into option related CLI (i.e. tfactl_summary_asmoverview>) and choose option or node to view stats.
Please take a look below for better understanding.
You can even save your output into an HTML file which is great for a quick view and very easy to present and transfer too. The option to generate report into HTML format is by calling “summary -overview -html” command within TFACTL and use option ‘q’ to save reports from tfactl_summary> CLI. Let’s see how to do that.
[root@nodeabc ~]#
[root@nodeabc ~]# tfactl
WARNING - AHF Software is older than 180 days. Please consider upgrading AHF to the latest version using ahfctl upgrade.
tfactl> summary -overview -html

  Executing Summary in Parallel on Following Nodes:
    Node : nodeabc
    Node : nodexyz

LOGFILE LOCATION : /u01/app/grid/oracle.ahf/data/repository/suptools/nodeabc/summary/root/20221012121321/log/summary_command_20221012121321_nodeabc_82905.log

  Component Specific Summary collection :
    - Collecting CRS details ... Done.
    - Collecting ASM details ... Done.
    - Collecting ACFS details ... Done.
    - Collecting DATABASE details ... Done.
    - Collecting PATCH details ... Done.
    - Collecting LISTENER details ... Done.
    - Collecting NETWORK details ... Done.
    - Collecting OS details ... Done.
    - Collecting TFA details ... Done.
    - Collecting SUMMARY details ... Done.

  Remote Summary Data Collection : In-Progress - Please wait ...
  - Data Collection From Node - nodexyz .. Done.

  Prepare Clusterwide Summary Overview ... Done
      cluster_status_summary

  COMPONENT   STATUS    DETAILS
+-----------+---------+---------------------------------------------------------------------------------------------------+
  CRS         PROBLEM   .-----------------------------------------------.
                        | CRS_SERVER_STATUS   : ONLINE                  |
                        | CRS_STATE           : ONLINE                  |
                        | CRS_INTEGRITY_CHECK : FAIL                    |
                        | CRS_RESOURCE_STATUS : OFFLINE Resources Found |
                        '-----------------------------------------------'
  ASM         PROBLEM   .-------------------------------------------------------.
                        | ASM_DISK_SIZE_STATUS : WARNING - Available Size < 20% |
                        | ASM_BLOCK_STATUS     : PASS                           |
                        | ASM_CHAIN_STATUS     : PASS                           |
                        | ASM_INCIDENTS        : PASS                           |
                        | ASM_PROBLEMS         : PASS                           |
                        '-------------------------------------------------------'
  ACFS        OFFLINE   .-----------------------.
                        | ACFS_STATUS : OFFLINE |
                        '-----------------------'
  DATABASE    PROBLEM   .-----------------------------------------------------------------------------------------------.
                        | ORACLE_HOME_DETAILS                                                        | ORACLE_HOME_NAME |
                        +----------------------------------------------------------------------------+------------------+
                        | .------------------------------------------------------------------------. | OraDB19000_home1 |
                        | | PROBLEMS | INCIDENTS | DB_BLOCKS | DATABASE_NAME | STATUS  | DB_CHAINS | |                  |
                        | +----------+-----------+-----------+---------------+---------+-----------+ |                  |
                        | | PROBLEM  | PROBLEM   | PASS      | FATDBA1       | PROBLEM | PROBLEM   | |                  |
                        | '----------+-----------+-----------+---------------+---------+-----------' |                  |
                        '----------------------------------------------------------------------------+------------------'
  PATCH       OK        .----------------------------------------------.
                        | CRS_PATCH_CONSISTENCY_ACROSS_NODES      : OK |
                        | DATABASE_PATCH_CONSISTENCY_ACROSS_NODES : OK |
                        '----------------------------------------------'
  LISTENER    OK        .-----------------------.
                        | LISTNER_STATUS   : OK |
                        '-----------------------'
  NETWORK     OK        .---------------------------.
                        | CLUSTER_NETWORK_STATUS :  |
                        '---------------------------'
  OS          OK        .-----------------------.
                        | MEM_USAGE_STATUS : OK |
                        '-----------------------'
  TFA         OK        .----------------------.
                        | TFA_STATUS : RUNNING |
                        '----------------------'
  SUMMARY     OK        .------------------------------------.
                        | SUMMARY_EXECUTION_TIME : 0H:1M:44S |
                        '------------------------------------'
+-----------+---------+---------------------------------------------------------------------------------------------------+


        ### Entering in to SUMMARY Command-Line Interface ###

tfactl_summary>list

  Components : Select Component - select [component_number|component_name]
        1 => overview
        2 => crs_overview
        3 => asm_overview
        4 => acfs_overview
        5 => database_overview
        6 => patch_overview
        7 => listener_overview
        8 => network_overview
        9 => os_overview
        10 => tfa_overview
        11 => summary_overview

tfactl_summary>q

        ### Exited From SUMMARY Command-Line Interface ###

--------------------------------------------------------------------
REPOSITORY  : /u01/app/grid/oracle.ahf/data/repository/suptools/nodeabc/summary/root/20221012121321/nodeabc
HTML REPORT : <REPOSITORY>/report/Consolidated_Summary_Report_20221012121321.html
--------------------------------------------------------------------

tfactl>
This is how the HTML report looks like, the summary TFA report.
Todays post is a quick one about the difference that I have noticed in one of the extended execution plan section ‘Query block registry‘ between Oracle 19c (19.8) and Oracle 21c (21.3). I am not going to explain about query blocks etc. here as I’ve already made few blog posts on those topics in the past, this one is about the difference that you will observe between two said database versions for QBR section in execution plans.
First I am going to use the option/flag ‘qbregistry‘ (for Query block registry info) in Oracle database version 19.16, and next will repeat same steps in Oracle 21.3. Query block registy information can also be collect from the 10053 optimizer traces, but I always notice that one’s there in CBO traces are more repetitive that what you see as a concise version through execution plans with ‘qbregistry‘ option.
So, I have already set the playground, for testing purpose, created two sample tables and have written two outer join queries. One for each table. Then combining the results of these using union all.
Above ‘Query Block Registry’ XML translates to something like this SET$1 NULL_HALIAS|SET$1 SEL$1 BRICKS|SEL$1|TOYS|SEL$1 SEL$2 BRICKS|SEL$2|TOYS|SEL$2
Considering we have a two SELECT statements, one for each table, internally optimizer has created two query blocks SEL$1 and SEL$2, one for each of the select. Here its using a hint alias name ‘NULL_HALIAS‘, and points to both of the two SELECT statements used in the original query.
Next, lets execute the same statement in Oracle 21c (21.3.0) version and see the difference in QBR section.
--
-- In Oracle 21.3 Database
--
-- Skipping few sections to have more clarity about discussed topic
SQL*Plus: Release 21.0.0.0.0 - Production on Sat Oct 8 23:57:12 2022
Version 21.3.0.0.0

SQL>  select * from table(dbms_xplan.display('PLAN_TABLE',NULL,'+alias +outline +qbregistry'));

PLAN_TABLE_OUTPUT
----------------------------------------------------------------------------------------------------------------------------------------------------------------------------------------------------------------------------------------------------------------------------------------------------------------------------------------------------------------------------------------------------------------
Plan hash value: 731550672
...
.....
Query Block Name / Object Alias (identified by operation id):
-------------------------------------------------------------

   1 - SET$1
   2 - SEL$1
   3 - SEL$1 / "TOYS"@"SEL$1"
   4 - SEL$1 / "BRICKS"@"SEL$1"
   5 - SEL$2
   7 - SEL$2 / "BRICKS"@"SEL$2"
   8 - SEL$2 / "TOYS"@"SEL$2"

Outline Data
-------------
......
Predicate Information (identified by operation id):
---------------------------------------------------
.....

Query Block Registry:
---------------------

  SEL$1 (PARSER) [FINAL]
  SEL$2 (PARSER) [FINAL]
  SET$1 (PARSER) [FINAL]

SQL>
Here with 21c (21.3), first thing is its no more coming in the form of an XML, The curious part out of the entire output is the ‘Query Block Registry‘ where the [FINAL] is the transformation that is chosen by the CBO. This assures that time was used on a query block which has been selected for an optimal plan.
Recently I was doing an analysis on a slothful database where I had to generate multiple AWR reports to cover almost 12 hours of the problem period. I usually go with few of the SQL scripts or AWR generator tools for my trend analysis, but I was little lucky in making unexpected and fortunate discovery on Metalink, found a cool Doc ID 2857522.1 which explains about an Oracle provided perl script to generate AWR report time series in any given timeframe. The script works with RDBMS 12.1 and later.
The script generates all the AWR reports with [begin snapid:end snapid] equal to [n,n+1] with n falling into a given time interval. The script is very handy and interactive, gives you option to choose between standard Text or HTML format, report type (RAC or Non-RAC type reports). You can call it in both command line or interactive mode.
This script generates a timeseries of awr report for a given database in a awr repository. It connects to database via oracle sid on the db server or via tnsalias. To run the script just execute B . To connect via oracle sid do not specify username password and tnsalias. In order to have sixty minutes time-series reports do not specify frequency if awr snapshot is executed every 60 minutes (default awr setting), set frequency 2 if awr snapshot is executed every 30 mins , 4 if awr snapshot is executed every 15 mins and so on. Leaving frequency blank will generate a series based on the awr snapshot frequency. All reports generated during execution will be saved in dumpdir, if the directory does not exist it will be automatically created.
By default awr reports will be generated in text format. To generate pluggable database awr reports connect to database by specifying username , password and tns alias of the pluggable db.
-- Call perl script awrdmp.pl to run the AWR extraction.
[oracle@fatdba ~]$ perl ./awrdmp.pl
Enter usrname: -
Enter password: -
Enter tnsalias: -
Enter frequency -
Enter mode
(text/html) - text
CONNECTED AS SYSDBA
RDBMS VERSION: 19.0.0.0.0

---- ---------- ------- ---------- ---------- -------------------- ------
NUM       DBID  INSTID     DBNAME     INSTID              MACHINE CONTID
---- ---------- ------- ---------- ---------- -------------------- ------
0 2511273110       2      DIXITD       fat2             racnode2      0
1 2511273110       1      DIXITD       fat1             racnode1      0

Enter database num: [0,1] -: 0
 0 2511273110       2      DIXITD       fat2             racnode2
RANGE AVAILABLE IN REPOSITORY FOR DBID 2511273110 INST 2:
------------------------------------------------------
[191 04-SEP-22 07.58.34.180 AM : 420 05-SEP-22 06.28.18.307 AM]
Enter the minimum date interval (DD/MM/YYYY) -: 04/09/2022
Enter the maximum date interval (DD/MM/YYYY) -: 05/09/2022
GENERATING FILES
[  12 %] writing file : report_2_DIXITD_191_192.text


--
--
--
-- In case if want to execute it in command line format.
perl awrdmp.pl --batch --freq 1 --instid 1 --dbid 2511273110  --dbn DIXITD --begin 04/09/2022 --end 05/09/2022 --rac --mode html


--
--
--
-- Output under dumpdir directory.
ls -ltr ./dumpdir
[...]
-rw-r--r-- 1 oracle oinstall 145147 Sep 05 14:16 report_1_DIXITD_196_197.text
-rw-r--r-- 1 oracle oinstall 159775 Sep 05 14:16 report_1_DIXITD_197_198.text
-rw-r--r-- 1 oracle oinstall 157100 Sep 05 14:16 report_1_DIXITD_198_199.text
-rw-r--r-- 1 oracle oinstall 148216 Sep 05 14:16 report_1_DIXITD_199_200.text
-rw-r--r-- 1 oracle oinstall 144003 Sep 05 14:16 report_1_DIXITD_200_201.text
-rw-r--r-- 1 oracle oinstall 146216 Sep 05 14:16 report_1_DIXITD_201_202.text
Recently I was doing a POC on Oracle 21c, and I had to shrink an LOB secure file column, and I was aware about a new dynamic view added to Oracle 21c called V$SECUREFILE_SHRINK, which is very useful to monitor securefiles shrink operations. This gives you some great details like start time, end time, status of the operation etc. I shrank one of the required securefile LOB column of a table and I was interested to see what all was captured by V$SECUREFILE_SHRINK … But It was empty!! got ‘no rows selected’, Why is that ??
Let me try to replicate the scenario and explain what I was doing that day.
-- Let me create a test scenario
-- Will create a brand new playground to test all things
[oracle@witnessalberta ~]$ !sq
sqlplus / as sysdba

SQL*Plus: Release 21.0.0.0.0 - Production on Sun Aug 28 10:50:26 2022
Version 21.3.0.0.0

Copyright (c) 1982, 2021, Oracle.  All rights reserved.


Connected to:
Oracle Database 21c Enterprise Edition Release 21.0.0.0.0 - Production
Version 21.3.0.0.0

SQL>
SQL>
SQL>
SQL> CREATE PLUGGABLE DATABASE pdb2 ADMIN USER pdb_adm IDENTIFIED BY oracle90 CREATE_FILE_DEST='/opt/oracle/oradata';

Pluggable database created.

SQL> show pdbs;

    CON_ID CON_NAME                       OPEN MODE  RESTRICTED
---------- ------------------------------ ---------- ----------
         2 PDB$SEED                       READ ONLY  NO
         3 ORCLPDB1                       MOUNTED
         4 PDB2                           MOUNTED
SQL> ALTER PLUGGABLE DATABASE pdb2 OPEN READ WRITE;

Pluggable database altered.

SQL>  ALTER SESSION SET CONTAINER = PDB2;

Session altered.

SQL> SHOW CON_NAME;

CON_NAME
------------------------------
PDB2

SQL>
SQL> conn fatdba/oracle90@PDB2
Connected.
SQL>
SQL>
SQL>
SQL> show user
USER is "FATDBA"
SQL>
SQL>
SQL>
SQL>

-- Created a Table with a SECUREFILE LOB
SQL> CREATE TABLE secure_file_tab (rid  NUMBER(5), bcol BLOB) LOB (bcol) STORE AS SECUREFILE bcol_lob
(TABLESPACE users DISABLE  STORAGE IN ROW CHUNK 8192 RETENTION MIN 3600 KEEP_DUPLICATES NOCOMPRESS DECRYPT CACHE READS);

Table created.

SQL>

SQL>
-- Inserted some 100000 random rows into the table
insert into secure_file_tab VALUES(101, utl_raw.cast_to_raw('hello, this is the first review'));
insert into secure_file_tab VALUES(101, utl_raw.cast_to_raw('hello, this is the first review'));
insert into secure_file_tab VALUES(101, utl_raw.cast_to_raw('hello, this is the first review'));
insert into secure_file_tab VALUES(101, utl_raw.cast_to_raw('hello, this is the first review'));
insert into secure_file_tab VALUES(101, utl_raw.cast_to_raw('hello, this is the first review'));
insert into secure_file_tab VALUES(101, utl_raw.cast_to_raw('hello, this is the first review'));
...
......
........

SQL> select count(*) from secure_file_tab;

  COUNT(*)
----------
    100001

SQL>
SQL>
-- Lets check the size of the table.
SQL> select segment_name, bytes/1024 from dba_segments where segment_name='SECURE_FILE_TAB';

SEGMENT_NAME         BYTES/1024
-------------------- ----------
SECURE_FILE_TAB      4096

-- Have deleted all rows from the table
SQL> delete from secure_file_tab where RID=101;

100000 rows deleted.

SQL> COMMIT;

SQL> select count(*) from secure_file_tab;

COUNT(*)
----------
1

-- Gathered table stats
SQL> exec dbms_stats.gather_table_stats(null, 'secure_file_tab');

PL/SQL procedure successfully completed.


SQL> select segment_name, bytes/1024 from dba_segments where segment_name='SECURE_FILE_TAB';

SEGMENT_NAME         BYTES/1024
-------------------- ----------
SECURE_FILE_TAB      113


SQL> alter table secure_file_tab modify lob(bcol) (shrink space);

Table altered.
Now time to check if anything captured in the v$securefile_shrink or gv$securefile_shrink dynamic view about the securefile shrink operation.
-- Lets check if anything captured by the view
SQL> desc v$securefile_shrink
 Name                                      Null?    Type
 ----------------------------------------- -------- ----------------------------
 LOB_OBJD                                           NUMBER
 SHRINK_STATUS                                      VARCHAR2(40)
 START_TIME                                         TIMESTAMP(3) WITH TIME ZONE
 END_TIME                                           TIMESTAMP(3) WITH TIME ZONE
 BLOCKS_MOVED                                       NUMBER
 BLOCKS_FREED                                       NUMBER
 BLOCKS_ALLOCATED                                   NUMBER
 EXTENTS_ALLOCATED                                  NUMBER
 EXTENTS_FREED                                      NUMBER
 EXTENTS_SEALED                                     NUMBER
 CON_ID                                             NUMBER


SQL> select * from v$securefile_shrink;

no rows selected

SQL> select * from gv$securefile_shrink;

no rows selected

SQL>
Nothing!!! Why ? Why ? Let me try the other way (MOVE LOB) and see if that populates anything in v$securefile_shrink or gv$securefile_shrink. Repopulated the same table again with 100000 rows, deleted all rows from the table, committed changes, regathered stats and verified table size, same what we did in Test 1.
-- Changed the LOB SHRINK technique this time.
SQL> ALTER TABLE secure_file_tab MOVE LOB(BCOL) STORE AS (TABLESPACE test);

Table altered.


-- Lets check if anything captured by the view
SQL> select * from v$securefile_shrink;

no rows selected

SQL> select * from gv$securefile_shrink;

no rows selected

SQL>
Nothing!!! Why ? Why ? Let me try the with one more way (SHRINK SPACE CASCADE) again and see if that populates anything in v$securefile_shrink or gv$securefile_shrink. Repopulated the same table again with 100000 rows, deleted all rows from the table, committed changes, regathered stats and verified table size, same what we did in Test 1.
--Let me try the other way
SQL> alter table secure_file_tab MODIFY LOB(BCOL) (SHRINK SPACE CASCADE);

Table altered.

-- Lets check if anything captured by the view
SQL> select * from v$securefile_shrink;

no rows selected

SQL> select * from gv$securefile_shrink;

no rows selected

SQL>
Nothing!!! Why ? Why ? This is super strange now. Then finally, I decided to check with Oracle support and asked them to try at their end in 21c and from their end also it was getting populated. I guess I have identified a BUG in 21.3.0.0.0!! 🙂 🙂 Currently the case is with development team and they are taking a look on this buggy behavior on Oracle 21.5 on Red Hat Linux 7 x86_64 … Let’s see how it goes from here, will post the solution or the cause behind this ill behavior soon.
Lately I was in discussion with one of my friend who was facing an issue with Oracle 19c database where the vendor asked him to apply a patch to fix the problem, but he did not want to apply that single patch because their Oracle homes were shared and he didn’t want to increase the complexity of their patching cycles. Then later on Oracle suggested them to try a workaround which requires a setting using fix controls.
So many times Oracle recommends to set a fix control in case of a bug fix, but what exactly are they ? Their purpose ? & tools and methods to control these bug fixes ? This post is all about explaining all of them in detail.
So, What are they ? – Fix controls are bug fix control parameters introduced in 10.2 and they are typically used to enable/disable certain bug fixes in Oracle database. You cannot pull-back any patch, the patch you trying must have the option to use _FIX_CONTROL, and must be visible under V$SYSTEM_FIX_CONTROL views.
Let’s understand this using one of the case where mview push predicate was not happening due to wrong cardinality estimate in one of the production system running on 12.1.0.2. It was rejecting join predicate pushdown (JPPD) transformations and this was avoiding view to be joined with index-based nested-loop join method and causing issues. This was happening all due to bug 21802552. Let’s check if the bug number is present in fix control views and what’s its status.
SQL> select bugno, value, description from v$system_fix_control where bugno=21802552;

     BUGNO      VALUE DESCRIPTION
---------- ---------- ----------------------------------------------------------------------
  21802552          1 correct cardinality adjusted by DS

-- You can get similar information using DBMS_SQLDIAG.GET_FIX_CONTROL(BUG NUMBER) proc as well.
So, its there in the view’s output and its enabled (value 1), and we can turn it off, lets do it. A proper syntax of using them is given below.
-- To enable:
"_fix_control"='Bugno:ON'    (OR)   "_fix_control"="Bugno:1"

-- To disable:
"_fix_control"='Bugno:OFF'  (OR)   "_fix_control"="Bugno:0"


SQL> ALTER SYSTEM SET "_fix_control" = '21802552:OFF';

System altered.

SQL>

SQL> select bugno, value, description from v$system_fix_control where bugno=21802552;

     BUGNO      VALUE DESCRIPTION
---------- ---------- ----------------------------------------------------------------------
  21802552          0 correct cardinality adjusted by DS


-- same was recorded in alert log file as well

2022-07-16T09:04:02.371313-04:00
ALTER SYSTEM SET _fix_control='21802552:OFF' SCOPE=BOTH;
You can do the same using the new dbms_optim_bundle.set_fix_controls package, it was introduced in 12.1.0.2 to implement Oracle’s approach of ‘Automatic Fix Control Persistence’ framework. Let’s try to the same using said package.
-- This will set given _fix_controls in scope=BOTH on all instances
-- Lets enable it again before we disable it back again
SQL> exec dbms_optim_bundle.set_fix_controls('21802552:1','*', 'BOTH', 'NO');

PL/SQL procedure successfully completed.

SQL> select bugno, value, description from v$system_fix_control where bugno=21802552;

     BUGNO      VALUE DESCRIPTION
---------- ---------- ----------------------------------------------------------------------
  21802552          1 correct cardinality adjusted by DS


-- Lets roll it back
SQL> exec dbms_optim_bundle.set_fix_controls('21802552:0','*', 'BOTH', 'NO');

PL/SQL procedure successfully completed.

SQL> select bugno, value, description from v$system_fix_control where bugno=21802552;

     BUGNO      VALUE DESCRIPTION
---------- ---------- ----------------------------------------------------------------------
  21802552          0 correct cardinality adjusted by DS

--
-- Entry in parameter file made by the dbms_optim_bundle package for fix control
*._fix_control='21802552:0'#added through dbms_optim_bundle package
Recently, while working on a database upgrade from 12c to 19c (19.15) one of my friend encountered a strange issue on the newly upgraded 19c database where the stats gathering on the full database started taking huge time. It used to take ~ 3 hours to complete the full database statistics, but the same stats collection job after the upgrade to 19c started taking close to 10 hours. The stats collection script they were using was quite simple and with minimal parameters used.
During the analysis he observed that the top 3-4 in-flight transactions during stats collection were related to the Index Statistics and were found doing ‘Index Fast Full Scan’, and all of them are on few of the large partitioned tables in the database. He discussed the case with me and together tried few thing i.e. recollected dictionary and fixed object statistics, did some comparative study of parameters between 12c and 19c but none of them worked. At last we tried to set debugging levels on DBMS_STATS to see what’s happening under the hood, and that gave us some hint when set it with level/flag 8 (trace index stats) and with level 32768 to trace approximate NDV (number distinct values) gatherings. Traces gave us some idea that its surely with the index stats and NDV or number of distinct keys and is taking time.
But even after that we both were totally clueless as these Tables and its dependent objects are there in the system for a very long time. So. the big question was – What’s new in 19c that has slowed down stats collection ?
Finally we decided to contact OCS! And they quickly responded to the problem as its a known problem with the 19c. As per them, there was an enhancement in 19c that is related to Index stats gathering, and that had lead to the longer stats times. It was all due to an unpublished Bug 33427856 which is an enhancement to improve the calculation of index NDK (Number of Distinct Keys). This new feature with the approx_count_distinct function and fully scans indexes to calculate NDK. This has a significant benefit because NDK is now accurate. It also means that gathering statistics can take longer (for example, updating global index statistics if incremental stats is used). So, In general, this is expected behavior, since DBMS_STATS is doing more work in 19c than it did in previously unenhanced versions.
And the solution to this new 19c index-stats feature (a problem) off by setting fix control to disable ‘Enhance Index NDK Statistics’ – 27268249
alter system set "_fix_control"='27268249:0';
And as soon as we deleted existing statistics and regather them, the time dropped drastically and got completed under 3 hours.