


Script to display latency wait times using DBA_HIST_EVENT_HISTOGRAM using Heat Maps
Posted by FatDBA on March 2, 2022
Today’s post if about a brilliant tool/script that I frequently use to get the outputs/graphs for customer meetings, presentations and for quick analysis of any performance problem …
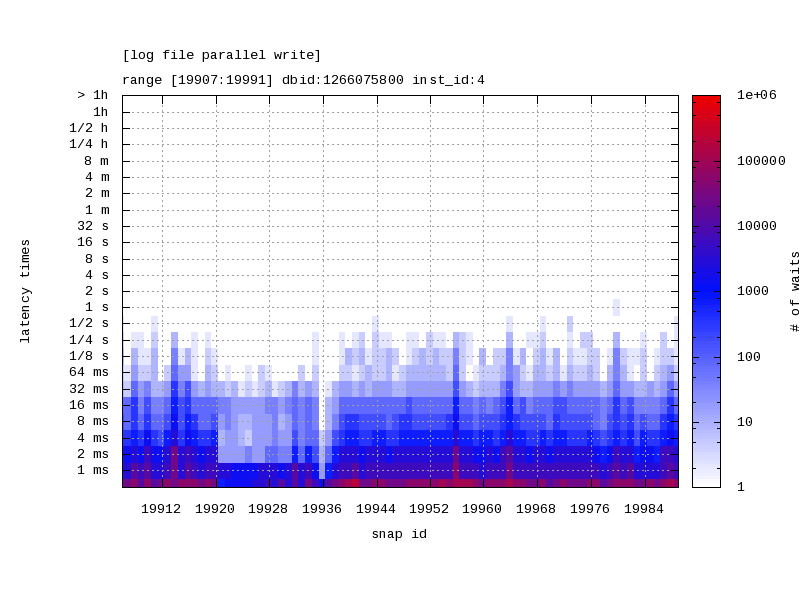
This is one of the awesome Oracle provided tool/script that generates a heat map of latency times for a given wait event. The script takes the output from DBA_HIST_EVENT_HISTOGRAM and produces a heat map and a JPG version of the heat map is also produced representing the wait time latency for the given wait event over a specific time frame identified by range of snapshots.
Source : Script to Display Latency Wait Time From DBA_HIST_EVENT_HISTOGRAM Using Heat Map (Doc ID 1931492.1)
Note: This script queries ASH views, specially DBA_HIST_EVENT_HISTOGRAM which requires license as its part of the Diagnostics Pack on Oracle EE
The scripts takes the following input parameters:
- Snapshot id range (first snapshot id and last snapshot id)
- Database id
- Instance number
- Exact name of wait event
perl ./lhm.pl --begin [first snapid] --end [last snapid] --dbid [database id] --instance [instance num] --wait_event "wait event"

perl ./lhm.pl  --dbid 1266075800 --begin 19907 --end 19991 --event "log file parallel write" --instance 4


-- Example Output
database id:     1266075800
wait event:      log file parallel write
Matrix:          [26x85]
snap range:      [19907:19991]
instance id:     4
jpg file   :     latency_log_file_parallel_write.jpg
Hope It Helped!
Prashant Dixit

oraora said
Wheter the perl script will run on AIX?