


How to monitor your PostgreSQL database using Grafana, Prometheus & postgres_exporter.
Posted by FatDBA on March 24, 2021
Hi Everyone,
I am back with the another post, this time it’s for monitoring PostgreSQL database using one of the popular interactive visualization platform Grafana. I have recently implemented Grafana + Prometheus and created few really cool performance charts and database metric dashboards using one of the popular PostgreSQL metric exporter ‘postgres_exporter‘ to monitor a EDB 12 PostgreSQL database cluster.
I have divided everything in to three parts – Grafana Installation & configuration, Prometheus Installation and Configuration and final postgres_exporter installation and configuration.
let’s first start with Grafana installation and configuration on Linux server (this is EL 7).
Grafana Installation:
1. Disable SELinux
Change SELINUX=enforcing to SELINUX=disabled and Reboot.
vi /etc/sysconfig/selinux
2. Now we need to create Grafana YUM repository
vi /etc/yum.repos.d/grafana.repo
and add following lines to it
[grafana]
name=grafana
baseurl=https://packages.grafana.com/oss/rpm
repo_gpgcheck=1
enabled=1
gpgcheck=1
gpgkey=https://packages.grafana.com/gpg.key
sslverify=1
sslcacert=/etc/pki/tls/certs/ca-bundle.crt
3. Install Grafana now using YUM
yum install grafana
This will install all binaries to location /usr/sbin/grafana-server, copies init.d file to /etc/init.d/grafana-server and default log location would be /var/log/grafana/grafana.log.
4. Install additional font packages
yum install fontconfig
yum install freetype*
yum install urw-fonts
5. Now, enable grafana service
Enable Grafana service on system bootsystemctl enable grafana-server.service
Start it using the following command:systemctl start grafana-server
6. Check Grafana web interface
http://IPADDRESSorHOSTNAME:3000/
Note: Default username and password is ‘admin‘, and once you login, it will prompt you to set a new password.

Add PostgreSQL as Data Source:
Next we now going to add PostgreSQL as a data source in Grafana.
1. Login to Grafana and go to ‘configuration‘ tab on the left of the console.

2. Add PostgreSQL as a data source, populate all details like hostname, port number, database name, DB user and password, PostgreSQL version and some optional entries like connection limits, SSL details etc. Once done, click on button with name save and test to see if all details are fine.

3. Now you will start seeing PostgreSQL as a data source under data source tab.

Prometheus Installation & Config
All good, now next is to install and configure ‘Prometheus’, this is a time-series database that is optimized for storing and serving time series through associated pairs of time(s) and value(s). You can also use InfluxDB or Graphite as a time series database for Grafana.
1. Download and untar the Prometheus file for your respective OS.
Example:curl -LO url -LO https://github.com/prometheus/prometheus/releases/download/v2.22.0/prometheus-2.22.0.linux-amd64.tar.gz
tar -xvf prometheus-2.22.0.linux-amd64.tar.gz
mv prometheus-2.22.0.linux-amd64 prometheus-files
2. Create prometheus user, directories and make that account owner for all the files and folders.
sudo useradd --no-create-home --shell /bin/false prometheus
sudo mkdir /etc/prometheus
sudo mkdir /var/lib/prometheus
sudo chown prometheus:prometheus /etc/prometheus
sudo chown prometheus:prometheus /var/lib/prometheus
3. Copy prometheus and promtool binaries from prometheus-files to /usr/local/bin and change ownership
sudo cp prometheus-files/prometheus /usr/local/bin/
sudo cp prometheus-files/promtool /usr/local/bin/
sudo chown prometheus:prometheus /usr/local/bin/prometheus
sudo chown prometheus:prometheus /usr/local/bin/promtool
4. Move consoles and console_libraries directories from prometheus-files to /etc/prometheus folder and change ownership
sudo cp -r prometheus-files/consoles /etc/prometheus
sudo cp -r prometheus-files/console_libraries /etc/prometheus
sudo chown -R prometheus:prometheus /etc/prometheus/consoles
sudo chown -R prometheus:prometheus /etc/prometheus/console_libraries
5. Now time to configure. Create prometheus.yml file
vi /etc/prometheus/prometheus.yml
copy below entries to the YAML file
global:
  scrape_interval: 10s

scrape_configs:
  - job_name: 'prometheus'
    scrape_interval: 5s
    static_configs:
      - targets: ['10.0.0.153:9090']
6. Change ownership of this file
sudo chown prometheus:prometheus /etc/prometheus/prometheus.yml
7. Create prometheus service file
vi /etc/systemd/system/prometheus.service
copy below entries to the file.
[Unit]
Description=Prometheus
Wants=network-online.target
After=network-online.target

[Service]
User=prometheus
Group=prometheus
Type=simple
ExecStart=/usr/local/bin/prometheus \
    --config.file /etc/prometheus/prometheus.yml \
    --storage.tsdb.path /var/lib/prometheus/ \
    --web.console.templates=/etc/prometheus/consoles \
    --web.console.libraries=/etc/prometheus/console_libraries

[Install]
WantedBy=multi-user.target
8. Register systemd service to register prometheus service and start it.
sudo systemctl daemon-reload
sudo systemctl enable prometheus
sudo systemctl start prometheus
and check the status of the service
sudo systemctl status prometheus
[root@canttowin edb]# systemctl status prometheus
● prometheus.service - Prometheus
   Loaded: loaded (/etc/systemd/system/prometheus.service; enabled; vendor preset: disabled)
   Active: active (running) since Wed 2021-03-24 05:55:53 EDT; 4s ago
 Main PID: 17641 (prometheus)
    Tasks: 7
   CGroup: /system.slice/prometheus.service
           └─17641 /usr/local/bin/prometheus --config.file /etc/prometheus/prometheus.yml --storage.tsdb.path /var/lib/prometheus/ --web.console.templates...

Mar 24 05:55:54 canttowin.ontadomain prometheus[17641]: level=info ts=2021-03-24T09:55:54.172Z caller=head.go:714 component=tsdb msg="WAL segment ...gment=10
Mar 24 05:55:54 canttowin.ontadomain prometheus[17641]: level=info ts=2021-03-24T09:55:54.358Z caller=head.go:714 component=tsdb msg="WAL segment ...gment=10
Mar 24 05:55:54 canttowin.ontadomain prometheus[17641]: level=info ts=2021-03-24T09:55:54.455Z caller=head.go:714 component=tsdb msg="WAL segment ...gment=10
Mar 24 05:55:54 canttowin.ontadomain prometheus[17641]: level=info ts=2021-03-24T09:55:54.456Z caller=head.go:714 component=tsdb msg="WAL segment ...gment=10
Mar 24 05:55:54 canttowin.ontadomain prometheus[17641]: level=info ts=2021-03-24T09:55:54.456Z caller=head.go:719 component=tsdb msg="WAL replay c...173255ms
Mar 24 05:55:54 canttowin.ontadomain prometheus[17641]: level=info ts=2021-03-24T09:55:54.478Z caller=main.go:732 fs_type=XFS_SUPER_MAGIC
Mar 24 05:55:54 canttowin.ontadomain prometheus[17641]: level=info ts=2021-03-24T09:55:54.478Z caller=main.go:735 msg="TSDB started"
Mar 24 05:55:54 canttowin.ontadomain prometheus[17641]: level=info ts=2021-03-24T09:55:54.478Z caller=main.go:861 msg="Loading configuration file"...heus.yml
Mar 24 05:55:54 canttowin.ontadomain prometheus[17641]: level=info ts=2021-03-24T09:55:54.481Z caller=main.go:892 msg="Completed loading of configuration …µs
Mar 24 05:55:54 canttowin.ontadomain prometheus[17641]: level=info ts=2021-03-24T09:55:54.481Z caller=main.go:684 msg="Server is ready to receive ...quests."
Hint: Some lines were ellipsized, use -l to show in full.
9. If no issues till here, you are all good, time to check Prometheus WEB GUI, you can access its using below URL.
http://10.0.0.153:9090/graph
10. You can check other stats and other available metrics via GUI console.
11. Now you will start seeing ‘Prometheus’ in the list of data sources along with PostgreSQL which we have added at the first step.

Postgres_Exporter Installation and configuration
Now, when Grafana and Prometheus is all set, time to install and configure postgres_exporter. Postgres_exporter is a popular PostgreSQL metric exporter for Prometheus.
1. Lets create few required directories first.
mkdir /opt/postgres_exporter
cd /opt/postgres_exporter
2. Download and untar the file.
wget https://github.com/wrouesnel/postgres_exporter/releases/download/v0.5.1/postgres_exporter_v0.5.1_linux-amd64.tar.gz
tar -xzvf postgres_exporter_v0.5.1_linux-amd64.tar.gz
cd postgres_exporter_v0.5.1_linux-amd64
3. Copy core file ‘postgres_exporter’ file to /usr/local/bin directory
cp postgres_exporter /usr/local/bin
4. Next, lets create the configuration file for postres_exporter
cd /opt/postgres_exporter
sudo vi postgres_exporter.env
I want to visualize my EDB 12 PostgreSQL stats, so will use below data source details. This is for all database, you can also monitor any specific database.
[root@canttowin edb]# more /opt/postgres_exporter/postgres_exporter.env
DATA_SOURCE_NAME="postgresql://enterprisedb:oracle@10.0.0.153:5444/?sslmode=disable"
5. Next, create the service for postgres_exporter
vi /etc/systemd/system/postgres_exporter.service
put below lines to the service file
[Unit]
Description=Prometheus exporter for Postgresql
Wants=network-online.target
After=network-online.target
[Service]
User=postgres
Group=postgres
WorkingDirectory=/opt/postgres_exporter
EnvironmentFile=/opt/postgres_exporter/postgres_exporter.env
ExecStart=/usr/local/bin/postgres_exporter
Restart=always
[Install]
WantedBy=multi-user.target
6. Next enable service and check status
sudo systemctl daemon-reload
sudo systemctl start postgres_exporter
sudo systemctl enable postgres_exporter
[root@canttowin edb]# systemctl status postgres_exporter
● postgres_exporter.service - Prometheus exporter for Postgresql
   Loaded: loaded (/etc/systemd/system/postgres_exporter.service; enabled; vendor preset: disabled)
   Active: active (running) since Wed 2021-03-24 05:52:17 EDT; 2s ago
 Main PID: 16984 (postgres_export)
    Tasks: 3
   CGroup: /system.slice/postgres_exporter.service
           └─16984 /usr/local/bin/postgres_exporter --web.listen-address=:9187 --web.telemetry-path=/metrics

Mar 24 05:52:17 canttowin.ontadomain systemd[1]: Started Prometheus exporter for Postgresql.
Mar 24 05:52:17 canttowin.ontadomain postgres_exporter[16984]: time="2021-03-24T05:52:17-04:00" level=info msg="Established new database connection...go:777"
Mar 24 05:52:17 canttowin.ontadomain postgres_exporter[16984]: time="2021-03-24T05:52:17-04:00" level=info msg="Semantic Version Changed on \"10.0....o:1229"
Mar 24 05:52:18 canttowin.ontadomain postgres_exporter[16984]: time="2021-03-24T05:52:18-04:00" level=info msg="Starting Server: :9187" source="pos...o:1437"
Hint: Some lines were ellipsized, use -l to show in full.
7. Now we can check status if postgres_exporter (as a target) state information and other details. This we can check it through Prometheus web GUI.

As we have configured postgres_exporter and mapped it with Prometheus, we can also look for many of the expressions that it has created. This you can access on ‘graph’ page under Prometheus GUI console.

You can check it’s immediate results in both graphical or in console itself.

Alright, we have installed and configured Grafana and have added PostgreSQL and Prometheus as a data source and have configured postgres_exporter metric collector too. Time to generate some graphs. Well, you can do it by creating manual queries under new dashboards or else you can use any of prebuild Grafana dashboard templates for PostgreSQL i.e. 6742 or even 9628 (there are many more on Grafana labs repo).
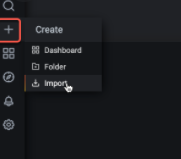
1. Lets Import dashboard with ID 6742. Go to option with + sign on the left panel and choose last option ‘import’.
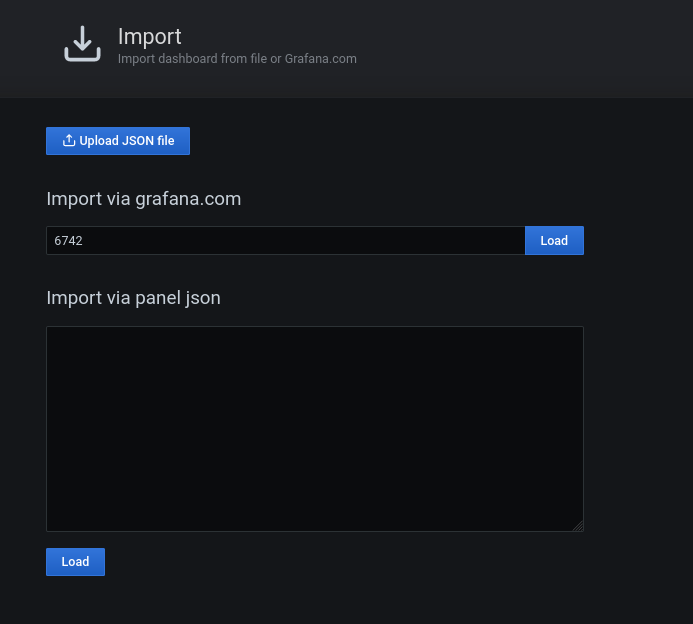
2. In next screen, pass dashboard ID 6742 and press button Load. You can also use JSON file entries instead of ID, I will use ID here in this sample configuration. Here select ‘Prometheus’ from the drop down list and click ‘Import’ and it’s all set!

3. Now this will bring the final dashboard showing lot’s of PostgreSQL metrics and their current values.


Hope It Helped!
Prashant Dixit

Mehman Jafarov said
Thanks for this helpful topic.
FatDBA said
Thanks!
sekhar said
where do we install postgres exporter either in postgres db or prometheus
FatDBA said
Integrate it into prometheus which is a time series database
tanay sethi said
I am not getting , postgres_exporter under targets of prometheus
Any help on this
tanay said
“Error opening connection to database (postgresql://bxxxx:PASSWORD_REMOVED@xxxx.database.azure.com:5432/?sslmode=require)
FatDBA said
this needs to be checked
FatDBA said
Can you please check if all the steps you’ve performed in the same order.
tanay said
yes, all the steps performed in the same order , I am using Azure Postgresql which is on different machine and Prometheus / Grafana / postgres_exporter are on 1 linux VM
Amish modi said
Will you please explain : “DATA_SOURCE_NAME=”postgresql://enterprisedb:oracle@10.0.0.153:5444/?sslmode=disable”” in postgres_explorer.env file ?
What is entrprisedb : user or database
oracle : is it password ?
and postgresql : Type of database e.g. postgresql, oracle, mySQL etc?
I tried DATA_SOURCE_NAME=”postgresql://monitor:monitor@192.168.1.16:5432/?sslmode=disable” for monitor database , user name and password but PROMETHEUS is not showing anything under pg_sta.
Thanks in advance…
FatDBA said
‘enterprisedb’ is the default OS user that gets created when you install EDB PostgreSQL
Amish modi said
Update :
After changing the port # from 9090 to 9187 in prometheus.yml file now it works as shown.
[root@postgres prometheus]# cat prometheus.yml
global:
scrape_interval: 10s
scrape_configs:
– job_name: ‘prometheus’
scrape_interval: 5s
static_configs:
– targets: [‘192.168.1.16:9187’]
Thanks,
Amish Modi
Wayne said
This is a great guide for setting up Grafana with PostgreSQL.