Recently someone asked me, How to run oratop utility on Oracle database version that is above 12.1 ? He was using Oracle version 19.3.0.0.0 and was getting error ‘error while loading shared libraries’ when tried to call the oratop, and it was quite an obvious error as the script trying to locate a shared object file called libclntshcore.so under $ORACLE_HOME/lib directory for version 12.1, whereas it was version 19.1 and hence the shared object version was libclntshcore.so.19.1
[oracle@oracleontario ~]$ ./oratop.RDBMS_12.1_LINUX_X64 -d -f -i 3 / as sysdba
./oratop.RDBMS_12.1_LINUX_X64: error while loading shared libraries: libclntshcore.so.12.1: cannot open shared object file: No such file or directory
[oracle@oracleontario ~]$
Solution to the problem is, starting from Oracle 19c, oratop is part of Oracle supplied tool and is present under ORACLE_HOME/suptools directory, and is not version specific. Other tools that you will see along with oratop in suptools directory are orachk and tfa. Let’s call it and see if it runs!
[oracle@oracleontario ~]$ cd $ORACLE_HOME/suptools/
[oracle@oracleontario suptools]$ ls
orachk  oratop  tfa
[oracle@oracleontario suptools]$ cd oratop/
[oracle@oracleontario oratop]$ ls
oratop
[oracle@oracleontario oratop]$
[oracle@oracleontario oratop]$

[oracle@oracleontario oratop]$ ./oratop  -f -i 3 / as sysdba

oratop: Release 15.0.0 Production on Thu Mar 10 07:33:49 2022
Copyright (c) 2011, Oracle.  All rights reserved.

Connecting ..
Processing ...

Oracle 19c - Primary dixitd 07:33:45 up: 5.2h,  1 ins,    0 sn,   0 us, 1.5G sga,    0% fra,   1 er,                        0.5%db
ID CPU  %CPU %DCP LOAD  AAS  ASC  ASI  ASW  IDL  ASP  LAT  MBPS IOPS  R/S  W/S  LIO  GCPS %FR  PGA TEMP UTPS  UCPS  RT/X DCTR DWTR
 1   1   9.1  0.2  0.2  0.0    0    0    0    0    0    0   0.1    3    3    0    3     0  45 153M    0    0     0  110m  118    8

EVENT (C)                                                         TOTAL WAITS   TIME(s)  AVG_MS  PCT                    WAIT_CLASS
db file sequential read                                                  5175        65    12.6   32                      User I/O
DB CPU                                                                               42           21
oracle thread bootstrap                                                    81        40   503.8   20                         Other
db file scattered read                                                    593        29    50.4   15                      User I/O
external table read                                                         1        23 23470.8   12                      User I/O

ID   SID     SPID USERNAME  PROGRAM    SRV  SERVICE  PGA  SQLID/BLOCKER OPN  E/T  STA  STE  WAIT_CLASS  EVENT/*LATCH           W/T
 1    58    14884 SYS       sqlplus@o  DED  SYS$USE 1.4M           1:77 UPD 8.0s  ACT  WAI  Applicatio  enq: TX - row lock co 7.8s


[oracle@oracleontario oratop]$
[oracle@oracleontario oratop]$
Recently one of the customer asked me about their critical SQL on a production system running on Oracle 12cR2, if there is a way to pin it in the AWR. I mean the query was already super fast, gets completed very fast and doesn’t consume any system resources, or isn’t a ‘Top SQL’. He still want to track this low resource SQL historically to check few stats, the guys was coming from an Oracle DBA background, and got the impression that the AWR only captures statements considered to be Top N (DBA_HIST_WR_CONTROL.TOPNSQL) which is by default 30. So, If you require any SQL to be always available in the top SQL, then you need to modify the default value to store those many SQLs. But this will create a AWR snapshot stress and that he don’t want.
The answer was ‘Yes’, there is a way how this can be achieved, and that’s too quite easily, and is even present since 11gR1 without making any modifications to your snapshot settings of topnsql. This is by using DBMS_WORKLOAD_REPOSITORY.ADD_COLORED_SQL API to pin any SQL into the AWR report as long as the SQL is in memory. So, if you mark your SQL or color it, it will be captured in every snapshot and it doesn’t have to be a TOP-N SQL to present in an AWR.
Let’s do a demo to understand how we can do that. I am going to run a test SQL to count number of rows into the table.
SQL> select count(*) from TABLE_GROWTH_MB;

  COUNT(*)
----------
      2868

SQL> select sql_id, plan_hash_value, sql_text from  v$sqlarea where sql_text like '%TABLE_GROWTH_MB%';

SQL_ID        PLAN_HASH_VALUE SQL_TEXT
------------- --------------- --------------------------------------------------
4n3x6w1vhn1k3      1134407048  select count(*) from TABLE_GROWTH_MB
Okay, so we have executed the SQL and we have its SQL_ID with us now. Lets try to use awr_sql_report_text function that displays an Automatic Workload Repository (AWR) SQL report as plain text to see if the SQL is present under the latest snapshot range.
SQL>
SQL> select output from table (dbms_workload_repository.awr_sql_report_text(l_dbid => 2592296819 , l_inst_num => 2,
l_bid => 36708, l_eid => 36718, l_sqlid => '4n3x6w1vhn1k3'));

OUTPUT
--------------------------------------------------------------------------------
WORKLOAD REPOSITORY SQL Report

Snapshot Period Summary

DB Name         DB Id    Unique Name DB Role          Edition Release    RAC CDB
------------ ----------- ----------- ---------------- ------- ---------- --- ---
FATDBACA      2592296819 FATDBACA    PRIMARY          EE      12.2.0.1.0 YES NO

Instance     Inst Num Startup Time
------------ -------- ---------------
FATDBACA2           2 26-Oct-21 23:10

              Snap Id      Snap Time      Sessions Curs/Sess
            --------- ------------------- -------- ---------
Begin Snap:     36708 10-Mar-22 16:00:37       190       2.5
  End Snap:     36718 10-Mar-22 18:30:06       181       2.6
   Elapsed:              149.48 (mins)
   DB Time:               91.13 (mins)

SQL Summary                    DB/Inst: FATDBACA/FATDBACA2  Snaps: 36708-36718

                  No data exists for this section of the report.
          -------------------------------------------------------------

SQL ID: 4n3x6w1vhn1k3          DB/Inst: FATDBACA/FATDBACA2  Snaps: 36708-36718

                  No data exists for this section of the report.
          -------------------------------------------------------------

Full SQL Text

                  No data exists for this section of the report.
SQL>
SQL>
SQL>
SQL>
And the report has no data about the SQL as the SQL was pretty fast, and hardly took few milliseconds to finish and is expected as it didn’t qualified as a TOP-SQL hence found no place in the AWR report. I am now going to color the SQLID and will re-run the SQL and check if its there in AWR now or not …
-- to PIN the SQLID in question
SQL> exec dbms_workload_repository.add_colored_sql('4n3x6w1vhn1k3');

PL/SQL procedure successfully completed.

SQL>

-- To UNPIN or remove the COLOR SQLID from repo
SQL> exec dbms_workload_repository.remove_colored_sql('<SQL_ID>');

-- Query below view to see list of all colored SQLs
SQL>  select * from DBA_HIST_COLORED_SQL;

   DB Id    SQL_ID        CREATE_TI     CON_ID
----------- ------------- --------- ----------
 2592296819 4n3x6w1vhn1k3 10-MAR-22          0


-- Re ran the SQL
SQL> select count(*) from TABLE_GROWTH_MB;

  COUNT(*)
----------
      2868


-- Let me generate a manual snap to capture fresh data
SQL>
SQL>
SQL> var n_snapid number
set feed off term on head off
set serveroutput on size unlimited
begin
        :n_snapid := dbms_workload_repository.create_snapshot();
        dbms_output.put_line('snap_id: ' || to_char(:n_snapid));
end;
/
snap_id: 36719
SQL>


-- Let me retry again to see if the SQLID details are there in the AWR after I have colored it
SQL> SQL> select output from table (dbms_workload_repository.awr_sql_report_text(l_dbid => 2592296819 , l_inst_num => 2,
l_bid => 36718, l_eid => 36719, l_sqlid => '4n3x6w1vhn1k3'));

OUTPUT
---------------------------------------------------------------------------------------------------------------------------------
WORKLOAD REPOSITORY SQL Report

Snapshot Period Summary

DB Name         DB Id    Unique Name DB Role          Edition Release    RAC CDB
------------ ----------- ----------- ---------------- ------- ---------- --- ---
FATDBACA      2592296819 FATDBACA    PRIMARY          EE      12.2.0.1.0 YES NO

Instance     Inst Num Startup Time
------------ -------- ---------------
FATDBACA2           2 26-Oct-21 23:10

              Snap Id      Snap Time      Sessions Curs/Sess
            --------- ------------------- -------- ---------
Begin Snap:     36708 10-Mar-22 16:00:37       190       2.5
  End Snap:     36719 10-Mar-22 18:39:40       177       2.6
   Elapsed:              159.06 (mins)
   DB Time:               93.43 (mins)

SQL Summary                    DB/Inst: FATDBACA/FATDBACA2  Snaps: 36708-36719

                Elapsed
   SQL Id      Time (ms)
------------- ----------

 Container DB
 ------------
4n3x6w1vhn1k3          0
Module: SQL*Plus
select count(*) from TABLE_GROWTH_MB
   2592296819

          -------------------------------------------------------------

SQL ID: 4n3x6w1vhn1k3          DB/Inst: FATDBACA/FATDBACA2  Snaps: 36708-36719
-> 1st Capture and Last Capture Snap IDs
   refer to Snapshot IDs witin the snapshot range
-> select count(*) from TABLE_GROWTH_MB

    Plan Hash           Total Elapsed                 1st Capture   Last Capture
#   Value                    Time(ms)    Executions       Snap ID        Snap ID
--- ---------------- ---------------- ------------- ------------- --------------
1   1134407048                      0             1         36719          36719
          -------------------------------------------------------------


Plan 1(PHV: 1134407048)
-----------------------

Plan Statistics                DB/Inst: FATDBACA/FATDBACA2  Snaps: 36708-36719
-> % Total DB Time is the Elapsed Time of the SQL statement divided
   into the Total Database Time multiplied by 100

Stat Name                                Statement   Per Execution % Snap
---------------------------------------- ---------- -------------- -------
Elapsed Time (ms)                                 0            0.2     0.0
CPU Time (ms)                                     0            0.2     0.0
Executions                                        1            N/A     N/A
Buffer Gets                                      22           22.0     0.0
Disk Reads                                        0            0.0     0.0
Parse Calls                                       1            1.0     0.0
Rows                                              1            1.0     N/A
User I/O Wait Time (ms)                           0            N/A     N/A
Cluster Wait Time (ms)                            0            N/A     N/A
Application Wait Time (ms)                        0            N/A     N/A
Concurrency Wait Time (ms)                        0            N/A     N/A
Invalidations                                     0            N/A     N/A
Version Count                                     1            N/A     N/A
Sharable Mem(KB)                                 19            N/A     N/A
          -------------------------------------------------------------

Execution Plan
------------------------------------------------------------------------------
| Id  | Operation          | Name            | Rows  | Cost (%CPU)| Time     |
------------------------------------------------------------------------------
|   0 | SELECT STATEMENT   |                 |       |    10 (100)|          |
|   1 |  SORT AGGREGATE    |                 |     1 |            |          |
|   2 |   TABLE ACCESS FULL| TABLE_GROWTH_MB |  2624 |    10   (0)| 00:00:01 |
------------------------------------------------------------------------------


Full SQL Text

SQL ID        SQL Text
------------- -----------------------------------------------------------------
4n3x6w1vhn1k3 select count(*) from TABLE_GROWTH_MB
Perfect, the SQLID is there in the AWR now, and we can see all runtime stats, execution plan, SQL Text etc.
Oracle 19c has a great enhancement added to the DBMS_XPLAN package called the ‘Hint Usage Report’, which is pretty helpful in reporting if an incorrect hint was used, or there was any syntax error with the hint or if there was an unresolved hint used in the SQL.
This you can use with the DBMS_XPLAN package and its functions like DISPLAY, DISPLAY_CURSOR, DISPLAY_WORKLOAD_REPOSITORY or DISPLAY_SQL_PLAN_BASELINE. By default, DBMS_XPLAN in the default TYPICAL format will report only invalid hints. The report shows the text of the hints. The hint may also have one of the following annotations:
E : indicates a syntax error. N : indicates an unresolved hint. U : indicates that the corresponding hint was not used in the final plan.
Lets do some tests to understand it better. For our tests I have a test table created called BIGTAB and loaded it with sample data. First case, I will try the PARALLEL_INDEX hint with one of the Index (non-partitioned) to see what the Hint Report says.
SQL> explain plan for select /*+ PARALLEL_INDEX(BIGTAB,WEIGHT_IDX,2) */ * from bigtab where weight between -168444405 and 639413572;

Explained.

SQL> SELECT * FROM table(DBMS_XPLAN.DISPLAY(FORMAT=>'TYPICAL'));

PLAN_TABLE_OUTPUT
--------------------------------------------------------------------------------
Plan hash value: 441133017

----------------------------------------------------------------------------
| Id  | Operation         | Name   | Rows  | Bytes | Cost (%CPU)| Time     |
----------------------------------------------------------------------------
|   0 | SELECT STATEMENT  |        | 13613 |   252K|    70   (2)| 00:00:01 |
|*  1 |  TABLE ACCESS FULL| BIGTAB | 13613 |   252K|    70   (2)| 00:00:01 |
----------------------------------------------------------------------------

Predicate Information (identified by operation id):
---------------------------------------------------

PLAN_TABLE_OUTPUT
--------------------------------------------------------------------------------

   1 - filter("WEIGHT">=(-168444405) AND "WEIGHT"<=639413572)

Hint Report (identified by operation id / Query Block Name / Object Alias):
Total hints for statement: 1 (U - Unused (1))
---------------------------------------------------------------------------

   1 -  SEL$1 / BIGTAB@SEL$1
         U -  PARALLEL_INDEX(BIGTAB,WEIGHT_IDX,4)

20 rows selected.

SQL>
Here we are getting UNUSED (U) for PARALLEL_INDEX hint that we have used against index WEIGHT_INDEX, but it wasn’t honored because the PARALLEL_INDEX hint parallelizes an index range scan of a partitioned index. This is a common mistake with parallel_index hint is using it against a non-partitioned index, where it will be ignored.
Let me try the next case where I will make a syntax error with the hint INDEX, will pass it as INDEXX and see what the report says.
06:04:55 SQL>
06:04:55 SQL>
06:04:55 SQL> explain plan for select /*+ INDEXX(BIGTAB,WEIGHT_IDX) */ * from bigtab where weight between -168444405 and 639413572;

Explained.

Elapsed: 00:00:00.05
06:08:35 SQL> SELECT * FROM table(DBMS_XPLAN.DISPLAY(FORMAT=>'BASIC +HINT_REPORT'));

PLAN_TABLE_OUTPUT
----------------------------------------------------------------------------------------------------------------------------------------------------------------------------------------------------------------------------------------------------------------------------------------------------------------------------------------------------------------------------------------------------------------
Plan hash value: 441133017

------------------------------------
| Id  | Operation         | Name   |
------------------------------------
|   0 | SELECT STATEMENT  |        |
|   1 |  TABLE ACCESS FULL| BIGTAB |
------------------------------------

Hint Report (identified by operation id / Query Block Name / Object Alias):
Total hints for statement: 1 (E - Syntax error (1))
---------------------------------------------------------------------------

   1 -  SEL$1
         E -  INDEXX

15 rows selected.

Elapsed: 00:00:00.17
06:08:40 SQL>
And it says that there is was a syntax error (E) with the HINT, hence ignored by the optimizer.
Now, I will be trying a correct/valid hint with the SQL Statement and see what the hint report says about it.
SQL> explain plan for select /*+ INDEX(BIGTAB,WEIGHT_IDX) */ * from bigtab where weight between -168444405 and 639413572;

Explained.

SQL>

SQL> SELECT * FROM table(DBMS_XPLAN.DISPLAY(FORMAT=>'BASIC +HINT_REPORT'));

PLAN_TABLE_OUTPUT
----------------------------------------------------------------------------------------------------------------------------------------------------------------------------------------------------------------------------------------------------------------------------------------------------------------------------------------------------------------------------------------------------------------
Plan hash value: 2994241301

----------------------------------------------------------
| Id  | Operation                           | Name       |
----------------------------------------------------------
|   0 | SELECT STATEMENT                    |            |
|   1 |  TABLE ACCESS BY INDEX ROWID BATCHED| BIGTAB     |
|   2 |   INDEX RANGE SCAN                  | WEIGHT_IDX |
----------------------------------------------------------

Hint Report (identified by operation id / Query Block Name / Object Alias):
Total hints for statement: 1
---------------------------------------------------------------------------

   1 -  SEL$1 / BIGTAB@SEL$1
           -  INDEX(BIGTAB,WEIGHT_IDX)

16 rows selected.
And the report says that no error was reported and hint was correctly used, same can be seen in the change of access path of the execution plan.
Next, let me try any optimizer related hint, I will try the optimizer_index_cost_adj HINT to make the SQL more or less index friendly
03:32:43 SQL> explain plan for select /*+ opt_param('optimizer_index_cost_adj',20) */ * from bigtab where weight between -168444405 and 639413572;

Explained.

Elapsed: 00:00:00.00
03:32:53 SQL>

03:32:58 SQL> SELECT * FROM table(DBMS_XPLAN.DISPLAY(FORMAT=>'BASIC +HINT_REPORT'));

PLAN_TABLE_OUTPUT
----------------------------------------------------------------------------------------------------------------------------------------------------------------------------------------------------------------------------------------------------------------------------------------------------------------------------------------------------------------------------------------------------------------
Plan hash value: 441133017

------------------------------------
| Id  | Operation         | Name   |
------------------------------------
|   0 | SELECT STATEMENT  |        |
|   1 |  TABLE ACCESS FULL| BIGTAB |
------------------------------------

Hint Report (identified by operation id / Query Block Name / Object Alias):
Total hints for statement: 1
---------------------------------------------------------------------------

   0 -  STATEMENT
           -  opt_param('optimizer_index_cost_adj',20)

15 rows selected.

Elapsed: 00:00:00.02
And that worked too as no error or any status flag was reported in the hint report.
Next, I will try a non existing Index and will see what the report says about it.
SQL> explain plan for select /*+ INDEX(FATDBA_INDEX) */ * from bigtab where weight between -168444405 and 639413572;

Explained.

SQL> SELECT * FROM table(DBMS_XPLAN.DISPLAY(FORMAT=>'BASIC +HINT_REPORT'));

PLAN_TABLE_OUTPUT
--------------------------------------------------------------------------------
Plan hash value: 441133017

------------------------------------
| Id  | Operation         | Name   |
------------------------------------
|   0 | SELECT STATEMENT  |        |
|   1 |  TABLE ACCESS FULL| BIGTAB |
------------------------------------

Hint Report (identified by operation id / Query Block Name / Object Alias):
Total hints for statement: 1 (N - Unresolved (1))

PLAN_TABLE_OUTPUT
--------------------------------------------------------------------------------
---------------------------------------------------------------------------

   1 -  SEL$1
         N -  INDEX(FATDBA_INDEX)

15 rows selected.

SQL>
And the report says it was UNRESOLVED (N) as the Index doesn’t exists.
Let me try one more case where I will pass two bad or contradictory hints, will use both first_rows and all_rows together and will see what happens.
SQL> explain plan for select /*+ first_rows(1) all_rows */ * from BIGTAB;

Explained.

SQL> select * from dbms_xplan.display(format=>'basic +alias +hint_report');

PLAN_TABLE_OUTPUT
--------------------------------------------------------------------------------
Plan hash value: 441133017

------------------------------------
| Id  | Operation         | Name   |
------------------------------------
|   0 | SELECT STATEMENT  |        |
|   1 |  TABLE ACCESS FULL| BIGTAB |
------------------------------------

Query Block Name / Object Alias (identified by operation id):
-------------------------------------------------------------

PLAN_TABLE_OUTPUT
--------------------------------------------------------------------------------

   1 - SEL$1 / BIGTAB@SEL$1

Hint Report (identified by operation id / Query Block Name / Object Alias):
Total hints for statement: 2 (U - Unused (2))
---------------------------------------------------------------------------

   0 -  STATEMENT
         U -  all_rows / hint conflicts with another in sibling query block
         U -  first_rows(1) / hint conflicts with another in sibling query block

21 rows selected.

SQL>
The preceding report shows that the all_rows and first_rows(1) CBO mode hints conflict with one other. As the First_rows attempts to optimize the query to get the very first row back to the client as fast as possible, whereas All_rows attempts to optimize the query to get the very last row as fast as possible.
Last example I will try to pass multiple hints where few of them will be valid and rest invalid. I will pass FULL & PARALLEL valid hints, and will use two INDEX unresolved hints and one UNRESOLVED hint of MERGE with query block.
SQL> explain plan for select /*+ FULL(bigtab) INDEX(WEIGHT_IDX) INDEX(ID_IDX) MERGE(@SEL$1) PARALLEL(2) */ * from bigtab where weight between -168444405 and 639413572;

Explained.

SQL> select * from dbms_xplan.display(format=>'basic +alias +hint_report');

PLAN_TABLE_OUTPUT
----------------------------------------------------------------------------------------------------------------------------------------------------------------------------------------------------------------------------------------------------------------------------------------------------------------------------------------------------------------------------------------------------------------
Plan hash value: 305217024

-----------------------------------------
| Id  | Operation            | Name     |
-----------------------------------------
|   0 | SELECT STATEMENT     |          |
|   1 |  PX COORDINATOR      |          |
|   2 |   PX SEND QC (RANDOM)| :TQ10000 |
|   3 |    PX BLOCK ITERATOR |          |
|   4 |     TABLE ACCESS FULL| BIGTAB   |
-----------------------------------------

Query Block Name / Object Alias (identified by operation id):
-------------------------------------------------------------

   1 - SEL$1
   4 - SEL$1 / BIGTAB@SEL$1

Hint Report (identified by operation id / Query Block Name / Object Alias):
Total hints for statement: 5 (U - Unused (1), N - Unresolved (2))
---------------------------------------------------------------------------

   0 -  STATEMENT
           -  PARALLEL(2)

   1 -  SEL$1
         N -  INDEX(ID_IDX)
         N -  INDEX(WEIGHT_IDX)
         U -  MERGE(@SEL$1)

   4 -  SEL$1 / BIGTAB@SEL$1
           -  FULL(bigtab)

32 rows selected.
One of the very common scenarios that we DBAs has encountered are when the database is hanging, freeze or totally non responsive, or when your database crashes with a serious performance problem, or when the SQLPlus cannot connect to the server or when you noticed that we can not save the instance/node then most of the time DBA take the system state dump for further analysis or you can say for RCA purpose. In this case, if you want to obtain the current status of the database for later diagnosis, then we need to use SYSTEMSTATE dump to know what the process is doing, what it is waiting for, who is the resource owner, and who is blocking others. In case of the above problems, it is very helpful to analyze the cause of the problem by collecting SYSTEMSTATE dump in time.
In order to understand the purpose, let me create a situation, a problem, I will simulate a row locking (pessimistic type) case in to the database. From the first session I had created a table and insert few rows into it and didn’t commit and opened few others sessions and tried to update same row. And I can see a good amount of blocking is created in the database!
LOCK_TREE
----------
1.97
  1.58
  1.60
  1.75

USERNAME           SID    SERIAL# TY LOCK_TYPE     LOCK_REQUESTE       ID1        ID2 SQL_TEXT
----------- ---------- ---------- -- ------------- ------------- ---------- ---------- ----------------------------------------
SYS                 58      17036 TX None               Exclusive    589839       1777 update test set id=09 where ID=10
SYS                 60      21943 TX None               Exclusive    589839       1777 update test set id=09 where ID=10
SYS                 75         91 TX None               Exclusive    589839       1777 update test set id=09 where ID=10
Right time to generate the SYSTEMSTATE dump, below is how you can generate that. Do system state dump few times in a row, so we can determine whether the processes are hung or active.
-- connect with the database if its not hang or freeze
SQL>  connect / as sysdba

-- Connect using prelim option if its stalled or freeze
SQL>  sqlplus -prelim / as sysdba

-- Use SETMYPID command to select the current process as the ORADEBUG process
SQL>  oradebug setmypid
Statement processed.

-- This is to remove the limitation on the size of the trace file use.
-- In Oracle 8.1.6 and above the maximum size of the trace file defaults to UNLIMITED
SQL> oradebug unlimit
Statement processed.

-- This is to take the systemstate dumps with 266 level (short stack + dump)
SQL>  oradebug dump systemstate 266
Statement processed.

-- Or use below in case running on a RAC setup
SQL>  oradebug -g all dump systemstate 266

SQL>  oradebug dump systemstate 266
Statement processed.

SQL>  oradebug dump systemstate 266
Statement processed.

-- This command prints the name of the current trace file
SQL>  Oradebug tracefile_name
/u01/oracle/diag/rdbms/dixitdb/dixitdb/trace/dixitdb_ora_191381.trc
There are few other levels which you can use and are discussed below. Note: I highly recommend to check with Oracle support to use there levels as few of them with higher level are little risky and known to crash instances.
Level 2 : Takes a dump (not including the lock element)
Level 10 : Takes a dump including lock details
Level 11 : Takes a dump + global cache of RAC
Level 256 : Takes short stacks (function stack)
Level 258 (256 + 2) : Takes a short stack + dump (not including the lock element)
Level 266 (256 + 10) : Takes a short stack + dump
Level 267 (256 + 11) : Takes a short stack + dump + global cache of RAC
So we have artificially created a locking scenario on the database and we are aware about the sessions involved in this pessimistic type locking. Now we will use the same information and that will help us to navigate through the massive SYSTEMSTATE dumps. Lets dig into the trace file that we have generated for the session.
The first part or the header contains details like hostname, machine info, service, module and client details, followed by command processing’s that we did through ORADEBUG.
Next part is where you will see process summary and its dumps, including all user OSPIDs, their commands and blocking details with wait information and is the most interesting one and important section of the dump to understand the wait/blocking chain.
Dumping the Process Summary
       1: PSEUDO process
       2: PMON ospid 3904 sid 2 ser 9826, waiting for 'pmon timer'
       3: CLMN ospid 3906 sid 3 ser 8008, waiting for 'pmon timer'
       4: PSP0 ospid 3908 sid 4 ser 46393, waiting for 'rdbms ipc message'
       5: VKTM ospid 3910 sid 5 ser 26025, waiting for 'VKTM Logical Idle Wait'
       6: GEN0 ospid 3915 sid 6 ser 36023, waiting for 'rdbms ipc message'
       7: MMAN ospid 3917 sid 7 ser 17720, waiting for 'rdbms ipc message'
.....
......
.......
      47: USER ospid 5516 sid 79 ser 52211,
      49: USER ospid 4429 sid 58 ser 17036, waiting for 'enq: TX - row lock contention'
          Cmd: UPDATE
          Blocked by inst: 1, sid: 97, ser: 2507
          Final Blocker inst: 1, sid: 97, ser: 2507
      50: USER ospid 4538 sid 75 ser 91, waiting for 'enq: TX - row lock contention'
          Cmd: UPDATE
          Blocked by inst: 1, sid: 97, ser: 2507
          Final Blocker inst: 1, sid: 97, ser: 2507
      51: W006 ospid 4290 sid 76 ser 17641, waiting for 'Space Manager: slave idle wait'
      52: USER ospid 4636 sid 60 ser 21943, waiting for 'enq: TX - row lock contention'
          Cmd: UPDATE
          Blocked by inst: 1, sid: 97, ser: 2507
          Final Blocker inst: 1, sid: 97, ser: 2507
      55: M004 ospid 4722 sid 74 ser 6422, waiting for 'class slave wait'
And from the above trace section we understood that the final blocker is with SID 97, serial 2507 where SIDs 58,75 and 60 all waiting on event ‘enq: TX – row lock contention’.
Next section is where it dumps buffer cache working set information which contains size of the BC, number of pools, state information and other information. Followed by process level statistics – state, session, latching, post information along with short stack dumps which is debugging/triggering events that generates a trace file in case of any error and full chain. The trace also contains details about wait stacks, blocking chains (waiters), session event history,
Here in below section you will also see the SQL text (update test set id=09 where ID=10) and its details which has caused the blocking, its statistics, execution counts, active locking info, SQL ID, Table Info, HashValues and namespace info.
Next we will check more details about the blocker or the session that has blocked others, here SID 97 is the case.
    (session) sid: 97 ser: 2507 trans: 0x7815a9a8, creator: 0x7d3d9878
              flags: (0x41) USR/- flags2: (0x40009) -/-/INC
              flags_idl: (0x0) status: -/-/-/- kill: -/-/-/-
              DID: 0001-002E-000000010000-0000-00000000, short-term DID:
              txn branch: (nil)
              edition#: 134              user#/name: 0/SYS
              oct: 0, prv: 0, sql: (nil), psql: 0x71cc7dc8
              stats: 0x705a2930, PX stats: 0x128f8d84
    service name: SYS$USERS
    client details:
      O/S info: user: oracle, term: pts/1, ospid: 4321
      machine: oracleontario.ontadomain program: sqlplus@oracleontario.ontadomain (TNS V1-V3)
      application name: sqlplus@oracleontario.ontadomain (TNS V1-V3), hash value=2432467899
.....
........
.........
    Current Wait Stack:
     0: waiting for 'SQL*Net message from client'
        driver id=0x62657100, #bytes=0x1, =0x0
        wait_id=650 seq_num=652 snap_id=1
        wait times: snap=11 min 38 sec, exc=11 min 38 sec, total=11 min 38 sec
        wait times: max=infinite, heur=11 min 38 sec
        wait counts: calls=0 os=0
        in_wait=1 iflags=0x1a0
    There are 3 sessions blocked by this session.
    Dumping one waiter:
      inst: 1, sid: 58, ser: 17036
      wait event: 'enq: TX - row lock contention'
        p1: 'name|mode'=0x54580006
        p2: 'usn<<16 | slot'=0x9000f
        p3: 'sequence'=0x6f1
      row_wait_obj#: 77878, block#: 122337, row#: 0, file# 1
.........
............
.............
    Session Wait History:
        elapsed time of 0.000001 sec since current wait
     0: waited for 'SQL*Net message to client'
        driver id=0x62657100, #bytes=0x1, =0x0
        wait_id=649 seq_num=651 snap_id=1
        wait times: snap=0.000001 sec, exc=0.000001 sec, total=0.000001 sec
        wait times: max=infinite
        wait counts: calls=0 os=0
        occurred after 0.000040 sec of elapsed time
     1: waited for 'SQL*Net message from client'
        driver id=0x62657100, #bytes=0x1, =0x0
        wait_id=648 seq_num=650 snap_id=1
        wait times: snap=0.000557 sec, exc=0.000557 sec, total=0.000557 sec
        wait times: max=infinite
        wait counts: calls=0 os=0
        occurred after 0.000017 sec of elapsed time
     2: waited for 'SQL*Net message to client'
        driver id=0x62657100, #bytes=0x1, =0x0
        wait_id=647 seq_num=649 snap_id=1
        wait times: snap=0.000001 sec, exc=0.000001 sec, total=0.000001 sec
        wait times: max=infinite
        wait counts: calls=0 os=0
        occurred after 0.000015 sec of elapsed time
     3: waited for 'SQL*Net message from client'
        driver id=0x62657100, #bytes=0x1, =0x0
        wait_id=646 seq_num=648 snap_id=1
        wait times: snap=0.000280 sec, exc=0.000280 sec, total=0.000280 sec
        wait times: max=infinite
        wait counts: calls=0 os=0
        occurred after 0.000014 sec of elapsed time
     4: waited for 'PGA memory operation'
        =0x0, =0x0, =0x0
        wait_id=645 seq_num=647 snap_id=1
        wait times: snap=0.000349 sec, exc=0.000349 sec, total=0.000349 sec
        wait times: max=infinite
        wait counts: calls=0 os=0

....
......
........
You will also see details on SQLs that we’ve executed using same SID (97), here in my case I was running few SQLs to identify locking in the database and were captured in the dump along with its parent and child cursor details, followed by some object level stats.
Other important section is the ‘Enqueue Dump‘. Here in our case this section discloses that enqueue name was “TX-0009000F-000006F1-00000000-00000000” and was acquired in ‘X’ (Exclusive) mode by the holder session ID 97.
At the end it prints details about the redo transport, ASM File Info, SGA Information, PDB/CDB details …
KGSKSGA info:
is the system running: yes
  session that stopped the system: (nil)
number of plans 1 classes 4
low threshold delta 0
high threshold delta 2
number of cpus[0]: 1
thresholds - low[0]: 1, high[0]: 3
dynamic threshold adjustments - misbehave_adjust[0]: 0, cpu_util_adj[0]: 2
dynamic thresholds - low[0]: 3, high[0]: 5
running cnt[0]: 1, runnable cnt[0]: 3
flags: 0x0
debug: 0x0
all pointers:
num_latches 300 current 222 chg_class 0x74e364a0 chg_state 0x74e42020
class_list 0x74dfaa88,top_plan 0x7084e9d8, plan_list 0x74e03d38
heaps - kgsk subheap 0x74e142f0, plan heap 0x7b5d7438
backgrounds in_sched (pids):

.....
..........
...............
Redo Log Management (from krsk_dump_rlm)
  SRL min count:  0
  SRL max count:  0
  SRL min avail:  0
  SRL file size:  0
  SRL block size: 0
  SRL use FRA :   FALSE
So, if you want to dig in deep and want more proofs and details about the incident, SYSTEMSTATE dumps is a great source of all internals that were involved at the time of the problem. This isn’t limited to row locking problems, you can generate it for all sort of events, problems or issues i.e. Row cache, latch free, LC Locks, CBC are few of the common ones …
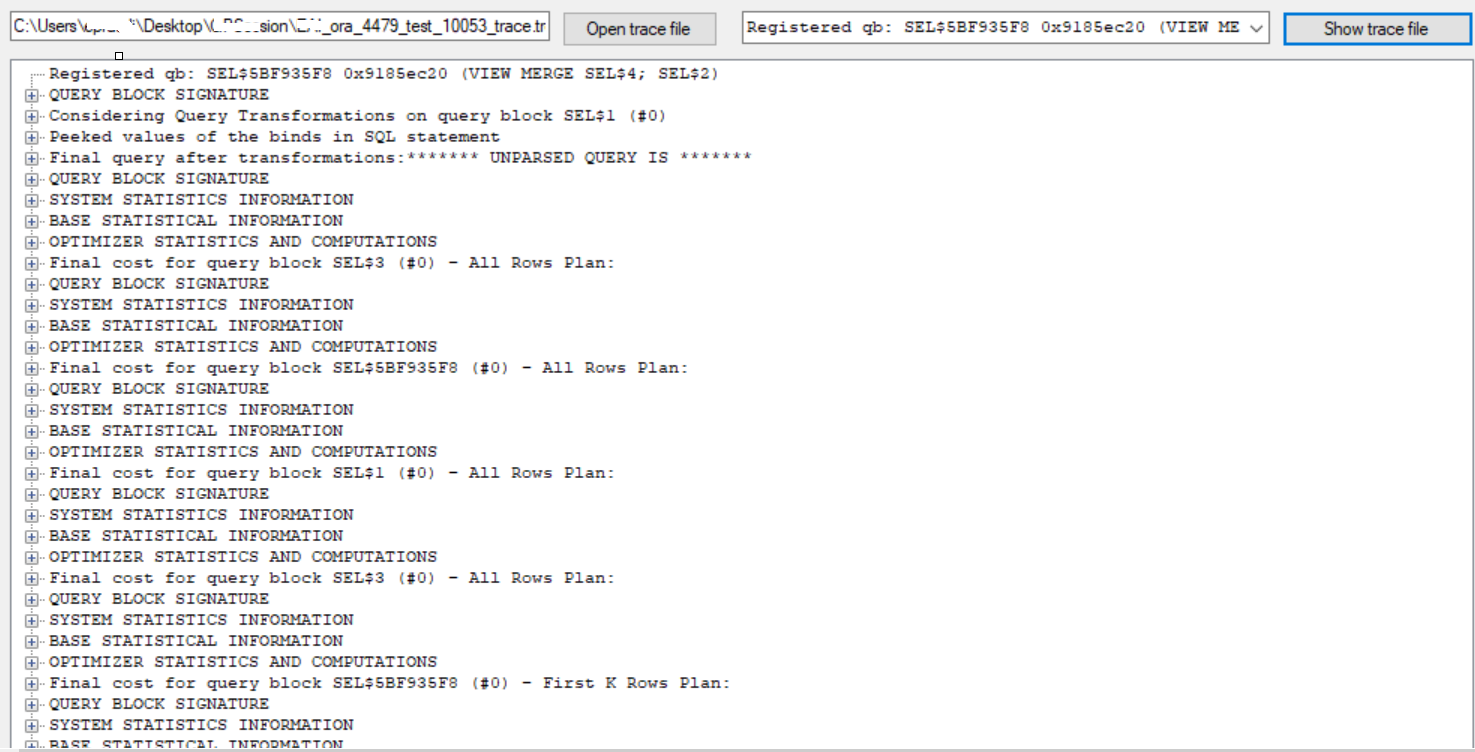
Finally, I’ve got a working copy of my favorite 10053 optimizer trace viewer from one of my connection. This one was written by Sergei Romanenko. I love it because it allows direct jumps to the most important parts of the trace and also uses highlighter to improve the readability of the trace and optionally formats the final query after transformations. It’s pretty easy to use, and you can directly search the keywords within these big thumping traces. And you can also wrap your text and can also format the final query.
I am sure that my last post about 10053 debug traces has sparked some interest in optimizer cost calculations and estimations 🙂 As you guys are familiar that these traces aren’t that easy to digest and interpret, as they are pretty complicated, a humongous pile of internal cryptic information’s. One of the reader asked – If there are any tool that can help to at least format the trace and its sections ? Yes, there are few and one of my favorite is the 10053 viewer, and is what I am using from last few years now (lucky that I found that great blog post by Jonathan Lewis).
The tool is pretty easy to use! You have to click on ‘open trace file’ button and browse the 10053 trace from the system and click on ‘show trace file’ (next button).
Now load the trace file.
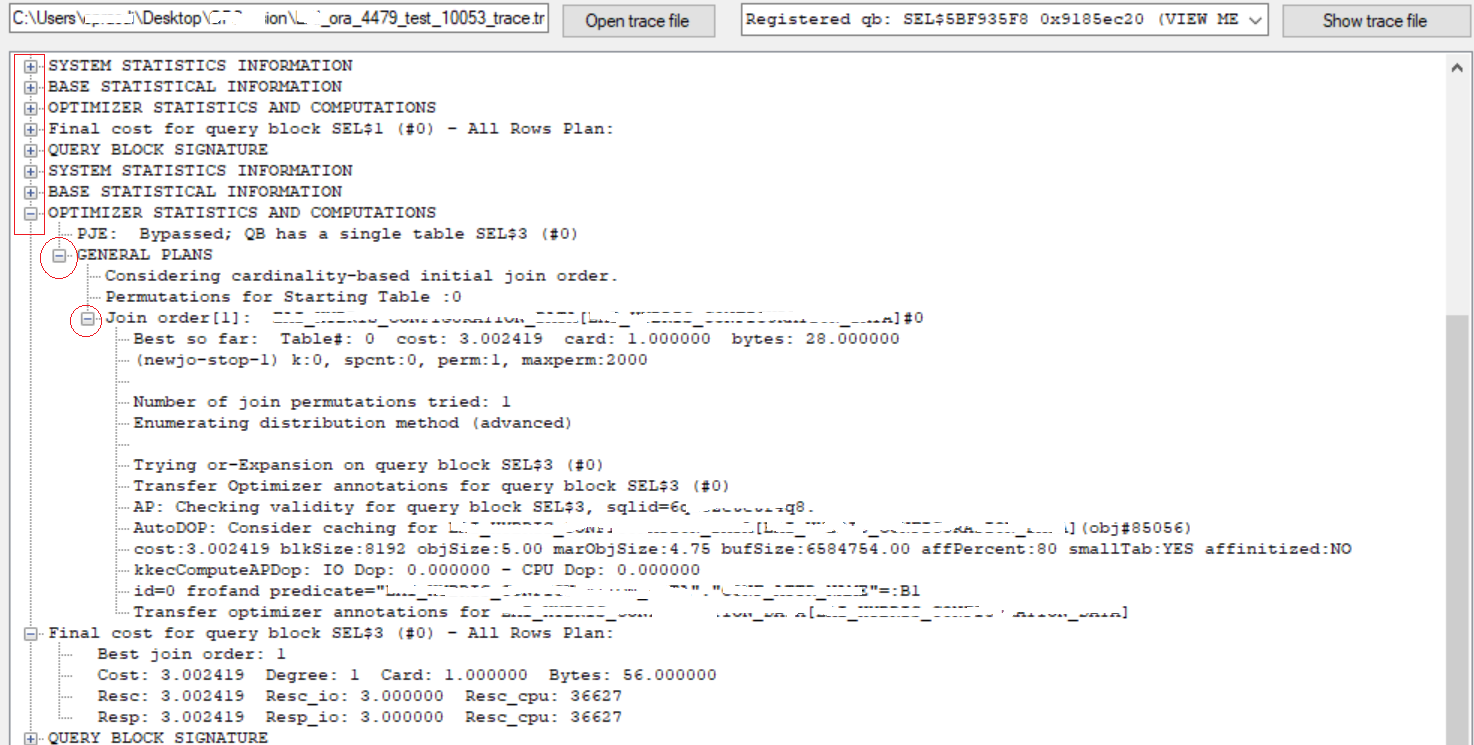
Now you’ll have a drop down view to select from. Once the trace is loaded, you can access sections by using ‘+’ to expand and ‘‘-‘ to minimize the section.
Expand to get more details about any particular section.
Oracle has a long list of internal debug codes and this tracing is an art and a real craft. 10046 debug traces is one of the popular method for collecting extended SQL trace (like SQL_TRACE=TRUE) information for Oracle sessions. This we specially use to determine or distinguish the nature of a SQL Tuning problem. By setting this event, you can get detailed trace information of Oracle’s internal execution system analysis, call, wait, and bind variables, which plays a very important role in analyzing the performance of the system. This provides a great source and different levels of details about SQLs.
This post is all about breaking the parts of the trace and understand some of the critical sections to help understanding about SQL stats that it captures. I am not going to show how to generate them as the steps are pretty straight forward and are available on metalink.
Though there are multiple use cases of 10046, but I recently used them to understand a complicated and costly PL/SQL program which has got more than 1000 different SQL’s inside that it calls and I was interested to check on the costliest among them and why is that …. Though there are surely other ways to get the details of same level like using SQL Profiler, SQL Traces etc. but none of them provides the level of details what 10046 gives) and elapsed time parsing (prsela).
Above used snippet is from live 10046 sorted traces from a production system running on 10.2.0.5.0 (Yes, an old application). There isn’t much different that you will notice if you execute it on any new version of database too, there are very few changes that you will notice in case running on a latest oracle DB version. Okay let’s first understand few of the keywords or column names used in the result.
TKPROF: Release 10.2.0.5.0 - Production on Fri Sep 27 03:31:42 2021

Copyright (c) 1982, 2007, Oracle.  All rights reserved.

Trace file: dixitdb_ora_28282_10046_for_spdixitM.trc
Sort options: exeela  fchela  prsela
********************************************************************************

SELECT COUNT(*)
FROM
 CANONTALAB.DIXIT1_SAMPLE WHERE DIXIT1_SAMPLE_NO=:B1


call     count       cpu    elapsed       disk      query    current        rows
------- ------  -------- ---------- ---------- ---------- ----------  ----------
Parse      134      0.00       0.00          0          0          0           0
Execute    862      0.03       0.03          0          0          0           0
Fetch      862     46.59      45.52          0    1235246          0         862
------- ------  -------- ---------- ---------- ---------- ----------  ----------
total     1858     46.63      45.55          0    1235246          0         862

Misses in library cache during parse: 1
Misses in library cache during execute: 1
Optimizer mode: ALL_ROWS
Parsing user id: 296  (CANONTALAB)   (recursive depth: 3)

Rows     Row Source Operation
-------  ---------------------------------------------------
      2  SORT AGGREGATE (cr=2866 pr=0 pw=0 time=114898 us)
      2   INDEX FAST FULL SCAN PK_DIXIT1_SAMPLE (cr=2866 pr=0 pw=0 time=114888 us)(object id 125001)


Rows     Execution Plan
-------  ---------------------------------------------------
      0  SELECT STATEMENT   MODE: ALL_ROWS
      2   SORT (AGGREGATE)
      2    INDEX   MODE: ANALYZED (UNIQUE SCAN) OF 'PK_DIXIT1_SAMPLE'
               (INDEX (UNIQUE))

Elapsed times include waiting on following events:
  Event waited on                             Times   Max. Wait  Total Waited
  ----------------------------------------   Waited  ----------  ------------
  db file sequential read                        60       12.17         43.54

********************************************************************************
COUNT – Represents the umber of times a SQL statement was parsed, executed, or was fetched. CPU – Total CPU time in seconds for all parse, execute, or fetch calls for the SQL. ELAPSED – Total elapsed time in seconds for all parse, execute, or fetch calls for the SQL statement. DISK – Total number of data blocks physically read from the datafiles on disk for all parse, execute, or fetch calls. QUERY – Total number of buffers retrieved in consistent mode for all parse, execute, or fetch calls. Usually, buffers are retrieved in consistent mode for queries. A Consistent Get is where oracle returns a block from the block buffer cache but has to take into account checking to make sure it is the block current at the time the query started. Or is a normal reading of a block from the buffer cache. A check will be made if the data needs reconstructing from rollback info to give you a consistent view CURRENT – Total number of buffers retrieved in current mode. Buffers are retrieved in current mode for statements such as INSERT, UPDATE, and DELETE. A DB block get (or current get in TKPROF) not only gets the block as it is right now, but it stops anyone else from getting that block (in current mode!) until we change it and release it. If someone else got there first, we wait. ROWS – Total number of rows processed by the SQL statement. This total does not include rows processed by subqueries of the SQL statement. Also the rows gives statistics about 3 calls: Parse, Execute & Fetch PARSE – Translates the SQL statement into an execution plan, including checks for proper security authorization and checks for the existence of tables, columns, and other referenced objects. This is where the physical and logical transformations and optimizations happens. EXECUTE – Actual execution of the statement by Oracle. For INSERT, UPDATE, and DELETE statements, this modifies the data. For SELECT statements, this identifies the selected rows. FETCH – Retrieves rows returned by a query. Fetches are only performed for SELECT statements.
Okay, now when all the column names and table entries are explained, let me try to explain what it represents in the form of those numbers.
It says 1235246 blocks were received in consistent mode during fetch operation. Since this is a SELECT statement, the blocks are shown during Fetch operation. If its a DML statement then blocks will be shown during Execute operation. Misses in library cache during each call. If there is no miss then it wont be mentioned. The 1 miss for the SQL is very much acceptable since when a SQL runs for the first time it need to be parsed and executed and execution plan will be stored. So parse and execute call will have 1 misses. If you see the statement parse call happened 134 times but the miss count is only 1, meaning that the statement was parsed only once and was stored in library cache. For next 133 parses the same parsed statement from library cache was used. So we have miss 1 and hit 133. Similarly execution plan was made only once and 861 times Oracle used same execution plan from library cache.
Now next jump to the row source operations and codes that it uses. cr = Consistent Reads, pr = Physical Reads, pw = Physical Writes, time = time taken by this step in microseconds. You might see some other codes used i.e. cost = cost incured by the step, size = represent the size of data in that step and card = cardinality.
So, the query was found doing an UNIQUE SCAN on it’s primary key index with name PK_DIXIT1_SAMPLE in ALL_ROWS mode and which is pretty understood as an equality predicate was used and the unique or primary key constraint was sufficient by itself to produce an index unique scan. And finally it shows wait event details and is pretty straight forward and says that it waits on ‘db file sequential read‘ with max wait time of 12.17
With the values above we need make a decision to whether to tune the SQL or not. Unless we have a locking problem or bad performing SQLs we shouldn’t worry about CPU time or the elapsed time. because timings come into consideration only when we have bad performing SQLs. The important factor is the number of block visits, both query (that is, subject to read consistency) and current (that is, not subject to read consistency). Segment headers and blocks that are going to be updated are acquired in current mode, but all query and subquery processing requests the data in query mode.
In today’s post I will try to explain the cost, stats (system & object level), join order, cardinality & the selectivity calculations about execution plan entries and will take help of the infamous 10053 optimizer traces. Though 10053 is notoriously complicated, detailed and extensive even for simple SQL statements but always has the wealth of information about optimizer decisions like plan directives, peeked bind values, predicate move around, Join elimination stats, query transformations, fix controls, join eliminations, join orders (easily complicated) & other computations or calculations. So, I will try to keep it as simple as I can.
About ways of generating the report, you can access it via ALTER SESSION, ORADEBUG or even through DBMS_SQLDIAG.DUMP_TRACE (does not require diagnostic pack). There are multiple use cases of using 10053, but the most common is when you want to compare any best or worst plans and you want to see the difference in cost calculations.
Alright, so this is the complete SQL statement followed up by its execution plan and predicate details.
SELECT * FROM (SELECT n.object_inst_id, n.name, n.type, rownum idx
FROM testsch.PDI_FBI_HASHAH1 n join testsch.PDI_FBI_HASHAH1_b on  TESTID_name = :"SYS_B_00"  and owning_object_id = n.object_inst_id
and n.name = NVL(null, n.name) AND n.status = NVL(:"SYS_B_01", :"SYS_B_02")
AND n.type = NVL(:"SYS_B_03", n.type) AND NVL(n.test_allocation,:"SYS_B_04") = NVL(NVL(null, n.test_allocation),:"SYS_B_05")
AND  NVL(n.number_usage, :"SYS_B_06")=:"SYS_B_07" AND ( n.owner IS NULL OR instr(lower(n.owner), :"SYS_B_08") > :"SYS_B_09" )
AND n.assigned_csn_id IS NULL AND n.locked_on IS NULL AND n.lock_owner IS NULL
AND (n.lock_id IS NULL OR n.LOCK_DATE <= (sysdate - NVL(n.lock_period,
(SELECT dixi_trait_values FROM testsch.PDI_HASHIS_MERGEDINFO_DATA WHERE HASH_BATTR_SHA = :"SYS_B_10")) / :"SYS_B_11" / :"SYS_B_12"))
AND target_object_id = :"SYS_B_13" ORDER BY TO_NUMBER(n.name)) OUTPUTS WHERE OUTPUTS.idx between :"SYS_B_14" and :"SYS_B_15"


----------------------------------------------------------------------------------------------------------------
| Id  | Operation                      | Name                          | Rows  | Bytes | Cost (%CPU)| Time     |
----------------------------------------------------------------------------------------------------------------
|   0 | SELECT STATEMENT               |                               |     2 |   364 |   107   (0)| 00:00:01 |
|*  1 |  VIEW                          |                               |     2 |   364 |   107   (0)| 00:00:01 |
|   2 |   COUNT                        |                               |       |       |            |          |
|   3 |    NESTED LOOPS                |                               |     2 |   340 |   107   (0)| 00:00:01 |
|*  4 |     TABLE ACCESS BY INDEX ROWID| PDI_FBI_HASHAH1               |  6719 |   505K|   106   (0)| 00:00:01 |
|*  5 |      INDEX FULL SCAN           | PDI_FBI_NNAME_UTYPE_STA_NPFIX |  3065 |       |     7   (0)| 00:00:01 |
|*  6 |      TABLE ACCESS FULL         | PDI_HASHIS_MERGEDINFO_DATA    |     1 |    28 |     3   (0)| 00:00:01 | --> How the CBO decided cost 3 ?
|*  7 |     INDEX RANGE SCAN           | IDX_TRNNUMBERB_SMOKE          |     1 |    93 |     1   (0)| 00:00:01 |
----------------------------------------------------------------------------------------------------------------


Predicate Information (identified by operation id):
---------------------------------------------------
   1 - filter("OUTPUTS"."IDX"<=10 AND "OUTPUTS"."IDX">=1)
   4 - filter("N"."TYPE"='MOBILE' AND ("N"."OWNER" IS NULL OR INSTR(LOWER("N"."OWNER"),'dna oyj')>0)
              AND NVL("N"."NUMBER_USAGE",'External')='Internal' AND "N"."ASSIGNED_CSN_ID" IS NULL AND
              NVL("N"."TEST_ALLOCATION",'EAI')=NVL(NVL(NULL,"N"."TEST_ALLOCATION"),'EAI') AND "N"."LOCKED_ON" IS NULL
              AND "N"."LOCK_OWNER" IS NULL AND ("N"."LOCK_ID" IS NULL OR
              "N"."LOCK_DATE"<=SYSDATE@!-NVL("N"."LOCK_PERIOD", (SELECT "DIXI_TRAIT_VALUES" FROM
              "TESTSCH"."PDI_HASHIS_MERGEDINFO_DATA" "PDI_HASHIS_MERGEDINFO_DATA" WHERE
              "HASH_BATTR_SHA"='MY_CALL_DURATION'))/60/24))
   5 - access("N"."STATUS"='Available')
       filter("N"."STATUS"='Available')
   6 - filter("HASH_BATTR_SHA"='MY_CALL_DURATION')
   7 - access("TESTID_NAME"='ind.fatdba.application.dss.more.production.BESTID.PDINumberBestSubClass'
               AND "OWNING_OBJECT_ID"="N"."OBJECT_INST_ID" AND "TARGET_OBJECT_ID"=21)
Let’s try to understand how optimizer come up with the cost numbers, how it derives these values, on what basis and what all it considers during the calculations. I will explaining about one of the access operation at Line ID 6 of the plan where it’s doing a TABLE ACCESS FULL on table PDI_HASHIS_MERGEDINFO_DATA and has a final cost of 3 associated with it.
So, what it is ? what all was happened under the hood by the optimizer to get this value of 3 for this operation ?
This is the subquery for which we will be checking the cost calculations within 10053 trace files.
(SELECT dixi_trait_values FROM testsch.PDI_HASHIS_MERGEDINFO_DATA WHERE HASH_BATTR_SHA = :"SYS_B_10")) / :"SYS_B_11" / :"SYS_B_12"))
Let me replace the sys generated values with their original values, for this I will be checking under “Peeked values of the binds in SQL statement” section. The same you can get from ‘predicate information’ section of the execution plan too, but let’s stick to 10053 for the moment.
Let’s check for access path analysis for this SQL.
***************************************
BASE STATISTICAL INFORMATION
***********************
Table Stats::
  Table: PDI_HASHIS_MERGEDINFO_DATA  Alias: PDI_HASHIS_MERGEDINFO_DATA
  #Rows: 5  SSZ: 0  LGR: 0  #Blks:  5  AvgRowLen:  31.00  NEB: 0  ChainCnt:  0.00  SPC: 0  RFL: 0  RNF: 0  CBK: 0  CHR: 0  KQDFLG: 1
  #IMCUs: 0  IMCRowCnt: 0  IMCJournalRowCnt: 0  #IMCBlocks: 0  IMCQuotient: 0.000000
try to generate single-table filter predicates from ORs for query block SEL$3 (#0)
finally: "PDI_HASHIS_MERGEDINFO_DATA"."DIXI_TRAIT_VALUES"=:B1

=======================================
SPD: BEGIN context at query block level
=======================================
Query Block SEL$3 (#0)
Applicable DS directives:
Return code in qosdSetupDirCtx4QB: NODIR
=====================================
SPD: END context at query block level
=====================================
Access path analysis for PDI_HASHIS_MERGEDINFO_DATA
***************************************
SINGLE TABLE ACCESS PATH
  Single Table Cardinality Estimation for PDI_HASHIS_MERGEDINFO_DATA[PDI_HASHIS_MERGEDINFO_DATA]
  SPD: Return code in qosdDSDirSetup: NOQBCTX, estType = TABLE
  Column (#1): CONF_ATTR_NAME(VARCHAR2)
    AvgLen: 24 NDV: 5 Nulls: 0 Density: 0.200000
  Table: PDI_HASHIS_MERGEDINFO_DATA  Alias: PDI_HASHIS_MERGEDINFO_DATA
    Card: Original: 5.000000  Rounded: 1  Computed: 1.000000  Non Adjusted: 1.000000
  Scan IO  Cost (Disk) =   3.000000
  Scan CPU Cost (Disk) =   36377.200000
  Total Scan IO  Cost  =   3.000000 (scan (Disk))
                         + 0.000000 (io filter eval) (= 0.000000 (per row) * 5.000000 (#rows))
                       =   3.000000
  Total Scan CPU  Cost =   36377.200000 (scan (Disk))
                         + 250.000000 (cpu filter eval) (= 50.000000 (per row) * 5.000000 (#rows))
                       =   36627.200000
  Access Path: TableScan
    Cost:  3.002419  Resp: 3.002419  Degree: 0
      Cost_io: 3.000000  Cost_cpu: 36627
      Resp_io: 3.000000  Resp_cpu: 36627
  Best:: AccessPath: TableScan
         Cost: 3.002419  Degree: 1  Resp: 3.002419  Card: 1.000000  Bytes: 0.000000

.....
.......

OPTIMIZER STATISTICS AND COMPUTATIONS
PJE:  Bypassed; QB has a single table SEL$3 (#0)
***************************************
GENERAL PLANS
***************************************
Considering cardinality-based initial join order.
Permutations for Starting Table :0
Join order[1]:  PDI_HASHIS_MERGEDINFO_DATA[PDI_HASHIS_MERGEDINFO_DATA]#0
***********************
Best so far:  Table#: 0  cost: 3.002419  card: 1.000000  bytes: 28.000000
***********************
If you check above you will see it considers the CPU & IO to generate the final cost values and that’s what we already know. Cost is the amount of work the optimizer estimates to run your query via a specific plan. The optimizer generally prefers lower cost plans. The optimizer’s cost model accounts for the IO, CPU, and network resources that will be used by the query. IO_COST: I/O cost of the operation as estimated by the query optimizer’s approach. The value of this column is proportional to the number of data blocks read by the operation. For statements that use the rule-based approach, this column is null. CPU_COST: CPU cost of the operation as estimated by the query optimizer’s approach. The value of this column is proportional to the number of machine cycles required for the operation. For statements that use the rule-based approach, this column is null.
At the same time it checks for dictionary stats to get table level information i.e. average row lenght, blocks, total rows and takes help of metrics NDV (nuber of distinct values), nulls, density of rows etc. to calculate the original cardinality of 5 (number of distinct entries) and the rounded cardinality of 1 – this SQL has resulted only into 1 row as an output, hence 1 is the rounded cardinality.
So, the main elements are ‘Scan IO Cost (Disk)’, ‘Scan CPU Cost (Disk)’ which finally derives the ‘Total Scan IO Cost’ value of 3.
That’s how the optimizer has calculated this value of 3 for this specific access operation, similarly you understand any of the other access entries in plan, and their associated costs.
If you want to read more on 10053 traces, I recommend you a great article by Wolfgang Breitling, Jonathan Lewis (his book cost-based Oracle fundamentals) & few posts from Maria Colgan.
Recently I was working on a performance issue where customer reported frequent slowness and hang issues with their newly migrated 12.2 2-Node RAC cluster. I was involved at the time when issue was already gone and now I had to dig out the data the history either from AWR or via DBA_HIST_XX views. I started glancing over AWR reports for the probe period (~ 2 hours). I saw especially node 1 was swamped with excessive ‘row cache lock’ wait events, and that’s too with very high average wait time of 7973.47 ms (~ 8 seconds per wait). Though similar waits were found happening on instance 2, but quite less as compared to node1 (take a look at the AWR snip below)
You can also see ‘enq: SQ – contention’ in place of ‘row cache locks’ as this got renamed.
Below is the snippet from AWR that states it spend ~ 99% of DB Time% on sequence loading.
While checking ‘enqueue stats’ I saw ‘SQ-Sequence Cache’ type enqueues with very high overall wait period of 545 seconds (~ 9 minutes).
Next target was to find out the source SQL or the statements waiting on these row cache lock waits. And as expected, it was a SQL that interacts with the sequence to generate the NEXTVAL and feed that information to another statements that inserts records to a frequently accessed application log table. You can think of that statement something like below …
-- Generating next available value from the sequence
SELECT TEST_SEQ.NEXTVAL FROM DUAL;
And source being a sequence, I thought of generating the DDL to see all its options or properties. And as expected, this sequence has NOCACHE option because this was recently upgraded from a standalone 12.1 database to a new 12.2 2-Node RAC cluster. The main reason for specifying NOCACHE earlier was to avoid gaps in sequence number as the value is not lost when the instance abnormally terminates.
CREATE SEQUENCE "DIXIT"."TEST_SEQ" MINVALUE 1 MAXVALUE 9999999999999999999999999999 INCREMENT BY 1 START WITH 1673163 NOCACHE NOORDER NOCYCLE NOKEEP NOSCALE GLOBAL ;
And we complety missed to modify sequences as per the best practice of having CACHE + NOORDER combination in case of RAC. With this combo, each instances caches a distinct set of numbers in the shared pool & Sequences will not be globally ordered.
When caching is used, then the dictionary cache (the row cache) is updated only once with the new high watermark, e.g. when a caching of 20 is used and a nextval is requested the first time, then the row cache value of the sequence is changed in the dictionary cache and increased by 20. The LAST_NUMBER of the DBA_SEQUENCES get increased with the cache value or 20. The extracted 20 values, stored in the shared pool, will be distributed to the sessions requesting the nextval of it.
When no caching is used, then the dictionary cache has to be updated for any nextval request. It means the row cache has to be locked and updated with a nextval request. Multiple sessions requesting a nextval will hence be blocked on a ‘row cache lock’ wait. Each instance allocates numbers by access to the database but cache fusion may delay sending current seq$ block to a requesting instance if the block is busy owing to many sequence number allocations from the instance owning the current block image.
But there is a caveat when you use CACHE option and that is that the gaps in the sequence numbering occur when the sequence cache is lost e.g. any shared pool flush or instance shutdown like an single instance databases. When the sequence caching is used and the cached values are flushed from the shared pool. The same happen in RAC as in single instance databases. Any flush on any shared pool is enough to invalidate the cache value on RAC systems. And I don’t see any problem having a gap in the sequence, if not using a banking application.
Let me explain it through an example ..
-- Will create a sequence, default is to cache 20 sequence values in memory.

SQL> create sequence mytest_seq start with 1 increment by 1;

Sequence created.

SQL> select mytest_seq.nextval from dual;

  NEXTVAL
----------

         1

SQL> select mytest_seq.nextval from dual;

  NEXTVAL
----------

         2


-- The database is terminated and after startup, the next value of the sequence is selected.


SQL> select mytest_seq.nextval from dual;

  NEXTVAL
----------

        21

-- The first 20 values were in the cache, but only the first two were actually used.
-- When the instance got terminated, sequence values 3 through 20 were lost as they were in cache.
So, we decided to use caching, considering the average modifications and sequence generation requests to the main table, we planned to go with 500 sequence to be cached that Oracle will pre-allocate and keep in the memory for faster access.
ALTER SEQUENCE TEST_SEQ cache 500;
And yup, the issue got fixed as soon we made sufficient sequences numbers available in the cache and no more ‘row cache lock’ waits afterwards.
Recently, I was contacted by one of my friend who was battling with some performance issues, since they moved from 12c to 19c. He was mostly strained about a particular problem with the new 19c database where he was getting excessive concurrency classed waits of “cursor: mutex X” (> 92% of the DB Time) and some “cursor: mutex S” events in the database. This was leading to frequent database hang instances.
As per the above snippet from AWR report for the period, ‘cursor: mutex X’ was consuming more than 170 ms per wait or an average wait time and was responsible for more than 91% of the total DB Time consumption.
Initially I though it was a case of classic hard parsing issue, as Cursor: mutex S wait usually occurs when Oracle is serializing parsing of multiple SQL statements. I mean there must be SQLs which are going through excessive hard parsing and has too many child cursors in the library cache. So, I immediately checked section ‘SQL Ordered by Version Count’ and saw one individual statement was there with 7,201 versions or Childs within a period of 2 hours.
Same was confirmed through ASH report too (see below pasted snippet). This particular SELECT statement was waiting on both on these two concurrency classed events specific to library cache.
I further drilled down on this issue to identify the cause behind this problem by querying V$SQL_SHARED_CURSOR (for reasons) to know why a particular child cursor was not shared with existing child cursors, and I was getting BIND_EQUIV_FAILURE as a reason. The database has the ACS(Adaptive Cursor Sharing) and CFB(Cardinality Feedback) enabled and seemed a ‘cursor leak’ issue.
I also noted huge sleeps for CP type mutexes on functions kkscsAddChildNode & kkscsPruneChild, below is the snippet from AWR, take a look at the first two in red.
And when I was about to prepare the strategy (i.e. specific plan purges etc.) to handle the situation, I thought to generate the hang analyze to identify if there are any known/familiar hang chains within stack traces. And I saw most of the chains running the same cursor from different processes waiting on ‘cursor: mutex X’ with below error stack … I mean there were multiple unique sessions waiting for a parent cursor mutex in exclusive mode on the same cursor under the following stack.
So, we had an error stack showing wait chains running the same cursor from different processes waiting on ‘cursor: mutex X’ and with BIND_EQUIV_FAILURE=Y in V$SQL_SHARED_CURSOR and CFB & ACS enabled, it was appearing that this was happening due to some bug.
Oracle support confirmed my doubt. They affirmed that this was happening all due to two unpublished bugs 28889389 and 28794230. For first one we need to apply patch 28889389, which has the optimized code for cursor mutex while searching the parent cursor for the match, for second one 28794230, they recommended few alternatives .given below …
But even after setting above three undocumented parameters, which is to disable cardinality feedback and adaptive & extended cursor sharing, we only saw ~30% reduction in total waits. Later on they recommended us to apply the optimizer related bug fix control