Tales From A Lazy Fat DBA

Its all about Databases, their performance, troubleshooting & much more …. ยฏ\_(ใƒ„)_/ยฏ

Posts Tagged ‘performance’

Toronto Oracle Users Group (TOUG) Spring Meetup 2024 Slide deck

Posted by FatDBA on May 16, 2024

I appreciate Toronto Oracle Users Group (TOUG) for providing me with this fantastic opportunity to present. I trust that the audience enjoyed my presentation “Unveiling My Top 5 Favorites: Oracle 23ai Performance!

The meetup was fantastic, featuring some great presentations from Simo Vilmulen (Accenture – Enkitec Group) and Oleksiy Razborshchuk (from Oracle Corp).

Attached is the slide deck I utilized during the session. Please don’t hesitate to inquire about any of the six features or improvements we covered.

Posted in Uncategorized | Tagged: , , | Leave a Comment »

Experiencing ORA-15554 Error During Real Application Testing, Despite Database Being in PREPARE Mode

Posted by FatDBA on February 24, 2024

Recently, I was working to simulate a production workload on a new server and analyze the potential impact of changes made to the Oracle Database. Armed with my favorite testing tool from Oracle, Real Application Testing (RAT), everything seemed to progress smoothly until I encountered a roadblock during the replay phase on the target system via workload clients (wrc replay clients). This incident occurred while conducting workload replay on Oracle Database 21c Release 3 within one of the Pluggable Databases (PDB).

Yes, you read it right โ€“ replaying workload within a PDB! Since Oracle Release 19c, a significant enhancement allows capturing and replaying workloads at the individual PDB level. In the past, this capability was confined to capturing and replaying multitenant databases at the root multitenant container database (CDB) level. If you’re curious about this enhancement, I delved into it in a previous blog post, providing comprehensive details and explanations. You can explore it here: Real Application Testing for Capture and Replay in a PDB: A Great Addition Made in 19c.

Now, before we delve into the intricacies of the encountered issue, let’s acknowledge an observation. There were instances where, amidst the excitement of working with new options, we totally forgot to enable PREPARE mode for REPLAY within the PDB, especially when working with versions 19c & above. It might seem trivial, but it’s a common oversight that can lead to unexpected hurdles. In such cases, the CDB might be in PREPARE mode, but the oversight within the PDB can be the root cause.

Assuming you’ve ensured that PREPARE mode is correctly set up for your PDB, and you’re still facing issues, let’s dive into troubleshooting this error. The next steps involve a meticulous investigation to understand what’s happening behind the scenes.

SQL> select id, name, status from dba_workload_replays;

        ID NAME                                     STATUS
---------- ---------------------------------------- ----------------------------------------
         1 REPLAY_MYDB12_3HRS_252024                PREPARE

[oracle@testbox-fatdba ~]$ wrc rattest/rattest@pdb1 mode=replay replaydir=/home/oracle/replaydir
Workload Replay Client: Release 21.3.0.0.0 - Production on Sat Feb 24 12:51:50 2024
Copyright (c) 1982, 2021, Oracle and/or its affiliates.  All rights reserved.

(wrc_main_507216.trc) ORA-15554: cannot start workload replay client because the database server is not in PREPARE mode

Lets see if we have to redo of prepare mode solves the problem.

SQL> execute DBMS_WORKLOAD_REPLAY.PREPARE_REPLAY(synchronization => 'SCN');
BEGIN DBMS_WORKLOAD_REPLAY.PREPARE_REPLAY(synchronization => 'SCN'); END;

*
ERROR at line 1:
ORA-20223: Invalid input. Database already in PREPARE mode.
ORA-06512: at "SYS.DBMS_WORKLOAD_REPLAY_I", line 5519
ORA-06512: at "SYS.DBMS_WORKLOAD_REPLAY", line 153
ORA-06512: at line 1

No, lets try and create a separate user and assign all required permissions to it and see if that solves the issue.

SQL> show pdbs;

    CON_ID CON_NAME                       OPEN MODE  RESTRICTED
---------- ------------------------------ ---------- ----------
         3 PDB1                           READ WRITE NO
SQL>
SQL> create user appuser identified by oracle90;
User created.
SQL> grant ratuser to appuser;
Grant succeeded.
SQL>
SQL> grant create session to appuser;
Grant succeeded.
SQL>
SQL> Create role ratuser;
Role created.
SQL> Grant create session to ratuser;
Grant succeeded.
SQL> Grant execute on dbms_workload_repository to ratuser;
Grant succeeded.
SQL> Grant administer SQL tuning set to ratuser;
Grant succeeded.
SQL> Grant create job to ratuser;
Grant succeeded.
SQL> Grant execute on dbms_workload_capture to ratuser;
Grant succeeded.
SQL> Grant execute on dbms_workload_replay to ratuser;
Grant succeeded.
SQL> Grant oem_advisor to ratuser;
Grant succeeded.
SQL> Grant create session to ratuser;
Grant succeeded.
SQL> Grant become user to ratuser;
Grant succeeded.
SQL> Grant create any directory to ratuser;
Grant succeeded.
SQL> Grant select_catalog_role to ratuser;
Grant succeeded.
SQL>

SQL> grant ratuser to appuser;
Grant succeeded.

Let’s try now and see how it goes with this new application user that we just created with all right permissions.

[oracle@testbox-fatdba ~]$ wrc appuser/oracle90@pdb1 mode=replay replaydir=/home/oracle/replaydir
Workload Replay Client: Release 21.3.0.0.0 - Production on Sat Feb 24 13:14:19 2024
Copyright (c) 1982, 2021, Oracle and/or its affiliates.  All rights reserved.

Wait for the replay to start (13:14:19)

Yeah, and this is working fine.

Hope It Helped!
Prashant Dixit

Posted in Uncategorized | Tagged: , , , , | Leave a Comment »

Oracle’s Evolution: Sweet Little Dual Tables Exiled in 23c

Posted by FatDBA on December 28, 2023

Hi All,

Here comes what is likely the final post of the year 2023!

While there have been previous discussions on this topic, I’d like to delve deeper into the specific enhancements and features related to the use of the DUAL table in Oracle 23c and little more about this sweet little object in Oracle databases โ€ฆ

The DUAL table has been a part of the Oracle Database for a very long time. It has been a fundamental component of Oracle’s SQL language for decades. The DUAL table in Oracle Database serves a specific purpose and is often used for various tasks. Its primary function is to provide a one-row, one-column table that can be used for evaluating expressions or performing certain types of queries. DUAL is a table automatically created by Oracle Database along with the data dictionary. DUAL is in the schema of the user SYS but is accessible by the name DUAL to all users. It has one column, DUMMY, defined to be VARCHAR2(1), and contains one row with a value X.

Some of the very popular use cases of it are – When evaluating expressions (SELECT SYSDATE FROM DUAL), Providing Constants (SELECT 10 * 5 FROM DUAL), In PL/SQL blocks or scripts, the DUAL table can be used to store and retrieve scalar values, we often use the DUAL table during testing or debugging to check the result of an expression or function without the need for an actual table โ€ฆ I always remember it using as a quick way to check connectivity of the database etc. I mean while it seemingly mundane, the DUAL table is a small but significant component in the Oracle database ecosystem, serving a variety of purposes across different contexts.

One of the interesting performance tip related to DUAL tables that I remember is – Starting from Oracle Database 10g Release 1, when calculating an expression that excludes the DUMMY column in the DUAL table, logical I/O is not executed. This optimization is identified as FAST DUAL in the execution plan. However, if you explicitly SELECT the DUMMY column from DUAL, this optimization is bypassed, and logical I/O is performed.

A quick example :

SQL> explain plan for select * from dual;        ---> Logical IO will be performed.

select * from table(dbms_xplan.display(format=>'basic'));

----------------------------------
| Id | Operation | Name |
----------------------------------
| 0 | SELECT STATEMENT | |
| 1 | TABLE ACCESS FULL| DUAL |
----------------------------------

Yet, when choosing a standard expression from DUAL, the FAST DUAL row source is employed:

SQL> explain plan for select sysdate from dual;    ---> No Logical IO will be performed.

select * from table(dbms_xplan.display(format=>'basic'));

---------------------------------
| Id | Operation | Name |
---------------------------------
| 0 | SELECT STATEMENT | |
| 1 | FAST DUAL | |
---------------------------------

Starting with Oracle 23c, there is no need to explicitly select expressions from the DUAL table; you can simply omit the FROM clause altogether. Lets do a quick demo.

---------------------------------
-- Prior 23c release
---------------------------------
SQL > select sysdate from dual 

SYSDATE
---------
28-DEC-23

SQL > select sysdate;
ORA-00923 FROM keyword not found where expected


-- One more test
SQL> create sequence emp2;
Sequence Created

SQL> select emp2.nextval from dual;

NEXTVAL
---------
1

SQL> select emp2.nextval;
ORA-00923 FROM keyword not found where expected


---------------------------------
-- In Oracle 23c 
---------------------------------
SQL > select sysdate;
SYSDATE
---------
28-DEC-23

SQL> create sequence emp2;
Sequence Created

SQL> select emp2.nextval from dual;

NEXTVAL
---------
1

SQL> select emp2.nextval;

NEXTVAL
---------
2

Hope It Helped
Prashant Dixit

Posted in Uncategorized | Tagged: , , , | 2 Comments »

A simple script to automatically catch those intermittent database performance issues …

Posted by FatDBA on December 16, 2023

Hi All,

Occasionally, anticipating the occurrence of a problem becomes unpredictable, and simultaneously, dealing manually with a transient issue to extract necessary information may not always be feasible (mainly due to the rapid resolution of the problem before we can initiate the extraction process). Additionally, there is a requirement for adaptability in the content we aim to extract.

The ensuing approach allows us to attain our primary objectives without resorting to invasive measures. There could be multiple use cases, few of the scenarios would be :
Case 1 : With little changes to it, you can make it employable for gathering solely the system state upon encountering a specific wait event.
Case 2: Can be utilized for gathering 10046, error stack, etc., for the obstructing session when a designated wait event is triggered concurrently with the execution of a known SQL statement (SQL_ID).
Case 3: Utilizable for obtaining hang analysis, system state, and additionally, 10046, error stack for the session causing the obstruction when a specific wait event is encountered.

Let me explain how we can utilize this quick, short but handy code to generate the diagnostic dump like hanganalyze / systemstate / errorstack / 10046 trace etc if any session is found to be waiting on any specific wait event for any specific period of time.

This is the simple script to collect diagnostic information with few of the customizable parameters or inputs i.e. ‘waitevent’ which is for the event we know we have the problem with, ‘seconds’ is the amount of time we think a session can wait on that session before we decide it is stuck and want to trigger dumping and ‘tid’ which is the session we are going to attach to run oradebug against. This could be the waiting session, a blocking session.

In the example, I have modified the code to collect diag info if any session is found to be waiting on “enq: TX – row lock contention” waits above 10 seconds.

set serverout on
spool logit.sql
declare
waitevent varchar2(100):='enq: TX - row lock contention';
seconds number :=10;      
w1 v$session%rowtype;
w2 v$session%rowtype;
tid number := 0;

begin

loop
dbms_lock.sleep(seconds);
begin
select * into w1 
from v$session 
where event=waitevent and wait_time=0 and rownum=1;
dbms_lock.sleep(seconds);
select * into w2
from v$session
where wait_time=0
and sid=w1.sid
and event=waitevent
and seq#=w1.seq# ;
select spid into tid from v$process
where addr=(select paddr from v$session where sid=w2.blocking_session);
dbms_output.put_line('oradebug setospid '||tid);
dbms_output.put_line('oradebug unlimit');
dbms_output.put_line('oradebug hanganalyze 3');  /**If RAC then use -G all**/
dbms_output.put_line('oradebug tracefile_name');
dbms_output.put_line('exit');
exit;
exception
when no_data_found then null;
end;
end loop;
end;
/
exit


-- Result : 
SQL>  
oradebug setospid 6794
oradebug unlimit
oradebug hanganalyze 3
oradebug tracefile_name
exit

PL/SQL procedure successfully completed.

SQL> 

The subsequent instance is intricate yet showcases versatility of this simple script. In this scenario, I encounter an intermittent issue involving sessions experiencing wait times due to TX enqueue row lock contention. While I may not be overly concerned about these sessions, it is crucial for me to understand the actions of the session causing the blockage. Given that I am aware of the SQL being executed during that period, I can leverage this information to ensure accurate trapping of the relevant event.
Here is something that you can do to alter it accordingly.

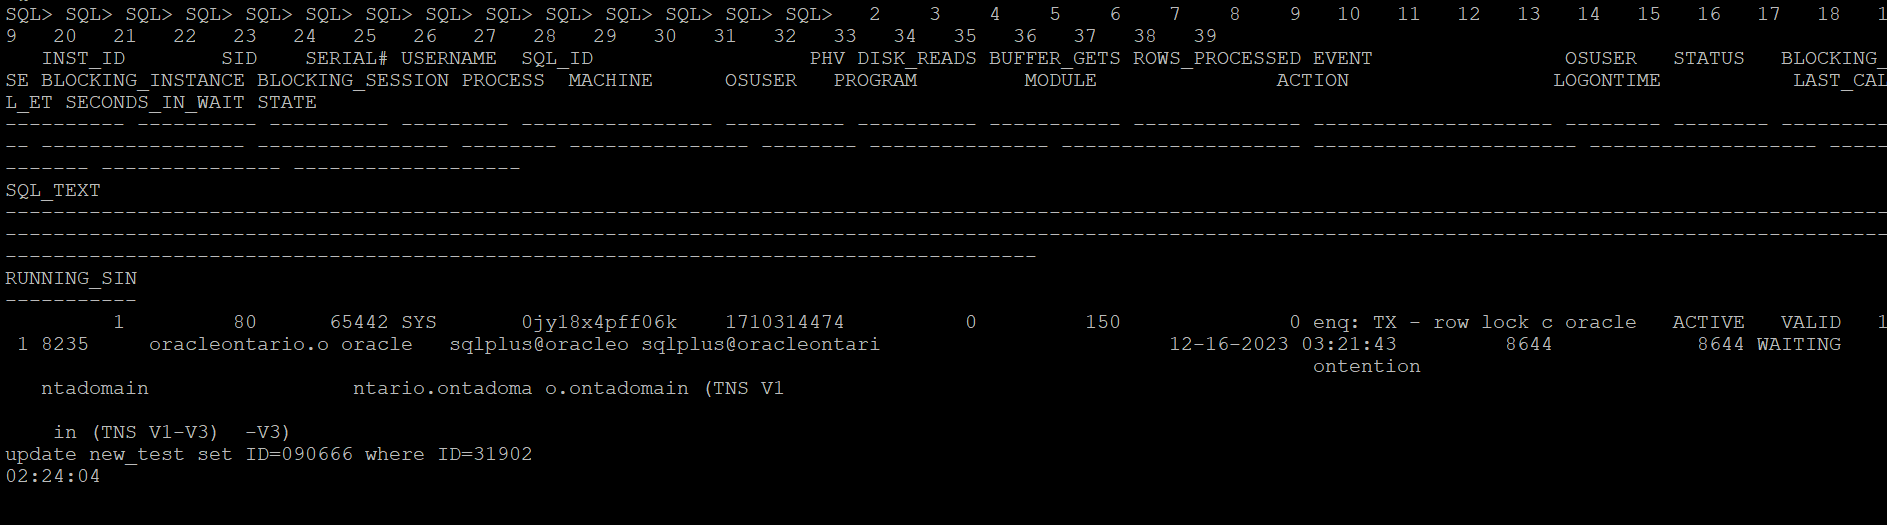
Let me create a row locking situation and see how it captures stats for a particular SQLID. Below is the row locking case that I have created to test how the scripts catches details for this SQLID ‘0jy18x4pff06k’

This is the modified version of the script which catches details for the SQL waiting on any specific wait event.

set serverout on
spool logit.sql
declare
waitevent varchar2(100):='enq: TX - row lock contention';
seconds number :=10;
w1 v$session%rowtype;
w2 v$session%rowtype;
tid number := 0;

begin

loop
dbms_lock.sleep(seconds);
begin
select * into w1
from v$session
where event=waitevent and wait_time=0 and sql_id='0jy18x4pff06k' and rownum=1;
dbms_lock.sleep(seconds);
select * into w2
from v$session
where wait_time=0
and sid=w1.sid
and event=waitevent
and seq#=w1.seq# ;
select spid into tid from v$process
where addr=(select paddr from v$session where sid=w2.blocking_session);
dbms_output.put_line('oradebug setospid '||tid);
dbms_output.put_line('oradebug unlimit');
dbms_output.put_line('oradebug dump errorstack 3');
dbms_output.put_line('oradebug event 10046 trace name context forever, level 8');
dbms_output.put_line('oradebug event 10200 trace name context forever, level 1');
dbms_output.put_line('oradebug event 10224 trace name context forever, level 1');
dbms_output.put_line('execute dbms_lock.sleep(20);');
dbms_output.put_line('oradebug event 10046 trace name context off');
dbms_output.put_line('oradebug event 10200 trace name context off');
dbms_output.put_line('oradebug event 10224 trace name context off');
dbms_output.put_line('exit');
exit;
exception
when no_data_found then null;
end;
end loop;
end;
/
exit


-- Result : 
SQL>  
oradebug setospid 6794
oradebug unlimit
oradebug dump errorstack 3
oradebug event 10046 trace name context forever, level 8
oradebug event 10200 trace name context forever, level 1
oradebug event 10224 trace name context forever, level 1
execute dbms_lock.sleep(20);
oradebug event 10046 trace name context off
oradebug event 10200 trace name context off
oradebug event 10224 trace name context off
exit

PL/SQL procedure successfully completed.

SQL> 

The next what we can do to trap any such wait events of interest when it exceeds the behnchmark, you can put eveything in a shell script and run it in the loop and execute the oradebug code. Once finished you can look it in the diagnostic_dest for the dump file. For 11g and above, look under subdirectory trace under home directory of ADR.

Next once you have put it in the shell script format, you can call it in the nohup mode and the script will run in background and sit in a loop for the defined condition to hit.

[oracle@oracleontario ~]$ more exec
#!/bin/bash
sqlplus -s '/ as sysdba' @waitdumpv1
[oracle@oracleontario ~]$
[oracle@oracleontario ~]$ chmod 777 exec
[oracle@oracleontario ~]$
[oracle@oracleontario ~]$

[oracle@oracleontario ~]$ nohup ./exec > waitdump2.log
nohup: ignoring input and redirecting stderr to stdout
[oracle@oracleontario ~]$

[oracle@oracleontario ~]$ more waitdump1.log
[oracle@oracleontario ~]$ nohup ./exec > waitdump2.log
nohup: ignoring input and redirecting stderr to stdout
[oracle@oracleontario ~]$ more waitdump2.log
oradebug setospid 6794
oradebug unlimit
oradebug hanganalyze 3
oradebug tracefile_name
exit

PL/SQL procedure successfully completed.

[oracle@oracleontario ~]$
[oracle@oracleontario ~]$

Hope It Helped!
Prashant Dixit

Posted in Uncategorized | Tagged: , , , , | Leave a Comment »

Some weirdness with V$DIAG_ALERT_EXT and magical support from Oracle Customer Support.

Posted by FatDBA on December 13, 2023

Hi All,

Recently, one of our custom monitoring scripts, which comprises more than 2000 lines of PL/SQL code covering all possible performance areas of the Oracle database, started behaving strangely on some 19c (19.15.0) databases. Usually, the report completes within 10-12 minutes on databases running version 12.2 and above, but it began taking approximately 30 minutes for a single run, with worst times exceeding 40 minutes. This issue seems to occur specifically on our 19c instances.

During analysis, we identified one of the underlying SQL queries in our script that queries V$DIAG_ALERT_EXT as the culprit, consuming most of the time and significantly exceeding average execution times. We utilize V$DIAG_ALERT_EXT to access the XML-formatted alert log from the Automatic Diagnostic Repository (ADR), particularly in cases where we can only access the database through integrated development environments (IDEs) like SQL Developer, and direct access to the databases is unavailable.

The SQL queries are straightforward, one of the simple one we used is focusing on capturing INCIDENT_ERROR and ERROR type codes. We have implemented filter conditions to select rows where the message_type is either 2 or 3 and where the originating_timestamp is within the last 8 hours (sysdate – 8/24 represents the current date and time minus 8 hours).

SELECT TO_CHAR(originating_timestamp,'DD/MM/YYYY HH24:MI:SS') AS time, message_text 

FROM v$diag_alert_ext
WHERE message_type IN (2, 3) AND originating_timestamp > sysdate - 8/24
ORDER BY RECORD_ID;

Initially, we were perplexed by the problem but were confident that it was specific to 21c databases, as all other versions where we had this script scheduled were working perfectly. After exhausting all optimization attempts and with no insights into what was happening with this specific dynamic view on this database version, we decided to engage Oracle support. They promptly confirmed that the issue was due to a known bug in Oracle 19c database – Bug 33513906, which is resolved in the 19.16.0.0.220719 (July 2022) Database Release Update (DB RU).

Oracle Database support stands out as one of the best I have worked with. They possess extensive knowledge about their products, provide comprehensive private and public documentation, and, in the presence of all diagnostic files, swiftly identify issues. Moreover, they offer both temporary and permanent fixes to problems.

Hope It Helped!
Prashant Dixit

Posted in Uncategorized | Tagged: , , , | Leave a Comment »

Why the Tablespace IO Stats are missing in my AWR report ?

Posted by FatDBA on October 22, 2023

Hi All,

In the past, I looked into a Database AWR performance report from a slow 19c where we suspected some IO issues and were looking into related metrics. “Tablespace IO Stats” was an important area and provided some important statistics like the average number of read requests per second, average read time in milliseconds, write waits, number of buffer waits, and average wait time in milliseconds for buffer waits for the tablespaces.

While looking into the report, I saw that the said section was not there and was missing for Tablespace IO stats. It appeared that the file IO statistics for Tablespaces had been disabled or were not collected. Below were the steps that you could do in such cases to get Tablespace IO stats data back in AWR reports in 19.X versions. Please run the following commands as SYS:

SQL> exec dbms_workload_repository.modify_table_settings(table_name => 'WRH$_FILESTATXS', flush_level => 'TYPICAL');
 
PL/SQL procedure successfully completed.
 
SQL> exec dbms_workload_repository.modify_table_settings(table_name => 'WRH$_DATAFILE', flush_level => 'TYPICAL');
 
PL/SQL procedure successfully completed.
 
SQL> exec dbms_workload_repository.modify_table_settings(table_name => 'Tempfile Group', flush_level => 'TYPICAL');
 
PL/SQL procedure successfully completed.
 
SQL> exec dbms_workload_repository.modify_table_settings(table_name => 'WRH$_TEMPFILE', flush_level => 'TYPICAL');
 
PL/SQL procedure successfully completed.
 
SQL> exec dbms_workload_repository.modify_table_settings(table_name => 'WRH$_TEMPSTATXS', flush_level => 'TYPICAL');
 
PL/SQL procedure successfully completed.
 
SQL>

When new AWR snapshots are generated, you will start getting Tablespace IO stats data for checking IO performance. You may have to run these commands in the PDBs also if you are generating AWR snapshots at PDB level and they are missing Tablespace IO stats data in AWR reports.

There is another way how you can force that data to the AWR, this is by using the new PL/SQL program called modify_table_settings() and that is recommended to be used to enable flushing of the tables WRH$_FILESTATXS, WRH$_DATAFILE and WRH$_TEMPSTATXS at TYPICAL or ALL depending on the flush_level of “Tempfile Group”.

Hope It Helped!
Prashant Dixit

Posted in Uncategorized | Tagged: , , , | Leave a Comment »

A simple lovely Python script to get complete row locking details in Oracle database …

Posted by FatDBA on August 12, 2023

Hi Guys,

Recently I was working on one row locking contention where the a particular row was locked in exclusive mode caused all subsequent sessions trying to modify that row went in to waiting mode and were were waiting on ‘enq: TX row lock contention‘ wait event. This was a classic pessimistic row locking scenario which was happening due to application design problem.

The situation is not new for most of the DBAs, and they know what is causing the block, the relationship of parent and child blockers, the blocking and block SIDs, lock modes etc., but things are sometimes difficult for non-DBA users who don’t know where to go, what to call and what to check where there is locking in the database stopping their program to finish and they are scratching their head.

I have tried to write a Python script which connects with the Oracle Database using cx_Oracle module using connection details and start executing blocking specific SQL statements embedded inside the python code. I have even tried to add exception handling for the cases when there is any syntax errors or any grammar issues. Tried to add color coding too with result seperators to make the output easy to read. The embedd code makes it self-reliant and complete and makes it very easy to run on any system.

The code is pasted below and is also available on my GitHub website. Here is the link to download the source code —> https://github.com/fatdba/OtherScripts/blob/main/Python-Locking-Main.py

We only have to make sure that we have Python, PIP and Python Module cx_Oracle installed on the server/host.

[oracle@fatdba ~]$ python --version
Python 2.7.5
[root@fatdba ~]# pip install cx_Oracle==7.3
Collecting cx_Oracle==7.3
  Downloading https://files.pythonhosted.org/packages/71/2a/91eb1ccb37a249772a93620ee0539a3f902b187ddb82978d8519abe03899/cx_Oracle-7.3.0-cp27-cp27mu-manylinux1_x86_64.whl (728kB)
    100% |โ–ˆโ–ˆโ–ˆโ–ˆโ–ˆโ–ˆโ–ˆโ–ˆโ–ˆโ–ˆโ–ˆโ–ˆโ–ˆโ–ˆโ–ˆโ–ˆโ–ˆโ–ˆโ–ˆโ–ˆโ–ˆโ–ˆโ–ˆโ–ˆโ–ˆโ–ˆโ–ˆโ–ˆโ–ˆโ–ˆโ–ˆโ–ˆ| 737kB 1.3MB/s
Installing collected packages: cx-Oracle
Successfully installed cx-Oracle-7.3.0
You are using pip version 8.1.2, however version 23.2.1 is available.
You should consider upgrading via the 'pip install --upgrade pip' command.
[root@fatdba ~]#
[root@fatdba ~]$ pip --version
pip 8.1.2 from /usr/lib/python2.7/site-packages (python 2.7)


Here is the code of the tool.
import cx_Oracle

# Database connection details
db_username = "system"
db_password = "xxxx"
db_host = "hostname-fqdn"
db_port = "1521"
db_service = "xxxx"

bold_start = "\033[1m"
color_green = "\033[32m"
reset_format = "\033[0m"

def print_colored(text, color_code):
    colored_text = "{}{}{}".format(color_code, text, reset_format)
    print(colored_text)

# Define the SQL statements
sql_statements = [
'''
SELECT rpad(instance_name, 17) current_instance, status, STARTUP_TIME, HOST_NAME, version, DATABASE_STATUS FROM v$instance
''',
"""
alter session set nls_date_format = 'DD-MON-YYYY HH24:MI:SS'
""",
"""
SELECT
    OUTPUT || CHR(10) || RPAD('-', LENGTH(OUTPUT) - LENGTH(REPLACE(OUTPUT, CHR(10), '')), '-') AS OUTPUT
FROM (
    SELECT
    'INST_ID -->  '||x.INST_ID || CHR(10) ||
    'Serial ID -->  '||x.sid || CHR(10) ||
    'Serial Num -->  '||x.serial# || CHR(10) ||
    'User Name -->  '||x.username || CHR(10) ||
    'Session Status -->  '||x.status || CHR(10) ||
    'Program -->  '||x.program || CHR(10) ||
    'Module -->  '||x.Module || CHR(10) ||
    'Action -->  '||x.action || CHR(10) ||
    'Machine -->  '||x.machine || CHR(10) ||
    'OS_USER -->  '||x.OSUSER || CHR(10) ||
    'Process -->  '||x.process || CHR(10) ||
    'State -->  '||x.State || CHR(10) ||
    'EVENT -->  '||x.event || CHR(10) ||
    'SECONDS_IN_WAIT -->  '||x.SECONDS_IN_WAIT || CHR(10) ||
    'LAST_CALL_ET -->  '||x.LAST_CALL_ET || CHR(10) ||
    'SQL_PROFILE --> '||SQL_PROFILE || CHR(10) ||
    'ROWS_PROCESSED --> '||ROWS_PROCESSED || CHR(10) ||
    'BLOCKING_SESSION_STATUS --> '||BLOCKING_SESSION_STATUS || CHR(10) ||
    'BLOCKING_INSTANCE --> '||BLOCKING_INSTANCE || CHR(10) ||
    'BLOCKING_SESSION --> '||BLOCKING_SESSION || CHR(10) ||
    'FINAL_BLOCKING_SESSION_STATUS --> '||FINAL_BLOCKING_SESSION_STATUS || CHR(10) ||
    'SQL_ID -->  '||x.sql_id || CHR(10) ||
    'SQL_TEXT -->  '||SQL_TEXT || CHR(10) ||
    'Logon Time -->  '||TO_CHAR(x.LOGON_TIME, 'MM-DD-YYYY HH24MISS') || CHR(10) ||
    'RunTime -->  '||ltrim(to_char(floor(x.LAST_CALL_ET/3600), '09')) || ':'
    || ltrim(to_char(floor(mod(x.LAST_CALL_ET, 3600)/60), '09')) || ':'
    || ltrim(to_char(mod(x.LAST_CALL_ET, 60), '09')) || CHR(10) AS OUTPUT,
    x.LAST_CALL_ET AS RUNT
    FROM   gv$sqlarea sqlarea
    ,gv$session x
    WHERE  x.sql_hash_value = sqlarea.hash_value
    AND    x.sql_address    = sqlarea.address
    AND    x.status='ACTIVE'
    AND x.event like '%row lock contention%'
    AND SQL_TEXT not like '%SELECT     OUTPUT || CHR(10)%'
    AND x.USERNAME IS NOT NULL
    AND x.SQL_ADDRESS    = sqlarea.ADDRESS
    AND x.SQL_HASH_VALUE = sqlarea.HASH_VALUE
)
ORDER BY RUNT DESC
""",
"""
with lk as (select blocking_instance||'.'||blocking_session blocker, inst_id||'.'||sid waiter
 from gv$session where blocking_instance is not null and blocking_session is not null and username is not null)
 select lpad(' ',2*(level-1))||waiter lock_tree from
 (select * from lk
 union all
 select distinct 'root', blocker from lk
 where blocker not in (select waiter from lk))
 connect by prior waiter=blocker start with blocker='root'
""",
"""
SELECT DECODE (l.BLOCK, 0, 'Waiting', 'Blocking ->') user_status
,CHR (39) || s.SID || ',' || s.serial# || CHR (39) sid_serial
,(SELECT instance_name FROM gv$instance WHERE inst_id = l.inst_id)
conn_instance
,s.SID
,s.PROGRAM
,s.inst_id
,s.osuser
,s.machine
,DECODE (l.TYPE,'RT', 'Redo Log Buffer','TD', 'Dictionary'
,'TM', 'DML','TS', 'Temp Segments','TX', 'Transaction'
,'UL', 'User','RW', 'Row Wait',l.TYPE) lock_type
,DECODE (l.lmode,0, 'None',1, 'Null',2, 'Row Share',3, 'Row Excl.'
,4, 'Share',5, 'S/Row Excl.',6, 'Exclusive'
,LTRIM (TO_CHAR (lmode, '990'))) lock_mode
,ctime
,object_name
FROM
   gv$lock l
JOIN
   gv$session s
ON (l.inst_id = s.inst_id
AND l.SID = s.SID)
JOIN gv$locked_object o
ON (o.inst_id = s.inst_id
AND s.SID = o.session_id)
JOIN dba_objects d
ON (d.object_id = o.object_id)
WHERE (l.id1, l.id2, l.TYPE) IN (SELECT id1, id2, TYPE
FROM gv$lock
WHERE request > 0)
ORDER BY id1, id2, ctime DESC
""",
"""
select l1.sid, ' IS BLOCKING ', l2.sid
from gv$lock l1, gv$lock l2 where l1.block =1 and l2.request > 0
and l1.id1=l2.id1
and l1.id2=l2.id2
""",
"""
select s2.inst_id,s1.username || '@' || s1.machine
 || ' ( SID=' || s1.sid || ' )  is blocking '
 || s2.username || '@' || s2.machine || ' ( SID=' || s2.sid || ' ) ' AS blocking_status
  from gv$lock l1, gv$session s1, gv$lock l2, gv$session s2
  where s1.sid=l1.sid and s2.sid=l2.sid and s1.inst_id=l1.inst_id and s2.inst_id=l2.inst_id
  and l1.BLOCK=1 and l2.request > 0
  and l1.id1 = l2.id1
  and l2.id2 = l2.id2
order by s1.inst_id
""",
"""
SELECT sid,
                                TYPE,
                                DECODE( block, 0, 'NO', 'YES' ) BLOCKER,
        DECODE( request, 0, 'NO', 'YES' ) WAITER,
        decode(LMODE,1,'    ',2,'RS',3,'RX',4,'S',5,'SRX',6,'X','NONE') lmode,
                                 decode(REQUEST,1,'    ',2,'RS',3,'RX',4,'S',5,'SRX',6,'X','NONE') request,
                                TRUNC(CTIME/60) MIN ,
                                ID1,
                                ID2,
        block
                        FROM  gv$lock
      where request > 0 OR block =1
""",
"""
select  sn.USERNAME,
        m.SID,
        sn.SERIAL#,
        m.TYPE,
        decode(LMODE,
                0, 'None',
                1, 'Null',
                2, 'Row-S (SS)',
                3, 'Row-X (SX)',
                4, 'Share',
                5, 'S/Row-X (SSX)',
                6, 'Exclusive') lock_type,
        decode(REQUEST,
                0, 'None',
                1, 'Null',
                2, 'Row-S (SS)',
                3, 'Row-X (SX)',
                4, 'Share',
                5, 'S/Row-X (SSX)',
                6, 'Exclusive') lock_requested,
        m.ID1,
        m.ID2,
        t.SQL_TEXT
from    v$session sn,
        v$lock m ,
        v$sqltext t
where   t.ADDRESS = sn.SQL_ADDRESS
and     t.HASH_VALUE = sn.SQL_HASH_VALUE
and     ((sn.SID = m.SID and m.REQUEST != 0)
or      (sn.SID = m.SID and m.REQUEST = 0 and LMODE != 4 and (ID1, ID2) in
        (select s.ID1, s.ID2
         from   gv$lock S
         where  REQUEST != 0
         and    s.ID1 = m.ID1
         and    s.ID2 = m.ID2)))
order by sn.USERNAME, sn.SID, t.PIECE
"""
]

banner = """
=========================================================
      Locking Stats Report
        Author: Prashant Dixit
        Version : 1.0
       Date : 2023-August-11
========================================================
"""
print_colored(banner, color_green)

try:
    # Establishing a database connection
    dsn = cx_Oracle.makedsn(db_host, db_port, service_name=db_service)
    connection = cx_Oracle.connect(user=db_username, password=db_password, dsn=dsn)

    # Executing each SQL statement
    cursor = connection.cursor()
    for idx, statement in enumerate(sql_statements):
        statement = statement.strip()
        if statement:
            try:
                cursor.execute(statement)

                if statement.upper().startswith("SELECT"):
                    result = cursor.fetchall()
                    if result:
                        column_names = [desc[0] for desc in cursor.description]
                        print_colored("Column Headers: " + ", ".join(column_names), color_green)
                        print("Results:")

                        for row in result:
                            print("Row:")
                            for col_name, col_value in zip(column_names, row):
                                print("{}: {}".format(col_name, col_value))
                            print("\n")

                    else:
                        print("No results.")

                    # Add a newline after the output of the first two SQL statements
                    #if idx == 1:
                     #   print("\n")

                #print("\n" * 1)  # Add a gap of one  lines

            except Exception as e:
                print("Error executing statement:", statement)
                print("Error details:", str(e))

    connection.commit()
    print("SQL statements execution completed.")

except Exception as e:
    connection.rollback()
    print("An error occurred:", str(e))

finally:
    if connection:
        connection.close()

…..

……

……

The output will look like this.

[oracle@fatdbatest ~]$ python locking.py

=========================================================
      Locking Stats Report
        Author: Prashant Dixit 
        Version : 1.0
       Date : 2023-August-11
========================================================

Column Headers: CURRENT_INSTANCE, STATUS, STARTUP_TIME, HOST_NAME, VERSION, BLOCKED, DATABASE_STATUS
Results:
Row:
CURRENT_INSTANCE: fatdba
STATUS: OPEN
STARTUP_TIME: 2023-06-03 19:42:57
HOST_NAME: fatdba.com
VERSION: 19.0.0.0.0
BLOCKED: NO
DATABASE_STATUS: ACTIVE


Column Headers: OUTPUT
Results:
Row:
OUTPUT: INST_ID -->  1
Serial ID -->  5065
Serial Num -->  17982
User Name -->  SYS
Session Status -->  ACTIVE
Program -->  sqlplus@fatdba.com (TNS V1-V3)
Module -->  sqlplus@fatdba.com (TNS V1-V3)
Action -->
Machine -->  fatdba.com
OS_USER -->  oracle
Process -->  6873
State -->  WAITING
EVENT -->  enq: TX - row lock contention
SECONDS_IN_WAIT -->  3
LAST_CALL_ET -->  4
SQL_PROFILE -->
ROWS_PROCESSED --> 0
BLOCKING_SESSION_STATUS --> VALID
BLOCKING_INSTANCE --> 1
BLOCKING_SESSION --> 5062
FINAL_BLOCKING_SESSION_STATUS --> VALID
SQL_ID -->  vdksq7js9b0cp
SQL_TEXT -->  update locking set id=100
Logon Time -->  08-11-2023 215112
RunTime -->  00:00:04

-------------------------

Column Headers: USER_STATUS, SID_SERIAL, CONN_INSTANCE, SID, PROGRAM, INST_ID, OSUSER, MACHINE, LOCK_TYPE, LOCK_MODE, CTIME, OBJECT_NAME
Results:
Row:
USER_STATUS: Blocking ->
SID_SERIAL: '5062,50729'
CONN_INSTANCE: fatdba
SID: 5062
PROGRAM: sqlplus@fatdba.com (TNS V1-V3)
INST_ID: 1
OSUSER: oracle
MACHINE: fatdba.com
LOCK_TYPE: Transaction
LOCK_MODE: Exclusive
CTIME: 9241
OBJECT_NAME: LOCKING


Row:
USER_STATUS: Waiting
SID_SERIAL: '5065,17982'
CONN_INSTANCE: fatdba
SID: 5065
PROGRAM: sqlplus@fatdba.com (TNS V1-V3)
INST_ID: 1
OSUSER: oracle
MACHINE: fatdba.com
LOCK_TYPE: Transaction
LOCK_MODE: None
CTIME: 5
OBJECT_NAME: LOCKING

Column Headers: SID, 'ISBLOCKING', SID
Results:
Row:
SID: 5062
'ISBLOCKING':  IS BLOCKING
SID: 5065


Column Headers: INST_ID, BLOCKING_STATUS
Results:
Row:
INST_ID: 1
BLOCKING_STATUS: SYS@fatdba.com ( SID=5062 )  is blocking SYS@fatdba.com ( SID=5065 )


Column Headers: SID, TYPE, BLOCKER, WAITER, LMODE, REQUEST, MIN, ID1, ID2, BLOCK
Results:
Row:
SID: 5062
TYPE: TX
BLOCKER: YES
WAITER: NO
LMODE: X
REQUEST: NONE
MIN: 154
ID1: 327688
ID2: 5988830
BLOCK: 1


Row:
SID: 5065
TYPE: TX
BLOCKER: NO
WAITER: YES
LMODE: NONE
REQUEST: X
MIN: 0
ID1: 327688
ID2: 5988830
BLOCK: 0


Column Headers: USERNAME, SID, SERIAL#, TYPE, LOCK_TYPE, LOCK_REQUESTED, ID1, ID2, SQL_TEXT
Results:
Row:
USERNAME: SYS
SID: 5065
SERIAL#: 17982
TYPE: TX
LOCK_TYPE: None
LOCK_REQUESTED: Exclusive
ID1: 327688
ID2: 5988830
SQL_TEXT: update locking set id=100

Hope It Helped!
Prashant Dixit

Posted in Uncategorized | Tagged: , , , | 1 Comment »

Auto Transaction Rollback in Oracle 23c – Is this the end of Row Lock Contention in Oracle Database ?

Posted by FatDBA on April 14, 2023

Hi Guys,

Oracle 23c is full of great features, one of the outstanding feature added to the version is the Automatic Transaction Rollback … Means no more long transaction level locking or the infamous event ‘enq: TX row lock contention‘ or the pessimistic locking ๐Ÿ™‚

In case of a row level locking or pessimistic level locking where a single row of a table was locked by one of the following statements INSERT, UPDATE, DELETE, MERGE, and SELECT โ€ฆ FOR UPDATE. The row level lock from first session will exist it performs the rollback or a commit. This situation becomes severe in some case i.e. The application modifies some rows but doesn’t commit or terminate the transaction because of an exception in the application. Traditionally, in such cases the database administrator have to manually terminate the blocking transaction by killing the parent session.

Oracle 23c has come up with a brilliant feature which it implements through a session settings to control the transaction priority. Transaction priority (TXN_PRIORITY) is set at session level using ALTER SESSION command. Once the transaction priority is set, it will remain the same for all the transactions created in that session. This parameter specifies a priority (HIGH, MEDIUM, or LOW) for all transactions in a user session. When running in ROLLBACK mode, you can track the performance of Automatic Transaction Rollback by monitoring the following statistics:

TXN_AUTO_ROLLBACK_HIGH_PRIORITY_WAIT_TARGET This param specifies the max number of seconds that a HIGH priority txn will wait for a row lock. Similarly, there is another parameter for MEDIUM classed statements TXN_AUTO_ROLLBACK_MEDIUM_PRIORITY_WAIT_TARGET which specifies the max number of seconds that a MEDIUM priority txn will wait for a row lock.
NOTE : Some of these parameters has changed and are discussed in my latest port — https://fatdba.com/2024/07/14/key-parameter-renaming-for-auto-transaction-rollback-feature-in-23ai/

Lets do a quick demo to explain this behavior in details.

I have created a small table with two rows and two columns and will use it for this demo to test automatic txn rollback features. To show a quick demo, I will set txn_auto_rollback_high_priority_wait_target to a lower value of 15 seconds. Will issue an UPDATE statement from the first session after setting the TXN_PRIORITY to ‘LOW‘ at the session level and will open a parallel session (session 2) and issue the same statement where the it will try to modify the same row already in exclusive lock mode by session 1.


--------------------------------------
-- SESSION 1 
--------------------------------------

[oracle@mississauga ~]$ sqlplus / as sysdba
SQL*Plus: Release 23.0.0.0.0 - Developer-Release on Fri Apr 14 22:46:34 2023
Version 23.2.0.0.0
Copyright (c) 1982, 2023, Oracle.  All rights reserved.
Connected to:
Oracle Database 23c Free, Release 23.0.0.0.0 - Developer-Release
Version 23.2.0.0.0

SQL>
SQL> select * from dixit;

        ID NAME
---------- --------------------
       999 Fatdba
       101 Prashant

SQL> select to_number(substr(dbms_session.unique_session_id,1,4),'XXXX') mysid from dual;  

     MYSID
----------
        59

SQL> show parameter TXN_AUTO_ROLLBACK_HIGH_PRIORITY_WAIT_TARGET

NAME                                         TYPE        VALUE
-------------------------------------------- ----------- ------------------------------
txn_auto_rollback_high_priority_wait_target  integer     15

SQL> alter session set TXN_PRIORITY=LOW;

Session altered.

SQL> show parameter TXN_PRIORITY

NAME                                 TYPE        VALUE
------------------------------------ ----------- ------------------------------
txn_priority                         string      LOW


-- I will now issue update and don't issue ROLLBACK or COMMIT 
SQL> update dixit set id=101010101 where name='Fatdba';

1 row updated.

SQL > 

Okay so the stage is set! We’ve already ran an UPDATE statement on the table from SESSION 1 (SID : 59) and I will open a new session (session 2) and issue the same statement, but here the txn_priority is set to its default ‘HIGH‘ and we’ve already set txn_auto_rollback_high_priority_wait_target to 15 seconds earlier.


--------------------------------------
-- SESSION 2 
--------------------------------------

[oracle@mississauga ~]$ sqlplus / as sysdba

SQL*Plus: Release 23.0.0.0.0 - Developer-Release on Fri Apr 14 22:46:34 2023
Version 23.2.0.0.0
Copyright (c) 1982, 2023, Oracle.  All rights reserved.
Connected to:
Oracle Database 23c Free, Release 23.0.0.0.0 - Developer-Release
Version 23.2.0.0.0

SQL>
SQL> select to_number(substr(dbms_session.unique_session_id,1,4),'XXXX') mysid from dual; 

     MYSID
----------
       305

SQL> show parameter TXN_PRIORITY;

NAME                                 TYPE        VALUE
------------------------------------ ----------- ------------------------------
txn_priority                         string      HIGH

-- Now this session will go into blocking state. 
SQL> update dixit set id=0 where name='Fatdba';
...
.....


Alright, so session 2 (SID : 305) with txn_priority=HIGH is now blocked, as the row was first locked in exclusive mode by session 1 (SID : 59), but we’ve set TXN_PRIORITY=LOW (at session level) and system level change of TXN_AUTO_ROLLBACK_HIGH_PRIORITY_WAIT_TARGET to 15 seconds,

Lets query the database and see what is waiting on what ?? You will see SID 305 (session 2) is waiting for the txn level lock and waiting on event ‘enq: TX – row lock (HIGH priority)‘. BTW, this also a new event added into Oracle 23c for sessions waiting with HIGH priorities, other two are for LOW and MEDIUM priorities.

SQL>
SQL> select event#, name, WAIT_CLASS from v$event_name where name like '%TX - row%';

    EVENT# NAME                                                             WAIT_CLASS
---------- ---------------------------------------------------------------- ----------------------------------------------------------------
       340 enq: TX - row lock contention                                    Application
       341 enq: TX - row lock (HIGH priority)                               Application
       342 enq: TX - row lock (MEDIUM priority)                             Application
       343 enq: TX - row lock (LOW priority)                                Application

SQL>


-----------------------------------------------------------------
-- Contention details (What has blocked what ?)   
-----------------------------------------------------------------


SQL>

 INST_ID        SID    SERIAL# USERNAME                                                                                                                     SQL_ID PLAN_HASH_VALUE DISK_READS BUFFER_GETS ROWS_PROCESSED EVENT
---------- ---------- ---------- -------------------------------------------------------------------------------------------------------------------------------- ------------- --------------- ---------- ----------- -------------- ----------------------------------------------------------------
OSUSER                                                                                                                           STATUS   BLOCKING_SE BLOCKING_INSTANCE BLOCKING_SESSION PROCESS               MACHINE                                                          PROGRAM
-------------------------------------------------------------------------------------------------------------------------------- -------- ----------- ----------------- ---------------- ------------------------ ---------------------------------------------------------------- ------------------------------------------------------------------------------------
MODULE                                                           ACTION                                                           LOGONTIME           LAST_CALL_ET SECONDS_IN_WAIT STATE
---------------------------------------------------------------- ---------------------------------------------------------------- ------------------- ------------ --------------- -------------------
SQL_TEXT
----------------------------------------------------------------------------------------------------------------------------------------------------------------------------------------------------------------------------------------------------------------------------------------------------------------------------------------------------------------------------------------------------------------
RUNNING_SIN
-----------
         1        305      15926 SYS                                                                                                                          9jwbjqg195zdw      2635034114   0           6              0 enq: TX - row lock (HIGH priority)
oracle                                                                                                                           ACTIVE   VALID                   1        59 8808                     mississauga.candomain                                            sqlplus@mississauga.candomain (TNS V1-V3)
sqlplus@mississauga.candomain (TNS V1-V3)                                                                                         04-14-2023 22:46:35       12               13 WAITING
update dixit set id=00000000 where name='Fatdba'
00:00:12

The session 2 (SID 305) will wait for 15 seconds and database will automatically snipes session 1 (SID 59) due to LOW priority and UPDATE issued by Session 2 will persist, whereas session 1 (SID 59) and will throw “ORA-03135: connection lost contact”.

-- SESSION 1 with SID 59 
SQL>
SQL> select * from dixit;
select * from dixit
       *
ERROR at line 1:
ORA-03135: connection lost contact
Process ID: 8843
Session ID: 59 Serial number: 31129


-- SESSION 2 with SID 305 
SQL> update dixit set id=0 where name='Fatdba';

1 row updated.

SQL>    select * from dixit;

        ID NAME
---------- --------------------
         0 Fatdba
       101 Prashant

SQL>

Taking a moment to credit Kishy Kumar, Director of Development at Oracle Database and who also led the Priority Transactions project at Oracle, for giving me feedback on this post and helping me make necessary corrections. Link : https://www.linkedin.com/in/kishyk

Hope It Helped!
Prashant Dixit

Posted in Uncategorized | Tagged: , , , | 6 Comments »

An Oracle Deadlock scenario and the importance of Event 10027 trace …

Posted by FatDBA on February 16, 2023

Hi Guys,

Recently someone asked me about Oracle debug 10027 trace event which we use in case of a deadlock scenario i.e. ORA-0060. Though the deadlock itself creates a trace file in DIAG directory, but 10027 trace event gives you a better control over the amount and type of DIAG information generated in response to the deadlock case. I mean the default trace file for deadlock (ora-60) contains cached cursors, a deadlock graph, process state info, current SQL Statements of the session involved and session wait history.
Event 10027 may be used to augment the trace information with a system state dump or a call stack in an attempt to find the root cause of the deadlocks. The minimum amount of trace information is written at level 1, at this level it will hardly contain deadlock graph and current AQL statements of the sessions involved.

In todays post I will try to simulate a deadlock scenario in one of my test box and will generate the 10027 trace with level 2 to get more information. Level 2 will give you cached cursors, process state info, session wait history for all sessions and the system state which is not possible in case of level 1. I am going to try with the Level 4 here as I want to get system state dump and don’t want to complicate this scenario.

I am going to create two tables – TableB is child table of TableA and some supporting objects to simulate the deadlock case.
Will try to simulate a deadlock scenario when insert/update/delete happens on TableB we need to sum the amount(amt) and then update it in TableA.total_amt column.

[oracle@oracleontario ~]$ sqlplus dixdroid/oracle90

SQL*Plus: Release 19.0.0.0.0 - Production on Thu Feb 16 03:58:12 2023
Version 19.15.0.0.0

Copyright (c) 1982, 2022, Oracle.  All rights reserved.

Last Successful login time: Thu Feb 16 2023 03:04:03 -05:00

Connected to:
Oracle Database 19c Enterprise Edition Release 19.0.0.0.0 - Production
Version 19.15.0.0.0

SQL> create table tableA (pk_id number primary key, total_amt number);

Table created.

SQL> create table tableB (pk_id number primary key, fk_id number references tableA(pk_id) not null, amt number);

Table created.

SQL>
SQL> CREATE OR REPLACE PACKAGE global_pkg
IS
fk_id tableA.pk_id%TYPE;
END global_pkg;  
/

Package created.

SQL>
SQL> CREATE OR REPLACE TRIGGER tableB_ROW_TRG
BEFORE INSERT OR UPDATE OR DELETE
ON tableB
FOR EACH ROW
BEGIN
IF INSERTING OR UPDATING
THEN
global_pkg.fk_id := :new.fk_id;
ELSE
global_pkg.fk_id := :old.fk_id;
END IF;
END tableB_ROW_TRG;
/

Trigger created.

SQL>
SQL>
SQL>
SQL> CREATE OR REPLACE TRIGGER tableB_ST_trg
AFTER INSERT OR UPDATE OR DELETE
ON tableB
BEGIN
IF UPDATING OR INSERTING
THEN
UPDATE tableA
SET total_amt =
(SELECT SUM (amt)
FROM tableB
WHERE fk_id = global_pkg.fk_id)
WHERE pk_id = global_pkg.fk_id;
ELSE
UPDATE tableA
SET total_amt =
(SELECT SUM (amt)
FROM tableB
WHERE fk_id = global_pkg.fk_id)
WHERE pk_id = global_pkg.fk_id;
END IF;
END tableB_ST_trg;

Trigger created.

SQL>
SQL>
SQL> insert into tableA values (1, 0);

1 row created.

SQL> insert into tableA values (2, 0);

1 row created.

SQL> insert into tableB values (123, 1, 100);

1 row created.

SQL> insert into tableB values (456,1, 200);

1 row created.

SQL> insert into tableB values (789, 1, 100);

1 row created.

SQL> insert into tableB values (1011, 2, 50);

1 row created.

SQL> insert into tableB values (1213,2, 150);

1 row created.

SQL> insert into tableB values (1415, 2, 50);

1 row created.

SQL> commit;

Commit complete.

SQL>

Lets query the table and see the record count and next will delete an entry from tableB and won’t commit. At the same time will check the locks — TM lock on tableA.

SQL>
SQL> select * from tableA;

     PK_ID  TOTAL_AMT
---------- ----------
         1        400
         2        250

SQL> delete tableB where pk_id = 1415;

1 row deleted.

SQL> SELECT sid,
(SELECT username
FROM v$session s
WHERE s.sid = v$lock.sid)
uname,
TYPE,
id1,
id2,
(SELECT object_name
FROM user_objects
WHERE object_id = v$lock.id1)
nm
FROM v$lock
WHERE sid IN (SELECT sid
FROM v$session
WHERE username IN (USER)); 


       SID UNAME                          TY        ID1        ID2 NM
---------- ------------------------------ -- ---------- ---------- ------------------------------
       440 DIXDROID                       AE        134          0
       440 DIXDROID                       TX     589853       3078
       440 DIXDROID                       TM      82284          0 TABLEB
       440 DIXDROID                       TM      82282          0 TABLEA


I will now connect to another session (sesion 2) and delete from tableB and that will induce a locking scenario in the database and session 2 will go into hung/waiting state.

---- from session 2:
SQL>
SQL>
SQL> delete tableB where pk_id = 1213;
.....
.........
............. <HUNG > <HUNG > <HUNG > <HUNG > <HUNG > 

Lets see more stats on the blocking session.

SQL>
SQL> SELECT (SELECT username
FROM v$session
WHERE sid = a.sid)
blocker,
a.sid,
' is blocking ',
(SELECT username
FROM v$session
WHERE sid = b.sid)
blockee,
b.sid
FROM v$lock a, v$lock b
WHERE a.block = 1 AND b.request > 0 AND a.id1 = b.id1 AND a.id2 = b.id2;  


BLOCKER                     SID 'ISBLOCKING'  BLOCKEE                               SID
-------------------- ---------- ------------- ------------------------------ ----------
DIXDROID                    440  is blocking  DIXDROID                              427

And as expected 440 SID is now blocking 427. Now lets go back to the original (session 1) and will try to delete from tableB again and this will snipe the session 2 which is still in hung/wait state and will throw a deadlock error (ORA-00060). Though we have already collected blocking information from v$lock + v$session but to get more clarify about blocking sessions, I will set the 10027 trace event with level 2.

This will increase our chance of finding the root cause of the deadlocks. If the setting shall persist across instance startups, you need to use the initialization parameter EVENT.

i.e. EVENT=”10027 trace name contex forever, level 2″ otherwise use ALTER SYSTEM version of it.

------------------------------------------------------------
-- Execute below statement in session1
------------------------------------------------------------
delete tableB where pk_id = 1213;


---------------------------------------------------------------------------------------
-- Oracle is throwing deadlock error as below in session2
---------------------------------------------------------------------------------------
SQL>
SQL> ALTER SYSTEM SET EVENTS '10027 trace name context forever, level 2';

System altered.

SQL> delete tableB where pk_id = 1213;
delete tableB where pk_id = 1213
       *
ERROR at line 1:
ORA-00060: deadlock detected while waiting for resource
ORA-06512: at "DIXDROID.TABLEB_ST_TRG", line 11
ORA-04088: error during execution of trigger 'DIXDROID.TABLEB_ST_TRG'

-- same captured in alert log too.
2023-02-16T04:02:57.648156-05:00
Errors in file /u01/app/oracle/diag/rdbms/dixitdb/dixitdb/trace/dixitdb_ora_29389.trc:
2023-02-16T04:03:00.019794-05:00
ORA-00060: Deadlock detected. See Note 60.1 at My Oracle Support for Troubleshooting ORA-60 Errors. More info in file /u01/app/oracle/diag/rdbms/dixitdb/dixitdb/trace/dixitdb_ora_29389.trc.

And we done, we were able to simulate the deadlock case in the database. Now lets dig into the trace file generated by the deadlock along with information flushed by 10027 trace event. It has all crucial information associated with the deadlock.

2023-02-16 04:13:34.115*:ksq.c@13192:ksqdld_hdr_dump():
DEADLOCK DETECTED ( ORA-00060 )
See Note 60.1 at My Oracle Support for Troubleshooting ORA-60 Errors

[Transaction Deadlock]


Deadlock graph:
                                          ------------Blocker(s)-----------  ------------Waiter(s)------------
Resource Name                             process session holds waits serial  process session holds waits serial
TX-00080009-00000C62-00000000-00000000         45     427     X        13193      24     440           X  22765
TX-0004001A-00000C1E-00000000-00000000         24     440     X        22765      45     427           X  13193


----- Information for waiting sessions -----
Session 427:
  sid: 427 ser: 13193 audsid: 3390369 user: 115/DIXDROID
    flags: (0x41) USR/- flags2: (0x40009) -/-/INC
    flags_idl: (0x1) status: BSY/-/-/- kill: -/-/-/-
  pid: 45 O/S info: user: oracle, term: UNKNOWN, ospid: 30174
    image: oracle@oracleontario.ontadomain (TNS V1-V3)
  client details:
    O/S info: user: oracle, term: pts/1, ospid: 30173
    machine: oracleontario.ontadomain program: sqlplus@oracleontario.ontadomain (TNS V1-V3)
    application name: SQL*Plus, hash value=3669949024
  current SQL:
  UPDATE TABLEA SET TOTAL_AMT = (SELECT SUM (AMT) FROM TABLEB WHERE FK_ID = :B1 ) WHERE PK_ID = :B1

Session 440:
  sid: 440 ser: 22765 audsid: 3380369 user: 115/DIXDROID
    flags: (0x41) USR/- flags2: (0x40009) -/-/INC
    flags_idl: (0x1) status: BSY/-/-/- kill: -/-/-/-
  pid: 24 O/S info: user: oracle, term: UNKNOWN, ospid: 29847
    image: oracle@oracleontario.ontadomain (TNS V1-V3)
  client details:
    O/S info: user: oracle, term: pts/2, ospid: 29846
    machine: oracleontario.ontadomain program: sqlplus@oracleontario.ontadomain (TNS V1-V3)
    application name: SQL*Plus, hash value=3669949024
  current SQL:
  delete tableB where pk_id = 1213

.....
.......


----- Current SQL Statement for this session (sql_id=duw5q5rpd5xvs) -----
UPDATE TABLEA SET TOTAL_AMT = (SELECT SUM (AMT) FROM TABLEB WHERE FK_ID = :B1 ) WHERE PK_ID = :B1
----- PL/SQL Call Stack -----
  object      line  object
  handle    number  name
0x8ed34c98        11  DIXDROID.TABLEB_ST_TRG
.......
.........


----- VKTM Time Drifts Circular Buffer -----
session 427: DID 0001-002D-000000D9     session 440: DID 0001-0018-0000001C
session 440: DID 0001-0018-0000001C     session 427: DID 0001-002D-000000D9

Rows waited on:
  Session 427: obj - rowid = 0001416A - AAAUFqAAHAAAMgvAAB
  (dictionary objn - 82282, file - 7, block - 51247, slot - 1)
  Session 440: obj - rowid = 0001416C - AAAUFsAAHAAAMg/AAE
  (dictionary objn - 82284, file - 7, block - 51263, slot - 4)
.....
.......


Current Wait Stack:
     0: waiting for 'enq: TX - row lock contention'
        name|mode=0x54580006, usn<<16 | slot=0x4001a, sequence=0xc1e
        wait_id=69 seq_num=70 snap_id=1
        wait times: snap=18.173838 sec, exc=18.173838 sec, total=18.173838 sec
        wait times: max=infinite, heur=18.173838 sec
        wait counts: calls=6 os=6
        in_wait=1 iflags=0x15a0
    There is at least one session blocking this session.
      Dumping 1 direct blocker(s):
        inst: 1, sid: 440, ser: 22765
      Dumping final blocker:
        inst: 1, sid: 440, ser: 22765
    There are 1 sessions blocked by this session.
    Dumping one waiter:
      inst: 1, sid: 440, ser: 22765
      wait event: 'enq: TX - row lock contention'
        p1: 'name|mode'=0x54580006
        p2: 'usn<<16 | slot'=0x80009
        p3: 'sequence'=0xc62
      row_wait_obj#: 82284, block#: 51263, row#: 4, file# 7
      min_blocked_time: 0 secs, waiter_cache_ver: 33942
    Wait State:
      fixed_waits=0 flags=0x22 boundary=(nil)/-1
    Session Wait History:
        elapsed time of 0.004677 sec since current wait
........
............


24: USER ospid 29847 sid 440 ser 22765, waiting for 'enq: TX - row lock contention'
          Cmd: DELETE
          Blocked by inst: 1, sid: 427, ser: 13193
          Final Blocker inst: 1, sid: 427, ser: 13193
.....
.............


45: USER ospid 30174 sid 427 ser 13193, waiting for 'enq: TX - row lock contention'
          Cmd: UPDATE
          Blocked by inst: 1, sid: 440, ser: 22765
          Final Blocker inst: 1, sid: 440, ser: 22765
.........
.............


 The history is displayed in reverse chronological order.

    sample interval: 1 sec, max history 120 sec
    ---------------------------------------------------
      [19 samples,                                         04:13:16 - 04:13:34]
        waited for 'enq: TX - row lock contention', seq_num: 70
          p1: 'name|mode'=0x54580006
          p2: 'usn<<16 | slot'=0x4001a
          p3: 'sequence'=0xc1e
      [14 samples,                                         04:13:01 - 04:13:15]
        idle wait at each sample
      [session created at: 04:13:01]
    ---------------------------------------------------
    Sampled Session History Summary:
      longest_non_idle_wait: 'enq: TX - row lock contention'
      [19 samples, 04:13:16 - 04:13:34]
    ---------------------------------------------------
.........
..........


      Virtual Thread:
      kgskvt: 0x9b0e7f10, sess: 0x9ccdd4b8, pdb: 0, sid: 427 ser: 13193
      vc: (nil), proc: 0x9db42028, idx: 427
      consumer group cur: OTHER_GROUPS (pdb 0) (upd? 0)
mapped: DEFAULT_CONSUMER_GROUP, orig:  (pdb 0)
      vt_state: 0x2, vt_flags: 0xE030, blkrun: 0, numa: 1
      inwait: 1, wait event: 307, posted_run: 0
      lastmodrngcnt: 0, lastmodrngcnt_loc: '(null)'
      lastmodrblcnt: 0, lastmodrblcnt_loc: '(null)'
      location where insched last set: kgskbwt
      location where insched last cleared: kgskbwt
      location where inwait last set: kgskbwt
      location where inwait last cleared: NULL
      is_assigned: 1, in_scheduler: 0, insched: 0
      vt_active: 0 (pending: 1)
      vt_pq_active: 0, dop: 0, pq_servers (cur: 0 cg: 0)
      ps_allocs: 0, pxstmts (act: 0, done: 0 cg: 0)
      used quanta (usecs):
      stmt: 57272, accum: 0, mapped: 0, tot: 57272
      exec start consumed time lapse: 164377 usec
      exec start elapsed time lapse: 18179246 usec
      idle time: 0 ms, active time: 57272 (cg: 57272) usec
      last updnumps: 0 usec, active time (pq: 0 ps: 0) ms
      cpu yields:       stmt: 0, accum: 0, mapped: 0, tot: 0
      cpu waits:       stmt: 0, accum: 0, mapped: 0, tot: 0
      cpu wait time (usec):       stmt: 0, accum: 0, mapped: 0, tot: 0
      ASL queued time outs: 0, time: 0 (cur 0, cg 0)
      PQQ queued time outs: 0, time: 0 (cur 0, cg 0)
      Queue timeout violation: 0
      calls aborted: 0, num est exec limit hit: 0
      KTU Session Commit Cache Dump for IDLs:
      KTU Session Commit Cache Dump for Non-IDLs:
      ----------------------------------------
........
.............

Hope It Helped!
Prashant Dixit

Posted in Uncategorized | Tagged: , , , | 2 Comments »

Here goes my first blog post on Real Application Testing on Oracle Blogging platform …

Posted by FatDBA on January 30, 2023

I’m excited to announce that I’ve authored my first blog post on Oracle’s multi-cloud observability and management platform.ย 
My post “Real Application Testing for Capture and Replay in a PDB, a great addition in 19c.” recently got published by Oracle Corporation on their blogging platform ๐Ÿ™‚ ๐Ÿ™‚ ๐Ÿ™‚ ๐Ÿ™‚

https://blogs.oracle.com/observability/post/real-application-testing-for-capture-and-replay-in-a-pdb-a-great-addition-was-made-in-19c

Hope It Helped!
Prashant Dixit

Posted in Advanced | Tagged: , , | Leave a Comment »