


Adaptive Log File Sync is not always good for you …
Posted by FatDBA on April 11, 2022
Last week I was part of one system/database stability short term assignment where customer running a critical Telco application on 2-Node RAC Cluster (RHEL) on 11.2.0.3.1 reported slowness in few of the critical data processing modules, which in turn had slowed down their entire system. Todays post is about buggy behavior of an adaptive feature which had caused a huge mess in the system in the form of ‘Log File Sync‘ waits.
After few of the initial calls with the customer, we come to know that the database has a history of high ‘log file sync‘ waits, but they simply come and go, and it seemed that the events were never handled correctly or being analyzed! And interestingly, restarting the cluster resolves the issue for few hours, sometimes for few days. LFS event was quite prominently seen in this database and on an average found consuming > 38% of the total DB Time% available with very high average wait times (248 ms).
Below are few of the database statistics captured from the problem time.


About the event, When a user session commits, all redo records generated by that session’s transaction need to be flushed from memory to the redo logfile to insure changes to the database made by that transaction become permanent. The time between the user session posting the LGWR and the LGWR posting the user after the write has completed is the wait time for ‘log file sync’ that the user session will show. This event is known as the time lost as a result of the LGWR process waiting while users initiate a Transaction Commit or Rollback.
Next in order to get more idea about the event, I ran the lfsdiag.sql (Oracle provided script to catch diag info on it – Doc ID 1064487.1)). The script will look at the important parameters involved in log file sync waits, wait histogram data, and at the worst average LFS times in the active session history data and AWR data and dump information to help determine why those times were the highest.
Below are the ASH LFS background process waits caught during its worst minute and it had some really bad stats captured for the worst minute for the same time when customer had worst application performance.
MINUTE          INST_ID EVENT                            TOTAL_WAIT_TIME      WAITS   AVG_TIME_WAITED
------------ ---------- ------------------------------ ----------------- ---------- -----------------
Apr06_1742            2 log file sync                        2819744.300       1973          1429.166
Apr06_1745            2 log file sync                        1219765.027       1200          1016.471
Apr06_1747            2 log file sync                        2045077.213       1745          1171.964
Apr06_1748            2 log file sync                        1417639.236       1170          1211.657
Apr06_1749            2 log file sync                        2202804.958       2190          1005.847
Apr06_1753            2 log file sync                        1967863.159       1871          1051.771
Apr06_1756            2 log file sync                        1096747.638        336          3264.130
Apr06_1843            2 log file sync                        1710602.016        531          3221.473
Apr06_1846            2 log file sync                         814607.205        247          3298.005
Another intersting section was the Histogram data for LFS and other related events. Here was can see the LFS waits at “wait_time_milli” and specially the high wait times to correlate them with other wait events. From below stats its evident that Node 2 of this RAC cluster was severely impacted with the LFS waits., with very high wait counts and wait times (ms), and lot of ‘gcs log flush sync’ along with LFS events that pushes LGWR process to write data to the disk.
The stats are very bad, with highest wait time of 1048576 ms on Node 2 and average of 99864 ms (1.6 mins), both ‘log file parallel write’ and ‘gcs log flush sync’ were quite high too.
   INST_ID EVENT                                    WAIT_TIME_MILLI WAIT_COUNT
---------- ---------------------------------------- --------------- ----------
         1 log file sync                                          1   76126281
         1 log file sync                                          2   31805429
         1 log file sync                                          4   18893320
         1 log file sync                                          8   29604071
         1 log file sync                                         16   21903517
         1 log file sync                                         32    7252292
         1 log file sync                                         64    3692615
         1 log file sync                                        128    1615552
         1 log file sync                                        256     262632
         1 log file sync                                        512      25341
         1 log file sync                                       1024       5431
         1 log file sync                                       2048        901
         1 log file sync                                       4096        188
         1 log file sync                                       8192        102
         1 log file sync                                      16384         33
         2 log file sync                                          1   56003954
         2 log file sync                                          2   19903760
         2 log file sync                                          4   12749437
         2 log file sync                                          8   17572031
         2 log file sync                                         16   12266342
         2 log file sync                                         32    3209853
         2 log file sync                                         64    1124852
         2 log file sync                                        128    2912977
         2 log file sync                                        256    5516739
         2 log file sync                                        512    3226632
         2 log file sync                                       1024     783055
         2 log file sync                                       2048     119096
         2 log file sync                                       4096      24974
         2 log file sync                                       8192       8841
         2 log file sync                                      16384       3782
         2 log file sync                                      32768       1640
         2 log file sync                                      65536        578
         2 log file sync                                     131072        259
         2 log file sync                                     262144         78
         2 log file sync                                     524288         22
         2 log file sync                                    1048576          4


         1 log file parallel write                                1  198650048
         1 log file parallel write                                2   16777612
         1 log file parallel write                                4    9934905
         1 log file parallel write                                8    4511957
         1 log file parallel write                               16     808734
         1 log file parallel write                               32     107699
         1 log file parallel write                               64      17255
         1 log file parallel write                              128       1837
         1 log file parallel write                              256        139
         1 log file parallel write                              512         24
         1 log file parallel write                             1024          2
         2 log file parallel write                                1  150805280
         2 log file parallel write                                2    9299589
         2 log file parallel write                                4    4816280
         2 log file parallel write                                8    3145522
         2 log file parallel write                               16     793765
         2 log file parallel write                               32     116312
         2 log file parallel write                               64      12469
         2 log file parallel write                              128       1298
         2 log file parallel write                              256        118
         2 log file parallel write                              512         14
         2 log file parallel write                             1024          1


         1 gcs log flush sync                                     1   85952301
         1 gcs log flush sync                                     2    8052174
         1 gcs log flush sync                                     4    4224838
         1 gcs log flush sync                                     8    4017059
         1 gcs log flush sync                                    16    1226469
         1 gcs log flush sync                                    32      88359
         1 gcs log flush sync                                    64       4263
         1 gcs log flush sync                                   128         90
         1 gcs log flush sync                                   256          1
         2 gcs log flush sync                                     1   60282021
         2 gcs log flush sync                                     2    5102517
         2 gcs log flush sync                                     4    1951187
         2 gcs log flush sync                                     8    2470197
         2 gcs log flush sync                                    16    1088285
         2 gcs log flush sync                                    32     214273
         2 gcs log flush sync                                    64      26585
         2 gcs log flush sync                                   128        147
As a possible solution, we tried few of the quick ones i.e. batching redo (commit_logging = batch) for the log writer (I know it has its own risks) to reduce LFS, but that didn’t worked either.
Next thing I’d generated the system state dump to understand the system and situation bettern, and the LFS events were caught in the system state dump as well with wait chains pointing to ‘rdbms ipc message'<=’log file sync’.
Process traces are always considered a wealth of diagnostic information, So I’d checked the LGWR process traces and thats where I saw some strangeness with frequent entries related with switching between post/wait and polling method which is an adaptive way to control switching between post/wait (older way) and polling (new method) for log file syncs. This gave me little hint about the possible reason on why so many LFS waits.
Talking about the adaptive log file sync, there are 2 methods by which LGWR and foreground processes can communicate in order to acknowledge that a commit has completed:
Post/wait: traditional method available in previous Oracle releases LGWR explicitly posts all processes waiting for the commit to complete. The advantage of the post/wait method is that sessions should find out almost immediately when the redo has been flushed to disk.
Polling: Foreground processes sleep and poll to see if the commit is complete, this was introduced to free high CPU usage by the LGWR.
This behavior is controlled by the parameter “_use_adaptive_log_file_sync” and was introduced in 11gR2 and controls whether adaptive switching between post/wait and polling is enabled. In 11.2.0.1 and 11.2.0.2 the default value for the parameter is false. From 11.2.0.3, the default value has been changed to true.

-- LGWR traces
WARNING:io_submit failed due to kernel limitations MAXAIO for process=128 pending aio=128
WARNING:asynch I/O kernel limits is set at AIO-MAX-NR=1048576 AIO-NR=169402
*** 2022-04-07 06:03:31.916
Warning: log write broadcast wait time 2612477ms (SCN 0xad1.f8c170fe)
*** 2022-04-07 06:03:31.916
Warning: log write broadcast wait time 2598008ms (SCN 0xad1.f8c21251)
kcrfw_update_adaptive_sync_mode: post->poll long#=33 sync#=202 sync=5963 poll=8730 rw=383 rw+=383 ack=3982 min_sleep=1135
*** 2022-04-07 07:46:20.018
Log file sync switching to polling --------------------->>>>>>> It shows current method is polling
Current scheduling delay is 1 usec
Current approximate redo synch write rate is 67 per sec
*** 2022-04-07 07:47:13.877
kcrfw_update_adaptive_sync_mode: poll->post current_sched_delay=0 switch_sched_delay=1 current_sync_count_delta=63 switch_sync_count_delta=202
*** 2022-04-07 07:47:13.877
Log file sync switching to post/wait ------------------>>>>>>>> It shows current method is post/wait
Current approximate redo synch write rate is 21 per sec
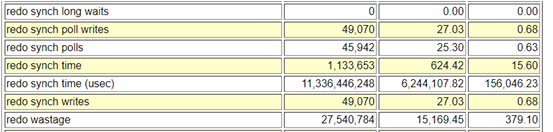
-- Below stats shows that the POLLING is happening on the database for LGWR wrtes
SQL> select name,value from v$sysstat where name in ('redo synch poll writes','redo synch polls');
NAME VALUE
---------------------------------------------------------------- ----------
redo synch poll writes 10500129
redo synch polls 10773618
As there were no other symptoms of issues with I/O or in other areas, the problem could be with excessive switching between post/wait and polling wait methods.
After consulting with Oracle support, we found the issue was happening due to BUG (25178179) and the issue gets severe when only while using log file sync “polling mode“. To prevent the problem from happening, they suggested us to turn off the _use_adaptive_log_file_sync by setting it to FALSE in either in the spfile and restarting the database or dynamically in memory.
This will force the log file sync waits to use (the traditional) “post/wait mode” rather than the automatically switching between “post/wait mode” and “polling mode” based on performance statistics. Changing the said parameter to FALSE disabled adaptive LFS in the database and that resolved the issue and system performance was restored.
-- Set the parameter _use_adaptive_log_file_sync = false and restart the database:
SQL> ALTER SYSTEM SET "_use_adaptive_log_file_sync" = FALSE;

-- In cases where a restart is not feasible, then you can set in memory and also in the SP file for when a restart does occur:
SQL> ALTER SYSTEM SET "_use_adaptive_log_file_sync"=FALSE; -- to set in memory and spfile as by default scope=both
SQL> ALTER SYSTEM SET "_use_adaptive_log_file_sync"=FALSE scope=sfile sid='*'; -- to set on spfile, so parameter is used at next restart.
Though In the vast majority of cases adaptive log file sync improves the overall performance of log file synchronization, but there are few bugs associated with this feature i.e. 13707904, 13074706 and 25178179.
Hope It Helped!
Prashant Dixit

shadab said
even i had tweak this parameter to false on 11.2.0.3 and reaped the benefits. After setting the parameter to false performance improved many fold.