Tales From A Lazy Fat DBA

Its all about Databases, their performance, troubleshooting & much more …. ¯\_(ツ)_/¯

Archive for the ‘Advanced’ Category

Advance/Troubleshooting/Error-Bug Fixing

ORA-24777: use of non-migratable database link not allowed

Posted by FatDBA on November 27, 2021

Hi gUYS,

Recently I was contacted by someone to take a look at an application problem where they caught few ORA errors in their logs, received “ORA-24777: use of non-migratable database link not allowed” which was for one of their important DBLink. They were using WebLogic as an application server and 19c as Oracle DB Version!
Okay, talking about the issue, this usually happens due to a session using shared connection (XA) using DBLink with dedicated connection. About fixing this problem, there are few ways how you can fix this issue i.e. setting dispatchers, Change or server on tnsnames.ora to SHARED etc., but would like to discuss two of the other methods that I tried to fix the problem.

First Solution:

  1. Open your Weblogic Server Admin Console and click on Services -> Data Sources -> {Choose the datasource you are using in your DB adapter} -> Connection Pool
  2. Change Driver ClassName from oracle.jdbc.xa.client.OracleXADataSource to oracle.jdbc.OracleDriver

Second Solution:
Sometimes, you don’t want to set the system wide change in your WebLogic by changing the driver class name, you can alter your DBLink and make it a SHARED DBLink. Shared database links purpose is to curb down the number of connections to the remote database by sharing same connection link between the source and the remote by multiple users sessions.

-- This was the previous DDL of the DBLink
CREATE DATABASE LINK test_dblink 
   CONNECT TO testuser IDENTIFIED BY mypassword
   USING '(DESCRIPTION=
            (ADDRESS=(PROTOCOL=TCP)(HOST=monkeyserver.ontadomain.com)(PORT=1524))
            (CONNECT_DATA=(SERVICE_NAME=TESTDB1))
          )';


-- This is what I have altered it to to make it SHARED DBLink and worked for me.
CREATE SHARED DATABASE LINK test_dblink 
   CONNECT TO testuser IDENTIFIED BY mypassword
   USING '(DESCRIPTION=
            (ADDRESS=(PROTOCOL=TCP)(HOST=monkeyserver.ontadomain.com)(PORT=1524))
            (CONNECT_DATA=(SERVICE_NAME=TESTDB1))
          )';

Hope It Helped!
Prashant Dixit

Posted in Advanced, troubleshooting | Tagged: , | Leave a Comment »

Materialized Views Refresh slow ? This is what you can try …

Posted by FatDBA on November 22, 2021

Hi All,

Entire last week I was looking in to one system wide performance issue where customer reported slowness in their database since they’d moved into a new infrastructure, after data migration. Though this wasn’t the production system, but kind of equally important, and the issue was impacting their acceptance tests. I was updated that few of the Materialized Views are there and their refresh times are now extended by a great margin, since they moved to this new system.

As soon I got the access on their system, I did a quick check on the database and I found a huge list of MV refresh jobs are scheduled and almost all of them are running with a huge delay, the performance was not at all consistent, sometimes they gets refreshed within few minutes and another run goes for few hours. This initially sounded little bizarre to me, until I did a comparive stuy between the previous (fast) and the new (slow) databases. What I observed is that there is more than 500% of extra data there in the business tables in this new (slow) database and with such a huge data, all those complex MV refresh queries ultimately got slowed down here in the new system.

For an example, one of the critical MV taking ~ 200 mins to refresh an is created with COMPLETE REFRESH mode.

create MATERIALIZED VIEW MV_MYTEST_BIGREFRESH
BUILD DEFERRED
REFRESH ON DEMAND
COMPLETE
AS
select abc,xyz,cast(value as ajaaj) as test ....
............
.................


SELECT * 
FROM ( SELECT OWNER, 
              MVIEW_NAME, 
              CONTAINER_NAME, 
              REFRESH_MODE, 
              LAST_REFRESH_TYPE, 
              STALENESS, 
              round((LAST_REFRESH_END_TIME-LAST_REFRESH_DATE)*24*60,2) as REFRESH_TIME_MINS 
       FROM ALL_MVIEWS 
       WHERE LAST_REFRESH_TYPE IN ('FAST','COMPLETE')
     ) 
ORDER BY REFRESH_TIME_MINS DESC;
 
OWNER   MVIEW_NAME                       CONTAINER_NAME                   REFRESH_MODE LAST_REFRESH_TYPE STALENESS           REFRESH_TIME_MINS
------- -------------------------------- -------------------------------- ------------ ----------------- -------------------------------------
PRASH   MV_MYTEST_BIGREFRESH             MV_MYTEST_BIGREFRESH             DEMAND        COMPLETE      COMPLETE                196.75

Though I did multiple optimizations in order to stabilize performance, but would like to talk about few of the refresh tuning techniques that I have applied and finally worked for me.

Atomic_Refresh with value FALSE.
What caught my eye are all those long running DELETE statements running underneath those costly MV refresh jobs. This was the very first thing I tried with those complex and long running COMPLETE MV refresh, this is the optional parameter atomic_refresh of the procedure dbms_mview.refresh and is very useful. If the parameter is set to FALSE, the materialized view is deleted with a much faster TRUNCATE command. I immediately got the gain, as the runtime was dropped ~ 60% .. At the same time I have observed a great relax in redo generation as DELETE is replaced with TRUNCATE, and hence a great drop in ‘checkpoint incomplete‘ and ‘Log File Sync‘ waits.

The parameter atomic_refresh=FALSE works only with “complete” refresh, so “truncate” is only possible with “complete“. But there is one demerit too for this method, and is that no data is visible to the users during the refresh, so, choose wisely. If this is feasible in your environment, you can use the following command for a Complete Refresh:

BEGIN
dbms_mview.refresh(‘MV_MYTEST_BIGREFRESH_JOB’, method => ‘C’, atomic_refresh => FALSE);
END;


-- See below the REFRESH_TIME_MINS got dropped by ~ 60% after using setting atomic_refres = false
SELECT * 
FROM ( SELECT OWNER, 
              MVIEW_NAME, 
              CONTAINER_NAME, 
              REFRESH_MODE, 
              LAST_REFRESH_TYPE, 
              STALENESS, 
              round((LAST_REFRESH_END_TIME-LAST_REFRESH_DATE)*24*60,2) as REFRESH_TIME_MINS 
       FROM ALL_MVIEWS 
       WHERE LAST_REFRESH_TYPE IN ('FAST','COMPLETE')
     ) 
ORDER BY REFRESH_TIME_MINS DESC;
 
OWNER   MVIEW_NAME                       CONTAINER_NAME                   REFRESH_MODE LAST_REFRESH_TYPE STALENESS           REFRESH_TIME_MINS
------- -------------------------------- -------------------------------- ------------ ----------------- -------------------------------------
PRASH   MV_MYTEST_BIGREFRESH             MV_MYTEST_BIGREFRESH             DEMAND        COMPLETE      COMPLETE                79.12

Adding PX (Parallelism) to the base tables or to the refresh command itself.
Though with atomic_refrsh FALSE, I was able to cut down a great percentage of the overall elapsed time, but still customer asked for me, maybe some 30% more …
I decided to try PX to the base tables or to the refresh statement, among other parameters, this procedure takes one parameter PARALLELISM. At the outset, it appears that the PARALLELISM parameter should invoke a parallel refresh of the materialized view. However, it does not; it simply changes the requested degree of parallelism if it already executes in parallel. You can invoke this procedure as:

BEGIN
dbms_mview.refresh(‘MV_MYTEST_BIGREFRESH_JOB’, method => ‘C’, atomic_refresh => FALSE, PARALLELISM=>4); 
END;


-- See below the REFRESH_TIME_MINS got dropped by further ~30% after using PARALLELISM to the master/base MV tables.
SELECT * 
FROM ( SELECT OWNER, 
              MVIEW_NAME, 
              CONTAINER_NAME, 
              REFRESH_MODE, 
              LAST_REFRESH_TYPE, 
              STALENESS, 
              round((LAST_REFRESH_END_TIME-LAST_REFRESH_DATE)*24*60,2) as REFRESH_TIME_MINS 
       FROM ALL_MVIEWS 
       WHERE LAST_REFRESH_TYPE IN ('FAST','COMPLETE')
     ) 
ORDER BY REFRESH_TIME_MINS DESC;
 
OWNER   MVIEW_NAME                       CONTAINER_NAME                   REFRESH_MODE LAST_REFRESH_TYPE STALENESS           REFRESH_TIME_MINS
------- -------------------------------- -------------------------------- ------------ ----------------- -------------------------------------
PRASH   MV_MYTEST_BIGREFRESH             MV_MYTEST_BIGREFRESH             DEMAND        COMPLETE      COMPLETE                 55.08
  

You can also add PX to the base tables. When the master table of the materialized view has the PARALLEL attribute set to > 1, then the creation as well as the refresh processes will be parallelized. Whether or not you specify the PARALLELISM parameter in the REFRESH clause, doesn’t matter.

ALTER TABLE DIXIT_TEST_TABLE PARALLEL (DEGREE 4);

You can also add PX hint to the MV definition too! When the materialized view is created with a PARALLEL hint, then the creation as well as the refresh processes, will be parallelized. Whether or not you specify the PARALLELISM parameter in the REFRESH clause, doesn’t matter.
This is how you can ad a parallel hint in the materialized view definition!

CREATE MATERIALIZED VIEW TEST_MV
AS
SELECT /*+ PARALLEL(DIXIT_TEST_TABLE, 4) */ MONTHLY_ID, SALARY_DATE, SUM(ANNUAL_COUNTS)
FROM DIXIT_TEST_TABLE GROUP BY MONTHLY_ID, SALARY_DATE;

Stats Collection:
This is very vital that all of the tables, Indexes which your MV refresh references via the code, should be fresh and well collected. Look of for possibilities to add column level stats i.e Histograms wherever there is a scope, specially for low cardinality columns. You can also leave this to the optimizer to decide, by using METHOD_OPT=>’FOR ALL COLUMNS SIZE AUTO’

Other techniques:

  • Try for FAST/Incremental Refresh mode. With FAST refresh, only the changes since the last refresh are applied to the materialized view. Personally I have found the FAST refresh slower than the COMPLETE refresh mode, maybe because I used atomic_refresh parameter that replaced those costly DELETEs with fast TRUNCATE … Not sure why they called it FAST 🙂 To be sure that my materialized view can be fast refresh, we can also use explain_mview procedure and check the capability_name called “REFRESH_FAST”. The MV_CAPABILITIES TABLE is created in the owner’s schema by running the following script ..
SQL> @$ORACLE_HOME/rdbms/admin/utlxmv.sql

SQL> exec dbms_mview.explain_mview('MV_MYTEST_BIGREFRESH_JOB');
PL/SQL procedure successfully completed.
 
SQL> select capability_name,possible,related_text,msgtxt from mv_capabilities_table;

CAPABILITY_NAME                POSSIBLE             RELATED_TEXT            MSGTXT
------------------------------ -------------------- ----------------------- ----------------------------------------------------------------------------
PCT                            N
REFRESH_COMPLETE               Y
REFRESH_FAST                   Y <<<<<<<<---------------
REWRITE                        Y
PCT_TABLE                      N                    ID_ID_CANADA_HISTORY_T1 relation is not a partitioned table
PCT_TABLE                      N                    ID_ID_CANADA_HISTORY_TV relation is not a partitioned table
PCT_TABLE                      N                    DWH_SITE                relation is not a partitioned table
REFRESH_FAST_AFTER_INSERT      Y
REFRESH_FAST_AFTER_ONETAB_DML  Y
REFRESH_FAST_AFTER_ANY_DML     Y
REFRESH_FAST_PCT               N                                            PCT is not possible on any of the detail tables in the materialized view
REWRITE_FULL_TEXT_MATCH        Y
REWRITE_PARTIAL_TEXT_MATCH     Y
REWRITE_GENERAL                Y
REWRITE_PCT                    N                                            general rewrite is not possible or PCT is not possible on any of the detail tables
PCT_TABLE_REWRITE              N                    ID_ID_CANADA_HISTORY_T1 relation is not a partitioned table
PCT_TABLE_REWRITE              N                    ID_ID_CANADA_HISTORY_TV relation is not a partitioned table
PCT_TABLE_REWRITE              N                    DWH_SITE                relation is not a partitioned table
 
18 rows selected.
  • Out-of-place refresh is a new option on DBMS_MVIEW. REFRESH in Oracle 12c. The complete refresh process builds a new table which seamlessly becomes the materialized view, the old table is dropped. It only works in conjunction with non-atomic refresh.
  • DBMS_ADVISOR contains a procedure called TUNE_MVIEW that is used when working with the query rewrite mechanism. DBMS_MVIEW.EXPLAIN_MVIEW and DBMS_MVIEW.EXPLAIN_REWRITE that could be used to diagnose why a materialized view wasn’t being used for query rewrite. The DBMS_ADVISOR.TUNE_MVIEW procedure has the capability to add additional aggregate columns and materialized view logs to the view definition so that it becomes fast refreshable.

Well, all after I’ve performed above three methods, I was able to reduce the MV refresh downtimes by more than 92% … 🙂

Hope It Helped!
Prashant Dixit

Posted in Advanced, troubleshooting | Tagged: , , , | 2 Comments »

Confused about using PURGE_ALL to remove optimizer statistics from the SYSAUX ?

Posted by FatDBA on November 7, 2021

Hi All,

Recently while working in one for the project where SYSAUX was growing at an alarming rate, customer operations team decided to purge old stats from the SYSAUX as that was occupying around 50% of the total occupancies. Though MMON purges these stats regularly from the OPTSTAT tables, but due to a known bug (14373728) it failed to that. I mean ideally it should purge these statistics according to the default retention, which is 30 days in this case, but it seem it can not due to that bug. MMON performs these purge activities automatically, but it has a limit of 5 minutes to perform these activities. So if the purging takes more than 5 mins, then the activities are aborted and as a result the stats are not purged.

Due to some reasons they don’t want to apply the patch, but agreed to purge all stats from the OPTSTAT related tables within SYSAUX. But, the team was very perplexed to perform the PURGE_ALL as a big-bang (not using sysdate-x) approach, as they weren’t sure if PURGE_ALL will remove all the stats including current statistics on objects (Tables, Indexes etc.) or it only touches OPTSTAT tables and truncates them.

About optimizer stats tables (OPTSTAT in short), they contain backup information about stats collection and involves tables like WRI$_OPTSTAT_OPR, WRI$_OPTSTAT_AUX_HISTORY, WRI$_OPTSTAT_TAB_HISTORY, WRI$_OPTSTAT_IND_HISTORY, WRI$_OPTSTAT_HISTGRM_HISTORY, WRI$_OPTSTAT_HISTHEAD_HISTORY.

Even the comments from Oracle customer support has raised the confusion, as their explanation was too hazy and with lot of muddiness about using EXEC DBMS_STATS.PURGE_STATS(DBMS_STATS.PURGE_ALL). So, I decided to do a quick demo to clear all the doubts around this subject.

All below mentioned tests were performed on Oracle 21c database.

-- Here I first created a sample table and generated 10000 random rows. 
[oracle@fatdba ~]$ sqlplus / as sysdba

SQL*Plus: Release 21.0.0.0.0 - Production on Wed Nov 3 23:53:14 2021
Version 21.3.0.0.0


SQL> CREATE TABLE tab1 AS
SELECT level AS id,
       CASE
         WHEN MOD(level, 2) = 0 THEN 0
         ELSE TRUNC(DBMS_RANDOM.value(1,10))
       END AS record_type,
       'Description for ' || level AS description
FROM   dual
CONNECT BY level <= 10000;

Table created.


SQL> select count(*) from tab1;

  COUNT(*)
----------
     10000


SQL> ALTER TABLE tab1 ADD CONSTRAINT tab1_pk PRIMARY KEY (id);

Table altered.


SQL> CREATE INDEX tab1_record_type_idx ON tab1(record_type);

Index created.

SQL> EXEC DBMS_STATS.gather_table_stats(USER, 'TAB1');

PL/SQL procedure successfully completed.


SQL> EXEC DBMS_STATS.gather_index_stats(USER, 'TAB1_RECORD_TYPE_IDX');

PL/SQL procedure successfully completed.

Okay, so we have a table ready with 10000 random rows with a primary key constraint and have created one index on record_type column and have gathered stats on the table and the index. Next, I will purge all stats from OPTSTAT tables using PURGE_ALL function

23:13:05 SQL> EXEC DBMS_STATS.PURGE_STATS(DBMS_STATS.PURGE_ALL);

PL/SQL procedure successfully completed.

Elapsed: 00:00:01.13
23:13:09 SQL>


-- Now the same can be confirmed by querying OPTSTAT tables WRI$_OPTSTAT_IND_HISTORY and  WRI$_OPTSTAT_TAB_HISTORY for Tables and Indexes, 
-- And they all are gone, no more data is there in these tables after flush.

23:15:55 SQL> select OBJ#, flags, rowcnt, ANALYZETIME from WRI$_OPTSTAT_IND_HISTORY where obj#=77267;

no rows selected

23:16:01 SQL> select FLAGS,ROWCNT, OBJ#,ANALYZETIME from WRI$_OPTSTAT_TAB_HISTORY where obj#=77256;

no rows selected

Now, lets check if tables and index has the stats collection date coming or not, and yes they are there! means still the table has their current stats and didn’t got purged after we executed PURGE_ALL on OPTSTAT tables.

23:13:37 SQL> select index_name, index_type, last_analyzed from dba_indexes where index_name='TAB1_RECORD_TYPE_IDX';

INDEX_NAME                     INDEX_TYPE                  LAST_ANALYZED
------------------------------ --------------------------- --------------------
TAB1_RECORD_TYPE_IDX           NORMAL                      03-NOV-2021 23:12:07

Elapsed: 00:00:00.00

23:13:50 SQL> select table_name, last_analyzed from dba_tables where table_name='TAB1';

TABLE_NAME           LAST_ANALYZED
-------------------- --------------------
TAB1                 03-NOV-2021 23:08:32

Elapsed: 00:00:00.00

I am now going to recollect stats on both of them, Tables and its Index, and with that, the last_analyzed date/time is refreshed with the latest timestamp.

repeating same steps for TABLE. And one more time, I see that the TABLE HISTORY related OPTSTAT table has only previous/historical values not the latest timestamp from stats collection.
I mean it should should have ’03-NOV-2021 23:26:07′ as a latest entry in the table, but has only got ’03-NOV-2021 23:17:28′ when last stats were collected.

23:25:54 SQL> EXEC DBMS_STATS.gather_table_stats(USER, 'TAB1');

PL/SQL procedure successfully completed.


23:26:15 SQL> select table_name, last_analyzed from dba_tables where table_name='TAB1';

TABLE_NAME           LAST_ANALYZED
-------------------- --------------------
TAB1                 03-NOV-2021 23:26:07


23:26:08 SQL> select FLAGS,ROWCNT, OBJ#,ANALYZETIME from WRI$_OPTSTAT_TAB_HISTORY where obj#=77256;

     FLAGS     ROWCNT       OBJ# ANALYZETIME
---------- ---------- ---------- --------------------
        10      10000      77256 03-NOV-2021 23:08:32
        10      10000      77256 03-NOV-2021 23:17:28 ----> previous value, not the latest timestamp of 03-NOV-2021 23:26:07


-- One more time, for Table ....

23:29:05 SQL> EXEC DBMS_STATS.gather_table_stats(USER, 'TAB1');

PL/SQL procedure successfully completed.


23:29:11 SQL> 23:29:11 SQL>  select table_name, last_analyzed from dba_tables where table_name='TAB1';


TABLE_NAME           LAST_ANALYZED
-------------------- --------------------
TAB1                 03-NOV-2021 23:29:07


23:29:07 SQL> select FLAGS,ROWCNT, OBJ#,ANALYZETIME from WRI$_OPTSTAT_TAB_HISTORY where obj#=77256;


     FLAGS     ROWCNT       OBJ# ANALYZETIME
---------- ---------- ---------- --------------------
        10      10000      77256 03-NOV-2021 23:08:32
        10      10000      77256 03-NOV-2021 23:17:28
        10      10000      77256 03-NOV-2021 23:26:07 ----> previous value, not the latest timestamp of 03-NOV-2021 23:29:0

Let’s do this on Indexes!

23:32:26 SQL> EXEC DBMS_STATS.gather_index_stats(USER, 'TAB1_RECORD_TYPE_IDX');

PL/SQL procedure successfully completed.

23:32:34 SQL> select index_name, index_type, last_analyzed from dba_indexes where index_name='TAB1_RECORD_TYPE_IDX';

INDEX_NAME                     INDEX_TYPE                  LAST_ANALYZED
------------------------------ --------------------------- --------------------
TAB1_RECORD_TYPE_IDX           NORMAL                      03-NOV-2021 23:32:27


23:32:33 SQL> select OBJ#, flags, rowcnt, ANALYZETIME from WRI$_OPTSTAT_IND_HISTORY where obj#=77267;

      OBJ#      FLAGS     ROWCNT ANALYZETIME
---------- ---------- ---------- --------------------
     77267         10      10000 03-NOV-2021 23:12:07
     77267         10      10000 03-NOV-2021 23:31:37 ---> Has only got '03-NOV-2021 23:31:37' which is a previous timestamp/history, not the latest of 03-NOV-2021 23:32:27

So, from above tests it’s clear that the PURGE_ALL only touches and truncates WRI$_OPTSTAT_XXXX tables and as they always have the previous stats collection details, your present stats on objects will always be there, untouched and safe. So, this command is very safe to run and is best when you are thinking of doing an iterative purge using SYSDATE-X as it’s always very slow as compared to PURGE_ALL which truncates the table and doesn’t delete records from it, and the reason of its agility.

Hope It Helped!
Prashant Dixit

Posted in Advanced, troubleshooting | Tagged: , , | Leave a Comment »

DDL stalled Golden Gate replicat : A quick damage control !

Posted by FatDBA on October 31, 2021

Hi Everyone,

Recently I was asked to check a mono-directional Integrated Golden Gate (Version 12.3.0.1.2) replication problem where the replicat was not processing the data and got struck with a huge lag of ~ 3.5 hours. Customer reported that the GG stuck due to CREATE INDEX statements running from last 3 hours and want to skip those transactions.

This being an ad-hoc request, I didn’t had any direct access to their systems and can only ask for files or outputs from their operations team. And as per reports shared, yes, there was a delay of around 3.5 hours for the replicat and was showing in RUNNING state.

-- Process stats on the target
GGSCI (cana01db66664b.prod.sdt.monkey12.se) 1> info all
Program     Status      Group       Lag at Chkpt  Time Since Chkpt
MANAGER     RUNNING
REPLICAT    RUNNING     TORONTO       03:29:11      00:00:03


-- From replicat parameter file
--DDL Options Used --
DDL INCLUDE MAPPED OBJNAME PDIXIT.*
DDLERROR DEFAULT IGNORE
DDLERROR 942 IGNORE
DDLERROR 955 IGNORE
DDLERROR 1435 IGNORE INCLUDE OPTYPE ALTER OBJTYPE SESSION
DDLERROR 904 IGNORE
DDLERROR 1430 IGNORE

While I was examining their parameter file saw they’re using BATCHSQL and HANDLECOLLISIONS to improve performance. Updated them that the use of the HANDLECOLLISIONS parameter can also cause performance issues if there are collisions since there needs to be additional processing done with those records. Hence, It is recommended to remove this parameter, if you are “not doing your initial load” for your tables. Most of transactions are happening in normal mode, hence, asked them to remove BATCHSQL parameter too.

Next, I asked them to try with DDLOPTIONS REPORT to be set in the parameter file, as this settings causes Integrated Extract to write a step-by-step history of all DDL operations captured to it’s report file; which is very useful when troubleshooting DDL replication issues. After they made a change to the parameter file and a bounce of replicat, I checked the logs, and per logs, below DDL was already executed

--> 2021-10-20 08:19:30 INFO OGG-00489 DDL is of mapped scope, after mapping new operation [create index "PDIXIT"."IDX_TEST121" on "PDIXIT"."TAB12"(C1666600563,C737666607) (size 82)]. 

However , DDL error ignored due to ORA-04021 and as they have DDLERROR ignore parameters in parameter file.

--> 2021-10-20 08:34:32 INFO OGG-00492 DDL error ignored: error code [DEFAULT], filter [include all (default)], error text [Error code [4021], ORA-04021: timeout occurred while waiting to lock object PDIXIT.IDX_TEST121 SQL create index "PDIXIT"."IDX_TEST121" on "PDIXIT"."TAB12"(C1666600563,C737666607) /* GOLDENGATE_DDL_REPLICATION */].

Asked them to check whether the index “PDIXIT”.”IDX_TEST121″ has been created on the target. If not then they may manually need to create this index on the target, but as per them, the index statement can be ignored and they only want to move the GG further, as their entire processing system was stopped and caused a massive delay.

Sid,Ser#      USERNAME      STATUS          SQL_ID          SQL_CHILD_NUMBER SQL_HASH_VALUE Logon Time    OSUser@Machine         pid   
TERMINAL PROGRAM                            MODULE
------------- ------------- --------------- --------------- ---------------- -------------- ------------- -------------------- ------- 
-------- ----------------------------------- -----------------------------------
6781,54621    GGGTEST       ACTIVE          u52csv8kcnb34                  0      617229321 23-AUG 06:55  oracle@cana01db66664 33329  r
eplicat@cana01db66664b.prod.sdt.er OGG-RCITSA00-CANA_DAIS_GREATC
                                                                                                          b.prod.sdt.monkey12.
                                                                                                          se

SQL> select sql_fulltext from gv$sql where sql_id='u52csv8kcnb34';


SQL_FULLTEXT
--------------------------------------------------------------------------------
create index "PDIXIT"."IDX_TEST121" on "PDIXIT"."TAB12"(C1666600563,C737666607
)  /* GOLDENGATE_DDL_REPLICATION */

create index "PDIXIT"."IDX_TEST121" on "PDIXIT"."TAB12"(C1666600563,C737666607
)  /* GOLDENGATE_DDL_REPLICATION */


                                    Locking                                                         Object                 Object            Lock
 SID     SER# STATUS                  User               Os user              Os Proc               Owner                   Name             Mode
------ ------ --------------- -------------------- -------------------- -------------------- -------------------- ------------------------- ----------
  6781  54621 ACTIVE          GGGTEST              oracle               33329                SYS                  OBJ$                    Row-X (SX)
  6781  54621 ACTIVE          GGGTEST              oracle               33329                PDIXIT               TAB12                   Share
 

I immediately asked them to kill those database session which was running above DDLs, and the lock issue got resolved the moment they killed them the lag was drained in few seconds. Next we added below parameter in to the replicat to exclude CREATE INDEX statements.

DDL INCLUDE MAPPED OBJNAME PDIXIT.* exclude INSTR 'CREATE INDEX' 

Customer also wanted to remove few of the rebuild online index DDLs, since those are taking too much time and causing lag in replicat, so we tried one more parameter to exclude INDEX REBUILD ONLINE operations from the specific user to happen on the target

DDL INCLUDE MAPPED OBJNAME PDIXIT.* exclude optype alter objtype 'INDEX' instr 'rebuild online'

And told them to remove added parameters to IGNORE DDLs and revert back to original once lag is zero and go back to original parameter of

DDL INCLUDE MAPPED OBJNAME PDIXIT.*

So, that’s how we fixed the issue and the flow we adopted to handle the situation.

Hope It Helped!
Prashant Dixit

Posted in Advanced, troubleshooting | Tagged: , , | 4 Comments »

pg_cron : Probably the best way to schedule jobs within PostgreSQL database.

Posted by FatDBA on July 30, 2021

Hi Guys,

Many of databases like Oracle (DBMS_SCHEDULER), MySQL (event_scheduler), Micrsoft SQL Server (SQL Server Agent) have their own build-in job/command scheduling mechanisms, PostgreSQL still does’t have any native or in-build scheduling methods like those databases. There are few popular extensions like pg_cron, pgAgent etc. which can be used to get the scheduling functionality in your PostgreSQL database.

This post will be all about installing, configuring and doing some tests using pg_cron extension and see what all it has to offer. pg_cron which is a simple cron-based job scheduler for PostgreSQL ( >= 9.5) that runs inside the database as an extension. It uses the same grammatical arrangement as regular cron, but it allows you to schedule PostgreSQL commands directly. You can schedule your SQL Statements, stored procedures and tasks like VACUUM, VACUUM ANALYZE

Though there are few limitations with the approach

  • You can’t use pg_cron jobs to schedule a job in seconds interval. For example, you can’t schedule a cron job to run every 10 seconds. For such scenarios, it’s better to write a shell script that uses the sleep command. Still a good option to try!
  • pg_cron can run multiple jobs in parallel, but it runs at most one instance of a job at a time. If a second run is supposed to start before the first one finishes, then the second run is queued and started as soon as the first run completes.

but still a best bet …

Okay, let’s start with the installation. I am using YUM to install the package. I am doing this test on Open Source PostgreSQL 12.6.7

[root@canttowin ~]# yum install pg_cron_12.x86_64
Loaded plugins: langpacks, ulninfo

Resolving Dependencies
--> Running transaction check
---> Package pg_cron_12.x86_64 0:1.3.1-1.rhel7 will be installed
--> Finished Dependency Resolution

Dependencies Resolved

=============================================================================================================================================================
 Package                               Arch                              Version                                     Repository                         Size
=============================================================================================================================================================
Installing:
 pg_cron_12                            x86_64                            1.3.1-1.rhel7                               pgdg12                             90 k

Transaction Summary
=============================================================================================================================================================
Install  1 Package

Total download size: 90 k
Installed size: 178 k
Is this ok [y/d/N]: y
Downloading packages:
pg_cron_12-1.3.1-1.rhel7.x86_64.rpm                                                                                                   |  90 kB  00:00:02
Running transaction check
Running transaction test
Transaction test succeeded
Running transaction
  Installing : pg_cron_12-1.3.1-1.rhel7.x86_64                                                                                                           1/1
  Verifying  : pg_cron_12-1.3.1-1.rhel7.x86_64                                                                                                           1/1

Installed:
  pg_cron_12.x86_64 0:1.3.1-1.rhel7

Complete!
You have new mail in /var/spool/mail/root
[root@canttowin ~]#

Next, I will be modifying the parameter ‘shared_preload_libraries‘ within postgresql.conf parameter file which is to specifies one or more shared libraries to be preloaded at server start. Will do a database reboot after that to make changes persistent.

[postgres@canttowin data]$
[postgres@canttowin data]$ more postgresql.conf |grep shared
#shared_preload_libraries = ''  # (change requires restart)


[postgres@canttowin data]$
[postgres@canttowin data]$ more postgresql.conf |grep shared
shared_preload_libraries = 'pg_cron'    # (change requires restart)


[postgres@canttowin bin]$
[postgres@canttowin bin]$ ./pg_ctl -D /var/lib/pgsql/12/data/ stop
waiting for server to shut down.... done
server stopped
[postgres@canttowin bin]$ ./pg_ctl -D /var/lib/pgsql/12/data/ start
waiting for server to start....2021-07-24 11:14:00.948 EDT [14074] LOG:  starting PostgreSQL 12.6 on x86_64-pc-linux-gnu, compiled by gcc (GCC) 4.8.5 20150623 (Red Hat 4.8.5-44), 64-bit
2021-07-24 11:14:00.948 EDT [14074] LOG:  listening on IPv4 address "0.0.0.0", port 5432
2021-07-24 11:14:00.948 EDT [14074] LOG:  listening on IPv6 address "::", port 5432
2021-07-24 11:14:00.966 EDT [14074] LOG:  listening on Unix socket "/var/run/postgresql/.s.PGSQL.5432"
2021-07-24 11:14:00.982 EDT [14074] LOG:  listening on Unix socket "/tmp/.s.PGSQL.5432"
2021-07-24 11:14:01.020 EDT [14074] LOG:  redirecting log output to logging collector process
2021-07-24 11:14:01.020 EDT [14074] HINT:  Future log output will appear in directory "log".
 done
server started
[postgres@canttowin bin]$

Next, if you want to use any specific database to create the extension, you have to an additional entry to configuration file with cron.database_name= ‘name of the database’

Now, you will see one more background process ‘pg_cron launcher‘ comes in to existence and can be seen running on the system.

Alright, all set. Now will create the extension on the database and will do some tests.

[postgres@canttowin bin]$
[postgres@canttowin bin]$ psql -p 5432
psql (12.6.7)
Type "help" for help.

postgres=# \conninfo
You are connected to database "postgres" as user "postgres" via socket in "/tmp" at port "5432".
postgres=#
postgres=#
postgres=#
postgres=# CREATE EXTENSION pg_cron;
CREATE EXTENSION
postgres=#
postgres=#
postgres=# GRANT USAGE ON SCHEMA cron TO postgres;
GRANT
postgres=#


-- How to check job lists.
postgres=# SELECT * FROM cron.job;
 jobid | schedule | command | nodename | nodeport | database | username | active | jobname
-------+----------+---------+----------+----------+----------+----------+--------+---------
(0 rows)

-- To schedule a VACUUM ANALYZE on each day at 11:00 AM
postgres=# SELECT cron.schedule('0 11 * * *', 'VACUUM ANALYZE');
 schedule
----------
        1
(1 row)

postgres=# SELECT * FROM cron.job;
 jobid |  schedule  |    command     | nodename  | nodeport | database | username | active | jobname
-------+------------+----------------+-----------+----------+----------+----------+--------+---------
     1 | 0 11 * * * | VACUUM ANALYZE | localhost |     5432 | postgres | postgres | t      |
(1 row)

postgres=#

postgres=#
postgres=#
postgres=# table cron.job;

 jobid |  schedule  |    command     | nodename  | nodeport | database | username | active | jobname
-------+------------+----------------+-----------+----------+----------+----------+--------+---------
     1 | 0 11 * * * | VACUUM ANALYZE | localhost |     5432 | postgres | postgres | t      |
(1 row)


Lets do some more tests, will now create a table with some test records and will try to delete them using pg_cron.

postgres=#
postgres=# CREATE TABLE article (
postgres(#     article_id bigserial primary key,
postgres(#     article_name varchar(20) NOT NULL,
postgres(#     article_desc text NOT NULL,
postgres(#     date_added timestamp default NULL
postgres(# );
CREATE TABLE
postgres=#


postgres=# insert into article (article_id, article_name, article_desc, date_added) values (1010,'vinyl','Beatles 1980 Vinyl',current_timestamp);
postgres=# insert into article (article_id, article_name, article_desc, date_added) values (1011,'Tape','Deftones 2015 Vinyl',current_timestamp);
postgres=# insert into article (article_id, article_name, article_desc, date_added) values (1019,'Tape','Deftones 2015 Vinyl',current_timestamp);


postgres=#
postgres=# select * from article;
 article_id | article_name |    article_desc     |         date_added
------------+--------------+---------------------+----------------------------
       1010 | vinyl        | Beatles 1980 Vinyl  | 2021-07-24 12:03:30.514886
       1019 | Tape         | Deftones 2015 Vinyl | 2021-07-24 12:03:40.870081
       1011 | Tape         | Deftones 2015 Vinyl | 2021-07-24 12:03:52.046054
(3 rows)

postgres=#


postgres=# \! date
Sat Jul 24 12:20:40 EDT 2021
postgres=#


-- To delete entries those are older than 1 minute
postgres=# SELECT cron.schedule('23 12 * * *', $$DELETE FROM article WHERE date_added<now()- interval '1 Mins'$$);
 schedule
----------
       2
(1 row)

postgres=#
postgres=# SELECT * FROM cron.job;
 jobid |  schedule   |                            command                            | nodename  | nodeport | database | username | active | jobname
-------+-------------+---------------------------------------------------------------+-----------+----------+----------+----------+--------+---------
     1 | */5 * * * * | VACUUM                                                        | localhost |     5432 | postgres | postgres | t      |
     2 | 23 12 * * * | DELETE FROM article WHERE date_added<now()- interval '1 Mins' | localhost |     5432 | postgres | postgres | t      |
(2 rows)


-- This is what it is before pg_cron executing the schedule.
postgres=#
postgres=#
postgres=# select * from article;
 article_id | article_name |    article_desc     |         date_added
------------+--------------+---------------------+----------------------------
       1010 | vinyl        | Beatles 1980 Vinyl  | 2021-07-24 12:16:00.507391
       1011 | Tape         | Deftones 2015 Vinyl | 2021-07-24 12:16:05.762869
       1019 | Tape         | Deftones 2015 Vinyl | 2021-07-24 12:16:09.960464
(3 rows)


-- Will do a watch on table records to see if pg_cron comes and delete records on specified time.
postgres=#
postgres=# \watch 5
                  Sat 24 Jul 2021 12:22:43 PM EDT (every 5s)

 article_id | article_name |    article_desc     |         date_added
------------+--------------+---------------------+----------------------------
       1010 | vinyl        | Beatles 1980 Vinyl  | 2021-07-24 12:16:00.507391
       1011 | Tape         | Deftones 2015 Vinyl | 2021-07-24 12:16:05.762869
       1019 | Tape         | Deftones 2015 Vinyl | 2021-07-24 12:16:09.960464
(3 rows)

                  Sat 24 Jul 2021 12:22:48 PM EDT (every 5s)

 article_id | article_name |    article_desc     |         date_added
------------+--------------+---------------------+----------------------------
       1010 | vinyl        | Beatles 1980 Vinyl  | 2021-07-24 12:16:00.507391
       1011 | Tape         | Deftones 2015 Vinyl | 2021-07-24 12:16:05.762869
       1019 | Tape         | Deftones 2015 Vinyl | 2021-07-24 12:16:09.960464
(3 rows)

                  Sat 24 Jul 2021 12:22:53 PM EDT (every 5s)

 article_id | article_name |    article_desc     |         date_added
------------+--------------+---------------------+----------------------------
       1010 | vinyl        | Beatles 1980 Vinyl  | 2021-07-24 12:16:00.507391
       1011 | Tape         | Deftones 2015 Vinyl | 2021-07-24 12:16:05.762869
       1019 | Tape         | Deftones 2015 Vinyl | 2021-07-24 12:16:09.960464
(3 rows)

                  Sat 24 Jul 2021 12:22:58 PM EDT (every 5s)

 article_id | article_name |    article_desc     |         date_added
------------+--------------+---------------------+----------------------------
       1010 | vinyl        | Beatles 1980 Vinyl  | 2021-07-24 12:16:00.507391
       1011 | Tape         | Deftones 2015 Vinyl | 2021-07-24 12:16:05.762869
       1019 | Tape         | Deftones 2015 Vinyl | 2021-07-24 12:16:09.960464
(3 rows)

                  Sat 24 Jul 2021 12:23:03 PM EDT (every 5s)

 article_id | article_name |    article_desc     |         date_added
------------+--------------+---------------------+----------------------------

Yes, it did pretty smoothly on specified time! Let’s do some more fun.

postgres=#
postgres=# CREATE OR REPLACE PROCEDURE display_message (INOUT msg TEXT)
postgres-# AS $$ BEGIN
postgres$# RAISE NOTICE 'Procedure Parameter: %', msg ;
postgres$# END ;
postgres$# $$
postgres-# LANGUAGE plpgsql ;
CREATE PROCEDURE
postgres=#
postgres=# call display_message('This is my test case');
NOTICE:  Procedure Parameter: This is my test case
         msg
----------------------
 This is my test case
(1 row)


postgres=# SELECT cron.schedule('display_message', '* * * * *', 'CALL display_message()');
 schedule
----------
       14
(1 row)

postgres=# SELECT * FROM cron.job;
 jobid |  schedule   |                            command                            | nodename  | nodeport | database | username | active |     jobname
-------+-------------+---------------------------------------------------------------+-----------+----------+----------+----------+--------+-----------------
     9 | */5 * * * * | VACUUM                                                        | localhost |     5432 | postgres | postgres | t      |
    12 | 20 12 * * * | DELETE FROM article WHERE date_added<now()- interval '1 Mins' | localhost |     5432 | postgres | postgres | t      |
    13 | 0 3 * * *   | VACUUM article                                                | localhost |     5432 | postgres | postgres | t      |
    14 | * * * * *   | CALL display_message()                                        | localhost |     5432 | postgres | postgres | t      | display_message
(4 rows)

Now, how to delete a single schedule or all/multiple.

postgres=#  SELECT cron.unschedule(2);
 unschedule
------------
 t
(1 row)


postgres=#
postgres=# SELECT cron.unschedule(jobid) FROM cron.job;
 unschedule
------------
 t
 t

(2 rows)

postgres=#
postgres=# SELECT * FROM cron.job;
 jobid | schedule | command | nodename | nodeport | database | username | active | jobname
-------+----------+---------+----------+----------+----------+----------+--------+---------
(0 rows)

postgres=#

You can check database log files (postgresql-<day of the week>.log) to see if all okay with the jobs. If any of the scheduled job failed to execute, it will log more details to the log file, example, see below screenshot where one of the job with ID 14 trying to start but failed due to ‘connection refused‘ error. So, here we have got a hint to check pg_hba file and accordingly take the action to mitigate the problem.

After we applied the change …

Hope It Helped!
Prashant Dixit

Posted in Advanced | Tagged: , | 2 Comments »

My favorite 5 linux TOP features/flags ….

Posted by FatDBA on July 23, 2021

Hi Guys,

Recently I started the ‘Top 5’ series where I share my top 5 features in any particular tool or product. Last time I did for SQL Developer command line (SQLcl), this time it will be about one of Linux’s favorite tool ‘TOP‘.

So, without any particular order, below are my top 5 picks of options/flags available with the tool.

c : To get absolute path of the commands currently executing. This will be quite helpful if you want to know from where the command/executable is running. I have used this option lot of the times in multiple performance battles that I have won 🙂 Look at the screen below and in to column COMMAND.

z: will display running process in RED color which may help you to identified running process easily.

1: To get usage details per CPU core.

SHIFT+i : To disable the IRIX (default mode is ON) mode, help you to understand – Why Process CPU % Usage larger than Total CPU Time ?

E: To get memory details in KB, MB & GB, press ‘E’ each time. So, no need to separately call ‘free’ command.

I know this is all about top 5 picks, but here goes my 6th top (kinda reserve option) 🙂

V: Tree Mode, to display the processes in a parent child hierarchy.

Hope It Helped
Prashant Dixit

Posted in Advanced, troubleshooting | Tagged: , | Leave a Comment »

How to fix/handle Wraparound problem in PostgreSQL ?

Posted by FatDBA on July 21, 2021

Hi Guys,

In continuation from where I left in my last post on simulating wraparounds in PostgreSQL, this post is all about managing the mess that we spilled 🙂 Though this was a synthetic/artificial test and as soon you close or exit SESSION 1 where you’ve opened a BEGIN block/transaction and ran select txid_current() to block autovacuum, it (autovacuum) will automatically kick-in and perform a quick full vacuum on all of the databases in the cluster. You have to remember that even if you have autovacuum turned off, it will still start in emergency mode.

So, this is what we got earlier at the time we hit by the wraparound problem when we tried to execute a DML and it says something about stopping postmaster and vacuum databases in single-user mode; What is that ? – We will see that next ….

enterprisedb=#
enterprisedb=# SELECT datname
, age(datfrozenxid)
, current_setting('autovacuum_freeze_max_age')
FROM pg_database
 ORDER BY 2 DESC;
 
   datname    |    age     | current_setting
--------------+------------+-----------------
 postgres     | 2146483647 | 200000000
 edb          | 2146483647 | 200000000
 template1    | 2146483647 | 200000000
 template0    | 2146483647 | 200000000
 immortal     | 2146483647 | 200000000
 darkthrone   | 2146483647 | 200000000
 immortal1    | 2146483647 | 200000000
 mayhem       | 2146483647 | 200000000
 murduk       | 2146483647 | 200000000
 burzum       | 2146483647 | 200000000
 gorgoroth    | 2146483647 | 200000000
 repmgr       | 2146483647 | 200000000
 enterprisedb | 2146483647 | 200000000
(13 rows)


enterprisedb=# update pgbench_history set aid=65555 where aid=64444;
ERROR:  database is not accepting commands to avoid wraparound data loss in database "postgres"
HINT:  Stop the postmaster and vacuum that database in single-user mode.
You might also need to commit or roll back old prepared transactions, or drop stale replication slots.
enterprisedb=#
enterprisedb=#

Okay, coming back to the point, how to handle the situation now when you’ve already hit the wraparound. So, first thing you have to manually shut down the database cluster, if it’s still up.

-bash-4.2$ pwd
/usr/edb/as11/bin

-bash-4.2$ /usr/edb/as11/bin/pg_ctl stop -D /var/lib/edb/as11/data
waiting for server to shut down.... done
server stopped
-bash-4.2$

Next, you need to run VACUUM FULL for each of the database (one-by-one using single mode) through stand-alone backend mode. For that you have to call postgres (if you’re on open source) or edb-postgres utility. I am on EDB PostgreSQL 11 so will be calling edb-postgres and execute VACUUM FULL.

-bash-4.2$ pwd
/usr/edb/as11/bin

-bash-4.2$
-bash-4.2$ ls *postgre*
edb-postgres
-bash-4.2$

-bash-4.2$ ./edb-postgres --single -D /var/lib/edb/as11/data enterprisedb

PostgreSQL stand-alone backend 11.11.20
backend> vacuum full;
2021-07-20 11:07:49 IST LOG:  statement: vacuum full;

backend>

It’s done for ‘enterprisedb’ database. Next will do it for ‘postgresql’ database, but this time I will use some stand-alone backend related command to assure we are connected with the right database and to enable runtime stats or verbose.

-bash-4.2$ ./edb-postgres --single -D /var/lib/edb/as11/data postgres

PostgreSQL stand-alone backend 11.11.20
backend>
backend> select current_database();
2021-07-20 13:45:25 IST LOG:  statement: select current_database();

         1: current_database    (typeid = 19, len = 64, typmod = -1, byval = f)
        ----
         1: current_database = "postgres"       (typeid = 19, len = 64, typmod = -1, byval = f)
        ----
backend> 


backend> SELECT set_config('log_statement_stats', 'on', false);
2021-07-20 13:48:55 IST LOG:  statement: SELECT set_config('log_statement_stats', 'on', false);

         1: set_config  (typeid = 25, len = -1, typmod = -1, byval = f)
        ----
         1: set_config = "on"   (typeid = 25, len = -1, typmod = -1, byval = f)
        ----
backend>

-- Now when we have enabled logging of stats, let's execute the VACUUM to see runtime stats
backend> vacuum full;
2021-07-20 13:49:29 IST LOG:  statement: vacuum full;

2021-07-20 13:49:30 IST LOG:  QUERY STATISTICS
2021-07-20 13:49:30 IST DETAIL:  ! system usage stats:
        !       0.557302 s user, 0.426659 s system, 120.357278 s elapsed
        !       [0.583998 s user, 0.455579 s system total]
        !       21756 kB max resident size
        !       224/402352 [240/402824] filesystem blocks in/out
        !       0/2558 [0/6201151] page faults/reclaims, 0 [0] swaps
        !       0 [0] signals rcvd, 0/0 [0/0] messages rcvd/sent
        !       982/2 [1005/3] voluntary/involuntary context switches
2021-07-20 13:58:39 IST STATEMENT:  vacuum full;

backend>

Okay, same way we have to run VACUUM FULL on all of the databases and restart PostgreSQL cluster.
Once all of the databases are done and after restart, connect with the database and you will see the TXID or datfrozenid has been reset and you are all good.

enterprisedb=# SELECT datname
, age(datfrozenxid)
, current_setting('autovacuum_freeze_max_age')
FROM pg_database
 ORDER BY 2 DESC;

    datname    | age | current_setting
--------------+-----+-----------------
postgres     | 1369 | 200000000
edb          | 1272 | 200000000
template1    | 1170 | 200000000
template0    | 1071 | 200000000
immortal     |  974 | 200000000
darkthrone   |  877 | 200000000
immortal1    |  780 | 200000000
mayhem       |  585 | 200000000
murduk       |  487 | 200000000
burzum       |  388 | 200000000
gorgoroth    |  291 | 200000000
repmgr       |  194 | 200000000
enterprisedb |   97 | 200000000

You’re all set!

Hope It Helped!
Prashant Dixit

Posted in Advanced, troubleshooting | Tagged: , , , | Leave a Comment »

How to simulate the deadly, infamous, misunderstood & complex ‘Transaction Wraparound Problem’ in PostgreSQL …

Posted by FatDBA on July 20, 2021

Hi Guys,

Last week one of my good friend asked me an interesting question – ‘How to replicate the transaction wraparound problem’ in PostgreSQL ?

He has a demo/POC that he needs to do for one of his customer who is interested to see how it looks like in reality and how ‘deadly’ is the problem and how to fix this. He scanned almost everything on the Google, but unfortunately found nothing available or pre-cooked …

So, this might be the only post available on the internet explaining how to exactly simulate the transaction wraparound in the PostgreSQL Database. This one was really interesting and I have never tried this before as I thought I will never see transaction ID wraparound error 🙂 . So, before I jump in to the demo, we need to take care of few things. Use a system with good resources, I have performed this demo on an EDB PostgreSQL 11.11.20 database with 8 CPUs, 31 GB RAM, and it took me around 9 hours to exhaust all transactionIDs and reach the limit of 2,000,000,000.

Would like to thank Nikolay Samokhvalov for his help! 🙂

Before I start, let’s do this one more time – What is a transaction ID and why it wrapsaround ?
The PostgreSQL transaction control mechanism assigns a transaction ID to every row that is modified in the database; these IDs control the visibility of that row to other concurrent transactions. Txid wraparound is a problem due to MVCC. MVCC relies on being able to take the txids of two transactions and determine which of the transactions came first.
A PostgreSQL database can have two billion ‘in-flight’ unvacuumed transactions before PostgreSQL takes dramatic action to avoid data loss. If the number of unvacuumed transactions reaches (2^31 – 10,000,000), the log starts warning that vacuuming is needed. If the number of unvacuumed transactions reaches 2,000,000,000, PostgreSQL sets the database to read-only mode and requires an offline, single-user, standalone vacuum.

Note: You have to carefully monitor your database pg_log, archiving locations as this activity will generate huge WALs. At the same time, keep an eye on the size of your log directory, specially if you are capturing all statements.

We will open multiple parallel sessions to simulate the workload and monitor the progress.

SESSION 1:

In the first session, we will first connect with the database and set idle_in_transaction_session_timeout to value 0 and start a BEGIN block and execute select txid_current(); this is to block autovacuum, as simply turning it off wouldn’t help because emegency mode kick in even with `autovacuum = off.

The idle_in_transaction_session_timeout parameter terminate any session with an open transaction that has been idle for longer than the specified duration in milliseconds. This allows any locks held by that session to be released and the connection slot to be reused; it also allows tuples visible only to this transaction to be vacuumed. So, we will have to set it to value 0 that will disable this feature.

-bash-4.2$ psql -p 5444
psql.bin (11.11.20)
Type "help" for help.

enterprisedb=# SET idle_in_transaction_session_timeout = 0;
SET
enterprisedb=#  BEGIN;
BEGIN
enterprisedb=# select txid_current();
 txid_current
--------------
         1266

enterprisedb=#
enterprisedb=#

SESSION 2:

Now, I will create a file with current transaction ID written in to it and will call the pgbench. I am doing something like below to call pgbench, below are the explanations on flags used and why I used them ..

pgbench -U enterprisedb enterprisedb -f wl.sql -c8 -j8 -T100000 -rn -P60

-f: to read from a file
-c8: 8 clients
-j8: 8 threads/jobs (adjust it as per your CPU count)
-T100000: seconds to run the test for this many seconds, rather than a fixed number of transactions per client
-rn: where r is to report the average per-statement latency (execution time from the perspective of the client) of each command after the benchmark finishes. Whereas n is to perform no vacuuming before running the test. This option is necessary if you are running a custom test scenario that does not include the standard tables pgbench_accounts, pgbench_branches, pgbench_history, and pgbench_tellers.
-P60: is to show progress report every sec seconds

-bash-4.2$ 
-bash-4.2$ echo 'select txid_current();' > wl.sql
-bash-4.2$ 
-bash-4.2$
-bash-4.2$ /usr/edb/as11/bin/pgbench -U enterprisedb enterprisedb -f wl.sql -c8 -j8 -T100000 -rn -P60
progress: 60.0 s, 51097.6 tps, lat 0.157 ms stddev 0.262
progress: 120.0 s, 51171.1 tps, lat 0.156 ms stddev 0.252
progress: 180.0 s, 51622.8 tps, lat 0.155 ms stddev 0.250
progress: 240.0 s, 51328.9 tps, lat 0.156 ms stddev 0.260
progress: 300.0 s, 50976.6 tps, lat 0.157 ms stddev 0.256
progress: 360.0 s, 51130.3 tps, lat 0.156 ms stddev 0.265
progress: 420.0 s, 50792.6 tps, lat 0.158 ms stddev 0.254
progress: 480.0 s, 51207.2 tps, lat 0.156 ms stddev 0.250
progress: 540.0 s, 51162.6 tps, lat 0.156 ms stddev 0.251
progress: 600.0 s, 51246.0 tps, lat 0.156 ms stddev 0.256
progress: 660.0 s, 51047.3 tps, lat 0.157 ms stddev 0.253
progress: 720.0 s, 51197.3 tps, lat 0.156 ms stddev 0.252
progress: 780.0 s, 51119.2 tps, lat 0.156 ms stddev 0.281
progress: 840.0 s, 50938.8 tps, lat 0.157 ms stddev 0.252
progress: 900.0 s, 51252.8 tps, lat 0.156 ms stddev 0.251
progress: 960.0 s, 51054.0 tps, lat 0.157 ms stddev 0.253
progress: 1020.0 s, 51159.5 tps, lat 0.156 ms stddev 0.254
progress: 1080.0 s, 51116.0 tps, lat 0.157 ms stddev 0.253
progress: 1140.0 s, 50947.6 tps, lat 0.157 ms stddev 0.251
progress: 1200.0 s, 51289.7 tps, lat 0.156 ms stddev 0.254
progress: 1260.0 s, 50338.7 tps, lat 0.159 ms stddev 0.254
progress: 1320.0 s, 50121.1 tps, lat 0.160 ms stddev 0.260
progress: 1380.0 s, 49936.6 tps, lat 0.160 ms stddev 0.291
progress: 1440.0 s, 50451.1 tps, lat 0.159 ms stddev 0.251
progress: 1500.0 s, 51107.4 tps, lat 0.157 ms stddev 0.248
progress: 1560.0 s, 50907.8 tps, lat 0.157 ms stddev 0.321
progress: 1620.0 s, 51033.7 tps, lat 0.157 ms stddev 0.251
progress: 1680.0 s, 51013.6 tps, lat 0.157 ms stddev 0.254
progress: 1740.0 s, 51119.4 tps, lat 0.156 ms stddev 0.252
progress: 1800.0 s, 51411.9 tps, lat 0.156 ms stddev 0.249
progress: 1860.0 s, 51099.1 tps, lat 0.157 ms stddev 0.249
progress: 1920.0 s, 51527.5 tps, lat 0.155 ms stddev 0.256
progress: 1980.0 s, 51204.3 tps, lat 0.156 ms stddev 0.267
progress: 2040.0 s, 51363.8 tps, lat 0.156 ms stddev 0.249
progress: 2100.0 s, 51563.1 tps, lat 0.155 ms stddev 0.250
progress: 2160.0 s, 51329.3 tps, lat 0.156 ms stddev 0.246
progress: 2220.0 s, 51073.4 tps, lat 0.157 ms stddev 0.276
progress: 2280.0 s, 51402.0 tps, lat 0.156 ms stddev 0.248
progress: 2340.0 s, 51364.4 tps, lat 0.156 ms stddev 0.253
progress: 2400.0 s, 50890.0 tps, lat 0.157 ms stddev 0.251
progress: 2460.0 s, 50239.6 tps, lat 0.159 ms stddev 0.296
progress: 2520.0 s, 50684.8 tps, lat 0.158 ms stddev 0.283
progress: 2580.0 s, 49826.2 tps, lat 0.161 ms stddev 0.271
progress: 2640.0 s, 51076.7 tps, lat 0.157 ms stddev 0.250
progress: 2700.0 s, 51349.6 tps, lat 0.156 ms stddev 0.252
progress: 2760.0 s, 51076.6 tps, lat 0.157 ms stddev 0.253
progress: 2820.0 s, 50854.5 tps, lat 0.157 ms stddev 0.256
progress: 2880.0 s, 49864.8 tps, lat 0.160 ms stddev 0.260
progress: 2940.0 s, 50450.1 tps, lat 0.159 ms stddev 0.264
progress: 3000.0 s, 50334.7 tps, lat 0.159 ms stddev 0.264
progress: 3060.0 s, 50514.3 tps, lat 0.158 ms stddev 0.299
progress: 3120.0 s, 50508.7 tps, lat 0.158 ms stddev 0.284
progress: 3180.0 s, 50691.3 tps, lat 0.158 ms stddev 0.288
progress: 3240.0 s, 50601.6 tps, lat 0.158 ms stddev 0.256
progress: 3300.0 s, 50280.2 tps, lat 0.159 ms stddev 0.264
progress: 3360.0 s, 50457.6 tps, lat 0.159 ms stddev 0.265
progress: 3420.0 s, 50178.3 tps, lat 0.159 ms stddev 0.390
progress: 3480.0 s, 50353.3 tps, lat 0.159 ms stddev 0.264
progress: 3540.0 s, 50133.0 tps, lat 0.160 ms stddev 0.259
progress: 3600.0 s, 50217.6 tps, lat 0.159 ms stddev 0.282
progress: 3660.0 s, 50147.8 tps, lat 0.160 ms stddev 0.279
progress: 3720.0 s, 50578.0 tps, lat 0.158 ms stddev 0.261
progress: 3780.0 s, 50523.9 tps, lat 0.158 ms stddev 0.261
progress: 3840.0 s, 50349.7 tps, lat 0.159 ms stddev 0.269
progress: 3900.0 s, 50437.5 tps, lat 0.159 ms stddev 0.287
progress: 3960.0 s, 49569.1 tps, lat 0.161 ms stddev 0.311
progress: 4020.0 s, 50337.3 tps, lat 0.159 ms stddev 0.286
progress: 4080.0 s, 50065.2 tps, lat 0.160 ms stddev 0.260
progress: 4140.0 s, 49791.4 tps, lat 0.161 ms stddev 0.264
progress: 4200.0 s, 49681.3 tps, lat 0.161 ms stddev 0.326
progress: 4260.0 s, 48034.2 tps, lat 0.167 ms stddev 0.340
progress: 4320.0 s, 50460.9 tps, lat 0.159 ms stddev 0.290
progress: 4380.0 s, 49731.0 tps, lat 0.161 ms stddev 0.300
progress: 4440.0 s, 50441.1 tps, lat 0.159 ms stddev 0.266
progress: 4500.0 s, 50259.1 tps, lat 0.159 ms stddev 0.267
progress: 4560.0 s, 50197.0 tps, lat 0.159 ms stddev 0.259
progress: 4620.0 s, 49832.1 tps, lat 0.161 ms stddev 0.271
progress: 4680.0 s, 50160.3 tps, lat 0.159 ms stddev 0.268
progress: 4740.0 s, 50578.5 tps, lat 0.158 ms stddev 0.262
progress: 4800.0 s, 50260.5 tps, lat 0.159 ms stddev 0.270
progress: 4860.0 s, 50545.1 tps, lat 0.158 ms stddev 0.256
progress: 4920.0 s, 49961.8 tps, lat 0.160 ms stddev 0.285
progress: 4980.0 s, 50450.7 tps, lat 0.159 ms stddev 0.267
progress: 5040.0 s, 50008.7 tps, lat 0.160 ms stddev 0.257
progress: 5100.0 s, 49723.2 tps, lat 0.161 ms stddev 0.428
progress: 5160.0 s, 50211.1 tps, lat 0.159 ms stddev 0.378
progress: 5220.0 s, 49791.0 tps, lat 0.161 ms stddev 0.262
progress: 5280.0 s, 50091.5 tps, lat 0.160 ms stddev 0.265
progress: 5340.0 s, 50280.3 tps, lat 0.159 ms stddev 0.266
progress: 5400.0 s, 49957.1 tps, lat 0.160 ms stddev 0.402
progress: 5460.0 s, 50101.7 tps, lat 0.160 ms stddev 0.293
progress: 5520.0 s, 50387.3 tps, lat 0.159 ms stddev 0.261
progress: 5580.0 s, 50173.2 tps, lat 0.159 ms stddev 0.278
progress: 5640.0 s, 50225.1 tps, lat 0.159 ms stddev 0.266
progress: 5700.0 s, 50186.7 tps, lat 0.159 ms stddev 0.264
progress: 5760.0 s, 49120.1 tps, lat 0.163 ms stddev 0.264
progress: 5820.0 s, 49445.3 tps, lat 0.162 ms stddev 0.262
progress: 5880.0 s, 49547.2 tps, lat 0.161 ms stddev 0.260
progress: 5940.0 s, 49730.2 tps, lat 0.161 ms stddev 0.267
progress: 6000.0 s, 50543.3 tps, lat 0.158 ms stddev 0.258
progress: 6060.0 s, 50569.1 tps, lat 0.158 ms stddev 0.258
progress: 6120.0 s, 50560.4 tps, lat 0.158 ms stddev 0.250
progress: 6180.0 s, 50572.1 tps, lat 0.158 ms stddev 0.255
progress: 6240.0 s, 50551.6 tps, lat 0.158 ms stddev 0.253
progress: 6300.0 s, 50993.8 tps, lat 0.157 ms stddev 0.254
progress: 6360.0 s, 51114.6 tps, lat 0.157 ms stddev 0.257
progress: 6420.0 s, 50762.6 tps, lat 0.158 ms stddev 0.261
progress: 6480.0 s, 50814.2 tps, lat 0.157 ms stddev 0.250
progress: 6540.0 s, 50735.7 tps, lat 0.158 ms stddev 0.257
progress: 6600.0 s, 50521.9 tps, lat 0.158 ms stddev 0.263
progress: 6660.0 s, 50829.8 tps, lat 0.157 ms stddev 0.252
progress: 6720.0 s, 50933.7 tps, lat 0.157 ms stddev 0.255
progress: 6780.0 s, 51152.9 tps, lat 0.156 ms stddev 0.252
progress: 6840.0 s, 50457.1 tps, lat 0.159 ms stddev 0.255
progress: 6900.0 s, 50542.5 tps, lat 0.158 ms stddev 0.251
progress: 6960.0 s, 50802.5 tps, lat 0.157 ms stddev 0.282
progress: 7020.0 s, 51066.1 tps, lat 0.157 ms stddev 0.270
progress: 7080.0 s, 50729.0 tps, lat 0.158 ms stddev 0.258
progress: 7140.0 s, 51242.7 tps, lat 0.156 ms stddev 0.255
progress: 7200.0 s, 50714.2 tps, lat 0.158 ms stddev 0.253
progress: 7260.0 s, 50704.7 tps, lat 0.158 ms stddev 0.323
progress: 7320.0 s, 50951.4 tps, lat 0.157 ms stddev 0.250
progress: 7380.0 s, 50604.8 tps, lat 0.158 ms stddev 0.340
progress: 7440.0 s, 51217.0 tps, lat 0.156 ms stddev 0.251
progress: 7500.0 s, 50832.4 tps, lat 0.157 ms stddev 0.251
progress: 7560.0 s, 50815.7 tps, lat 0.157 ms stddev 0.256
progress: 7620.0 s, 49936.3 tps, lat 0.160 ms stddev 0.463
progress: 7680.0 s, 50556.4 tps, lat 0.158 ms stddev 0.251
progress: 7740.0 s, 50699.8 tps, lat 0.158 ms stddev 0.255
progress: 7800.0 s, 50474.0 tps, lat 0.158 ms stddev 0.256
progress: 7860.0 s, 50401.9 tps, lat 0.159 ms stddev 0.321
progress: 7920.0 s, 51385.5 tps, lat 0.156 ms stddev 0.251
progress: 7980.0 s, 50671.9 tps, lat 0.158 ms stddev 0.248
progress: 8040.0 s, 50631.3 tps, lat 0.158 ms stddev 0.252
progress: 8100.0 s, 50741.3 tps, lat 0.158 ms stddev 0.255
progress: 8160.0 s, 50465.5 tps, lat 0.159 ms stddev 0.257
progress: 8220.0 s, 51384.9 tps, lat 0.156 ms stddev 0.212
progress: 8280.0 s, 51676.8 tps, lat 0.155 ms stddev 0.233
progress: 8340.0 s, 52049.3 tps, lat 0.154 ms stddev 0.179
progress: 8400.0 s, 52394.6 tps, lat 0.153 ms stddev 0.178
progress: 8460.0 s, 51872.3 tps, lat 0.154 ms stddev 0.192
progress: 8520.0 s, 51896.9 tps, lat 0.154 ms stddev 0.178
progress: 8580.0 s, 52187.5 tps, lat 0.153 ms stddev 0.178
progress: 8640.0 s, 51773.8 tps, lat 0.155 ms stddev 0.185
progress: 8700.0 s, 51862.7 tps, lat 0.154 ms stddev 0.184
progress: 8760.0 s, 51906.7 tps, lat 0.154 ms stddev 0.189
progress: 8820.0 s, 52038.6 tps, lat 0.154 ms stddev 0.189
progress: 8880.0 s, 52370.9 tps, lat 0.153 ms stddev 0.180
progress: 8940.0 s, 52155.2 tps, lat 0.153 ms stddev 0.185
progress: 9000.0 s, 52162.2 tps, lat 0.153 ms stddev 0.219
progress: 9060.0 s, 51900.7 tps, lat 0.154 ms stddev 0.189
progress: 9120.0 s, 51794.5 tps, lat 0.154 ms stddev 0.178
progress: 9180.0 s, 51885.1 tps, lat 0.154 ms stddev 0.180
progress: 9240.0 s, 52007.4 tps, lat 0.154 ms stddev 0.177
progress: 9300.0 s, 52168.3 tps, lat 0.153 ms stddev 0.189
progress: 9360.0 s, 51801.3 tps, lat 0.154 ms stddev 0.182
progress: 9420.0 s, 51899.8 tps, lat 0.154 ms stddev 0.173
progress: 9480.0 s, 52215.3 tps, lat 0.153 ms stddev 0.177
progress: 9540.0 s, 52129.9 tps, lat 0.153 ms stddev 0.227
progress: 9600.0 s, 51929.9 tps, lat 0.154 ms stddev 0.176
progress: 9660.0 s, 51776.6 tps, lat 0.155 ms stddev 0.181
progress: 9720.0 s, 51542.8 tps, lat 0.155 ms stddev 0.268
progress: 9780.0 s, 51352.5 tps, lat 0.156 ms stddev 0.310
progress: 9840.0 s, 51661.0 tps, lat 0.155 ms stddev 0.177
progress: 9900.0 s, 51219.8 tps, lat 0.156 ms stddev 0.260
progress: 9960.0 s, 52235.8 tps, lat 0.153 ms stddev 0.184
progress: 10020.0 s, 51904.5 tps, lat 0.154 ms stddev 0.186
progress: 10080.0 s, 52066.8 tps, lat 0.154 ms stddev 0.183
progress: 10140.0 s, 52212.5 tps, lat 0.153 ms stddev 0.209
progress: 10200.0 s, 52402.8 tps, lat 0.153 ms stddev 0.186
progress: 10260.0 s, 52194.8 tps, lat 0.153 ms stddev 0.178
progress: 10320.0 s, 52117.3 tps, lat 0.153 ms stddev 0.179
progress: 10380.0 s, 52060.5 tps, lat 0.154 ms stddev 0.181
progress: 10440.0 s, 52043.1 tps, lat 0.154 ms stddev 0.183
progress: 10500.0 s, 52358.5 tps, lat 0.153 ms stddev 0.178
progress: 10560.0 s, 51361.2 tps, lat 0.156 ms stddev 0.179
progress: 10620.0 s, 51655.7 tps, lat 0.155 ms stddev 0.184
progress: 10680.0 s, 51501.1 tps, lat 0.155 ms stddev 0.176
progress: 10740.0 s, 51315.4 tps, lat 0.156 ms stddev 0.182
progress: 10800.0 s, 52344.5 tps, lat 0.153 ms stddev 0.181
progress: 10860.0 s, 51687.0 tps, lat 0.155 ms stddev 0.182
progress: 10920.0 s, 51150.2 tps, lat 0.156 ms stddev 0.179
progress: 10980.0 s, 51341.9 tps, lat 0.156 ms stddev 0.181
progress: 11040.0 s, 51074.0 tps, lat 0.157 ms stddev 0.184
progress: 11100.0 s, 51645.4 tps, lat 0.155 ms stddev 0.277
progress: 11160.0 s, 51984.6 tps, lat 0.154 ms stddev 0.182
progress: 11220.0 s, 51993.4 tps, lat 0.154 ms stddev 0.181
progress: 11280.0 s, 51894.9 tps, lat 0.154 ms stddev 0.183
progress: 11340.0 s, 52007.2 tps, lat 0.154 ms stddev 0.186
progress: 11400.0 s, 52255.9 tps, lat 0.153 ms stddev 0.188
progress: 11460.0 s, 52221.2 tps, lat 0.153 ms stddev 0.183
progress: 11520.0 s, 51990.5 tps, lat 0.154 ms stddev 0.181
progress: 11580.0 s, 52138.3 tps, lat 0.153 ms stddev 0.178
progress: 11640.0 s, 51258.2 tps, lat 0.156 ms stddev 0.178
progress: 11700.0 s, 52268.0 tps, lat 0.153 ms stddev 0.179
progress: 11760.0 s, 51838.4 tps, lat 0.154 ms stddev 0.180
progress: 11820.0 s, 52079.2 tps, lat 0.154 ms stddev 0.185
progress: 11880.0 s, 52531.4 tps, lat 0.152 ms stddev 0.175
progress: 11940.0 s, 51711.7 tps, lat 0.155 ms stddev 0.260
progress: 12000.0 s, 52020.7 tps, lat 0.154 ms stddev 0.180
progress: 12060.0 s, 51990.1 tps, lat 0.154 ms stddev 0.241
progress: 12120.0 s, 51367.6 tps, lat 0.156 ms stddev 0.193
progress: 12180.0 s, 51316.0 tps, lat 0.156 ms stddev 0.187
progress: 12240.0 s, 50819.0 tps, lat 0.157 ms stddev 0.190
progress: 12300.0 s, 51614.6 tps, lat 0.155 ms stddev 0.182
progress: 12360.0 s, 51500.6 tps, lat 0.155 ms stddev 0.187
progress: 12420.0 s, 51715.8 tps, lat 0.155 ms stddev 0.259
progress: 12480.0 s, 51805.0 tps, lat 0.154 ms stddev 0.183
progress: 12540.0 s, 51846.2 tps, lat 0.154 ms stddev 0.183
progress: 12600.0 s, 51829.6 tps, lat 0.154 ms stddev 0.179
progress: 12660.0 s, 51411.1 tps, lat 0.156 ms stddev 0.221
progress: 12720.0 s, 51728.5 tps, lat 0.155 ms stddev 0.187
progress: 12780.0 s, 52170.5 tps, lat 0.153 ms stddev 0.181
progress: 12840.0 s, 51985.8 tps, lat 0.154 ms stddev 0.182
progress: 12900.0 s, 51723.3 tps, lat 0.155 ms stddev 0.181
progress: 12960.0 s, 52324.2 tps, lat 0.153 ms stddev 0.184
progress: 13020.0 s, 51795.5 tps, lat 0.154 ms stddev 0.189
progress: 13080.0 s, 51547.3 tps, lat 0.155 ms stddev 0.373
progress: 13140.0 s, 51592.4 tps, lat 0.155 ms stddev 0.231
progress: 13200.0 s, 52004.8 tps, lat 0.154 ms stddev 0.223
progress: 13260.0 s, 52118.3 tps, lat 0.153 ms stddev 0.184
progress: 13320.0 s, 51781.1 tps, lat 0.154 ms stddev 0.183
progress: 13380.0 s, 50621.8 tps, lat 0.158 ms stddev 0.196
progress: 13440.0 s, 50671.8 tps, lat 0.158 ms stddev 0.321
progress: 13500.0 s, 51389.4 tps, lat 0.156 ms stddev 0.181
progress: 13560.0 s, 51653.2 tps, lat 0.155 ms stddev 0.186
progress: 13620.0 s, 51491.7 tps, lat 0.155 ms stddev 0.181
progress: 13680.0 s, 51639.4 tps, lat 0.155 ms stddev 0.183
progress: 13740.0 s, 51385.3 tps, lat 0.156 ms stddev 0.188
progress: 13800.0 s, 51640.2 tps, lat 0.155 ms stddev 0.177
progress: 13860.0 s, 51820.7 tps, lat 0.154 ms stddev 0.176
progress: 13920.0 s, 52041.9 tps, lat 0.154 ms stddev 0.179
progress: 13980.0 s, 52001.0 tps, lat 0.154 ms stddev 0.178
progress: 14040.0 s, 52189.3 tps, lat 0.153 ms stddev 0.176
progress: 14100.0 s, 51897.9 tps, lat 0.154 ms stddev 0.179
progress: 14160.0 s, 52066.4 tps, lat 0.154 ms stddev 0.180
progress: 14220.0 s, 52257.9 tps, lat 0.153 ms stddev 0.178
progress: 14280.0 s, 51850.1 tps, lat 0.154 ms stddev 0.210
......
.........
...........

SESSION 3:

Now in this third session we will monitor the database to see what’s going on. You can do something like below to check where we are going.

Below SQL will show you the ‘datfrozenxid‘ which is a value for all transaction IDs before this one have been replaced with a permanent (“frozen”) transaction ID in this database. This is used to track whether the database needs to be vacuumed in order to prevent transaction ID wraparound. And to see ‘autovacuum_freeze_max_age‘ that is age at which to autovacuum a table to prevent transaction ID wraparound.

Do a watch (\watch 10) on the command to see the progress and the play live 🙂

SELECT datname
    , age(datfrozenxid)
    , current_setting('autovacuum_freeze_max_age') 
FROM pg_database 
ORDER BY 2 DESC;


   datname    |   age   | current_setting
--------------+---------+-----------------
 postgres     | 3058531 | 200000000
 edb          | 3058531 | 200000000
 template1    | 3058531 | 200000000
 template0    | 3058531 | 200000000
 immortal     | 3058531 | 200000000
 darkthrone   | 3058531 | 200000000
 immortal1    | 3058531 | 200000000
 mayhem       | 3058531 | 200000000
 marduk       | 3058531 | 200000000
 burzum       | 3058531 | 200000000
 gorgoroth    | 3058531 | 200000000
 repmgr       | 3058531 | 200000000
 enterprisedb | 3058531 | 200000000
(13 rows)

I have used below query to check where we are going, current XIDs, how close we are to our target of wraparound ..

enterprisedb=# WITH max_age AS ( 
    SELECT 2000000000 as max_old_xid
        , setting AS autovacuum_freeze_max_age 
        FROM pg_catalog.pg_settings 
        WHERE name = 'autovacuum_freeze_max_age' )
, per_database_stats AS ( 
    SELECT datname
        , m.max_old_xid::int
        , m.autovacuum_freeze_max_age::int
        , age(d.datfrozenxid) AS oldest_current_xid 
    FROM pg_catalog.pg_database d 
    JOIN max_age m ON (true) 
    WHERE d.datallowconn ) 
SELECT max(oldest_current_xid) AS oldest_current_xid
    , max(ROUND(100*(oldest_current_xid/max_old_xid::float))) AS percent_towards_wraparound
    , max(ROUND(100*(oldest_current_xid/autovacuum_freeze_max_age::float))) AS percent_towards_emergency_autovac 
FROM per_database_stats


\watch 10

 oldest_current_xid | percent_towards_wraparound | percent_towards_emergency_autovac
--------------------+----------------------------+-----------------------------------
          289007513 |                         14 |                               145
(1 row)


 oldest_current_xid | percent_towards_wraparound | percent_towards_emergency_autovac
--------------------+----------------------------+-----------------------------------
          290077770 |                         15 |                               145
(1 row)


 oldest_current_xid | percent_towards_wraparound | percent_towards_emergency_autovac
--------------------+----------------------------+-----------------------------------
          292467983 |                         15 |                               146
(1 row)


                     Mon 19 Jul 2021 08:38:01 PM IST (every 10s)

 oldest_current_xid | percent_towards_wraparound | percent_towards_emergency_autovac
--------------------+----------------------------+-----------------------------------
          342714029 |                         17 |                               171
(1 row)

                     Mon 19 Jul 2021 08:38:11 PM IST (every 10s)

 oldest_current_xid | percent_towards_wraparound | percent_towards_emergency_autovac
--------------------+----------------------------+-----------------------------------
          343223530 |                         17 |                               172
(1 row)


                     Mon 19 Jul 2021 09:17:45 PM IST (every 10s)

 oldest_current_xid | percent_towards_wraparound | percent_towards_emergency_autovac
--------------------+----------------------------+-----------------------------------
          406185619 |                         20 |                               203
(1 row)


 oldest_current_xid | percent_towards_wraparound | percent_towards_emergency_autovac
--------------------+----------------------------+-----------------------------------
          421779698 |                         21 |                               211
(1 row)

                     Mon 19 Jul 2021 09:28:10 PM IST (every 10s)

 oldest_current_xid | percent_towards_wraparound | percent_towards_emergency_autovac
--------------------+----------------------------+-----------------------------------
          438446236 |                         22 |                               219
(1 row)


                     Mon 19 Jul 2021 11:03:03 PM IST (every 10s)

 oldest_current_xid | percent_towards_wraparound | percent_towards_emergency_autovac
--------------------+----------------------------+-----------------------------------
          733479765 |                         37 |                               367
(1 row)


 oldest_current_xid | percent_towards_wraparound | percent_towards_emergency_autovac
--------------------+----------------------------+-----------------------------------
          763852636 |                         38 |                               382
(1 row)


                     Mon 19 Jul 2021 11:33:03 PM IST (every 10s)

 oldest_current_xid | percent_towards_wraparound | percent_towards_emergency_autovac
--------------------+----------------------------+-----------------------------------
          826485794 |                         41 |                               413
(1 row)


                     Tue 20 Jul 2021 12:18:07 AM IST (every 10s)

 oldest_current_xid | percent_towards_wraparound | percent_towards_emergency_autovac
--------------------+----------------------------+-----------------------------------
          966692697 |                         48 |                               483
(1 row)


 oldest_current_xid | percent_towards_wraparound | percent_towards_emergency_autovac
--------------------+----------------------------+-----------------------------------
         1107823196 |                         55 |                               554
 

                     Tue 20 Jul 2021 01:09:18 AM IST (every 10s)

 oldest_current_xid | percent_towards_wraparound | percent_towards_emergency_autovac
--------------------+----------------------------+-----------------------------------
         1125393734 |                         56 |                               563
(1 row)


                     Tue 20 Jul 2021 01:43:11 AM IST (every 10s)

 oldest_current_xid | percent_towards_wraparound | percent_towards_emergency_autovac
--------------------+----------------------------+-----------------------------------
         1230984982 |                         62 |                               615
(1 row)


-- LETS SEE WHAT'S HAPPENING ON THE DATABASE 
enterprisedb=# \x
Expanded display is on.
enterprisedb=#
enterprisedb=# select * from pg_stat_activity;


-[ RECORD 4 ]----+---------------------------------
datid            | 16384
datname          | enterprisedb
pid              | 24056
usesysid         | 10
usename          | enterprisedb
application_name | psql.bin
client_addr      |
client_hostname  |
client_port      | -1
backend_start    | 20-JUL-21 09:45:44.833016 +05:30
xact_start       | 20-JUL-21 09:45:57.749892 +05:30
query_start      | 20-JUL-21 09:46:01.042977 +05:30
state_change     | 20-JUL-21 09:46:01.047161 +05:30
wait_event_type  | Client
wait_event       | ClientRead
state            | idle in transaction
backend_xid      | 1195
backend_xmin     |
query            | select txid_current();
backend_type     | client backend
-[ RECORD 5 ]----+---------------------------------
datid            | 16384
datname          | enterprisedb
pid              | 25884
usesysid         | 10
usename          | enterprisedb
application_name | psql.bin
client_addr      |
client_hostname  |
client_port      | -1
backend_start    | 20-JUL-21 09:47:36.766729 +05:30
xact_start       | 20-JUL-21 09:52:18.941776 +05:30
query_start      | 20-JUL-21 09:52:18.941776 +05:30
state_change     | 20-JUL-21 09:52:18.941778 +05:30
wait_event_type  |
wait_event       |
state            | active
backend_xid      |
backend_xmin     | 1195
query            | select * from pg_stat_activity;
backend_type     | client backend
-[ RECORD 6 ]----+---------------------------------
datid            | 16384
datname          | enterprisedb
pid              | 27150
usesysid         | 10
usename          | enterprisedb
application_name | pgbench
client_addr      |
client_hostname  |
client_port      | -1
backend_start    | 20-JUL-21 09:49:56.70284 +05:30
xact_start       | 20-JUL-21 09:52:18.941429 +05:30
query_start      | 20-JUL-21 09:52:18.941429 +05:30
state_change     | 20-JUL-21 09:52:18.94143 +05:30
wait_event_type  | IPC
wait_event       | ClogGroupUpdate
state            | active
backend_xid      | 4526420
backend_xmin     |
query            | select txid_current();
backend_type     | client backend
-[ RECORD 7 ]----+---------------------------------
datid            | 16384
datname          | enterprisedb
pid              | 27151
usesysid         | 10
usename          | enterprisedb
application_name | pgbench
client_addr      |
client_hostname  |
client_port      | -1
backend_start    | 20-JUL-21 09:49:56.704062 +05:30
xact_start       |
query_start      | 20-JUL-21 09:52:18.943293 +05:30
state_change     | 20-JUL-21 09:52:18.943411 +05:30
wait_event_type  | Client
wait_event       | ClientRead
state            | idle
backend_xid      |
backend_xmin     |
query            | select txid_current();
backend_type     | client backend
-[ RECORD 8 ]----+---------------------------------
datid            | 16384
datname          | enterprisedb
pid              | 27153
usesysid         | 10
usename          | enterprisedb
application_name | pgbench
client_addr      |
client_hostname  |
client_port      | -1
backend_start    | 20-JUL-21 09:49:56.7067 +05:30
xact_start       |
query_start      | 20-JUL-21 09:52:18.943218 +05:30
state_change     | 20-JUL-21 09:52:18.943334 +05:30
wait_event_type  |
wait_event       |
state            | idle
backend_xid      |
backend_xmin     |
query            | select txid_current();
backend_type     | client backend
-[ RECORD 9 ]----+---------------------------------
datid            | 16384
datname          | enterprisedb
pid              | 27154
usesysid         | 10
usename          | enterprisedb
application_name | pgbench
client_addr      |
client_hostname  |
client_port      | -1
backend_start    | 20-JUL-21 09:49:56.707948 +05:30
xact_start       | 20-JUL-21 09:52:18.941116 +05:30
query_start      | 20-JUL-21 09:52:18.941116 +05:30
state_change     | 20-JUL-21 09:52:18.941117 +05:30
wait_event_type  | IPC
wait_event       | ClogGroupUpdate
state            | active
backend_xid      | 4526414
backend_xmin     |
query            | select txid_current();
backend_type     | client backend
-[ RECORD 10 ]---+---------------------------------
datid            | 16384
datname          | enterprisedb
pid              | 27152
usesysid         | 10
usename          | enterprisedb
application_name | pgbench
client_addr      |
client_hostname  |
client_port      | -1
backend_start    | 20-JUL-21 09:49:56.710155 +05:30
xact_start       | 20-JUL-21 09:52:18.943403 +05:30
query_start      | 20-JUL-21 09:52:18.943403 +05:30
state_change     | 20-JUL-21 09:52:18.943405 +05:30
wait_event_type  |
wait_event       |
state            | active
backend_xid      |
backend_xmin     |
query            | select txid_current();
backend_type     | client backend
-[ RECORD 11 ]---+---------------------------------
datid            | 16384
datname          | enterprisedb
pid              | 27155
usesysid         | 10
usename          | enterprisedb
application_name | pgbench
client_addr      |
client_hostname  |
client_port      | -1
backend_start    | 20-JUL-21 09:49:56.710785 +05:30
xact_start       | 20-JUL-21 09:52:18.941493 +05:30
query_start      | 20-JUL-21 09:52:18.941493 +05:30
state_change     | 20-JUL-21 09:52:18.941494 +05:30
wait_event_type  | IPC
wait_event       | ClogGroupUpdate
state            | active
backend_xid      | 4526421
backend_xmin     |
query            | select txid_current();
backend_type     | client backend
-[ RECORD 12 ]---+---------------------------------
datid            | 16384
datname          | enterprisedb
pid              | 27156
usesysid         | 10
usename          | enterprisedb
application_name | pgbench
client_addr      |
client_hostname  |
client_port      | -1
backend_start    | 20-JUL-21 09:49:56.711762 +05:30
xact_start       |
query_start      | 20-JUL-21 09:52:18.942582 +05:30
state_change     | 20-JUL-21 09:52:18.942704 +05:30
wait_event_type  | Client
wait_event       | ClientRead
state            | idle
backend_xid      |
backend_xmin     |
query            | select txid_current();
backend_type     | client backend
-[ RECORD 13 ]---+---------------------------------
datid            | 16384
datname          | enterprisedb
pid              | 27157
usesysid         | 10
usename          | enterprisedb
application_name | pgbench
client_addr      |
client_hostname  |
client_port      | -1
backend_start    | 20-JUL-21 09:49:56.711944 +05:30
xact_start       | 20-JUL-21 09:52:18.943345 +05:30
query_start      | 20-JUL-21 09:52:18.943345 +05:30
state_change     | 20-JUL-21 09:52:18.943346 +05:30
wait_event_type  | Client
wait_event       | ClientRead
state            | active
backend_xid      | 4526447
backend_xmin     | 1195
query            | select txid_current();
backend_type     | client backend
-[ RECORD 14 ]---+---------------------------------


SESSION 4:

Open another session to check log files, if they are reporting any hints, warnings or errors
After ~1 hour of test run, I have started seeing below warnings in the log files.

2021-07-19 20:15:26 IST LOG:  statement: select txid_current();
2021-07-19 20:15:26 IST WARNING:  oldest xmin is far in the past
2021-07-19 20:15:26 IST HINT:  Close open transactions soon to avoid wraparound problems.
        You might also need to commit or roll back old prepared transactions, or drop stale replication slots.
2021-07-19 20:15:26 IST LOG:  statement: select txid_current();

After ~ 3 hours of test run, the warnings becoming more prominent.

-bash-4.2$ grep -Rinw /var/lib/edb/as11/data/log/ -e 'wraparound'
/var/lib/edb/as11/data/log/edb-2021-07-19_195300.log:17711:2021-07-19 19:53:01 IST HINT:  Close open transactions soon to avoid wraparound problems.
/var/lib/edb/as11/data/log/edb-2021-07-19_195300.log:20705:2021-07-19 19:53:01 IST HINT:  Close open transactions soon to avoid wraparound problems.
/var/lib/edb/as11/data/log/edb-2021-07-19_195300.log:21160:2021-07-19 19:53:01 IST HINT:  Close open transactions soon to avoid wraparound problems.
/var/lib/edb/as11/data/log/edb-2021-07-19_195300.log:21650:2021-07-19 19:53:01 IST HINT:  Close open transactions soon to avoid wraparound problems.
/var/lib/edb/as11/data/log/edb-2021-07-19_195300.log:22179:2021-07-19 19:53:01 IST HINT:  Close open transactions soon to avoid wraparound problems.
/var/lib/edb/as11/data/log/edb-2021-07-19_195300.log:22694:2021-07-19 19:53:01 IST HINT:  Close open transactions soon to avoid wraparound problems.
/var/lib/edb/as11/data/log/edb-2021-07-19_195300.log:23229:2021-07-19 19:53:01 IST HINT:  Close open transactions soon to avoid wraparound problems.
/var/lib/edb/as11/data/log/edb-2021-07-19_195300.log:23776:2021-07-19 19:53:01 IST HINT:  Close open transactions soon to avoid wraparound problems.
/var/lib/edb/as11/data/log/edb-2021-07-19_195300.log:24316:2021-07-19 19:53:01 IST HINT:  Close open transactions soon to avoid wraparound problems.
/var/lib/edb/as11/data/log/edb-2021-07-19_195300.log:24840:2021-07-19 19:53:01 IST HINT:  Close open transactions soon to avoid wraparound problems.
/var/lib/edb/as11/data/log/edb-2021-07-19_195300.log:25391:2021-07-19 19:53:01 IST HINT:  Close open transactions soon to avoid wraparound problems.
/var/lib/edb/as11/data/log/edb-2021-07-19_195300.log:25927:2021-07-19 19:53:01 IST HINT:  Close open transactions soon to avoid wraparound problems.
/var/lib/edb/as11/data/log/edb-2021-07-19_195300.log:27533:2021-07-19 19:53:01 IST HINT:  Close open transactions soon to avoid wraparound problems.
/var/lib/edb/as11/data/log/edb-2021-07-19_195300.log:28135:2021-07-19 19:53:01 IST HINT:  Close open transactions soon to avoid wraparound problems.
/var/lib/edb/as11/data/log/edb-2021-07-19_195300.log:32986:2021-07-19 19:53:01 IST HINT:  Close open transactions soon to avoid wraparound problems.
/var/lib/edb/as11/data/log/edb-2021-07-19_195300.log:33581:2021-07-19 19:53:01 IST HINT:  Close open transactions soon to avoid wraparound problems.

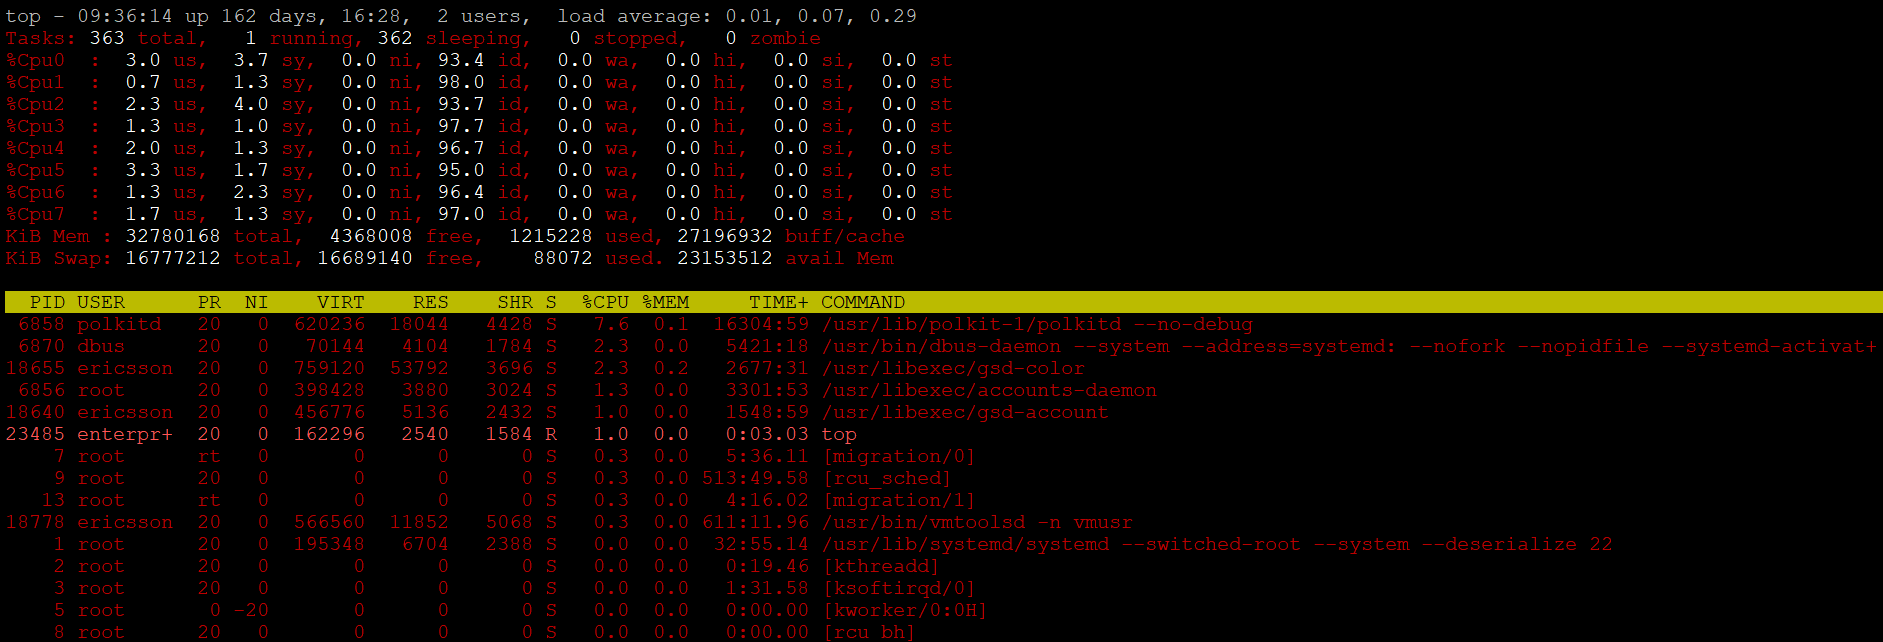
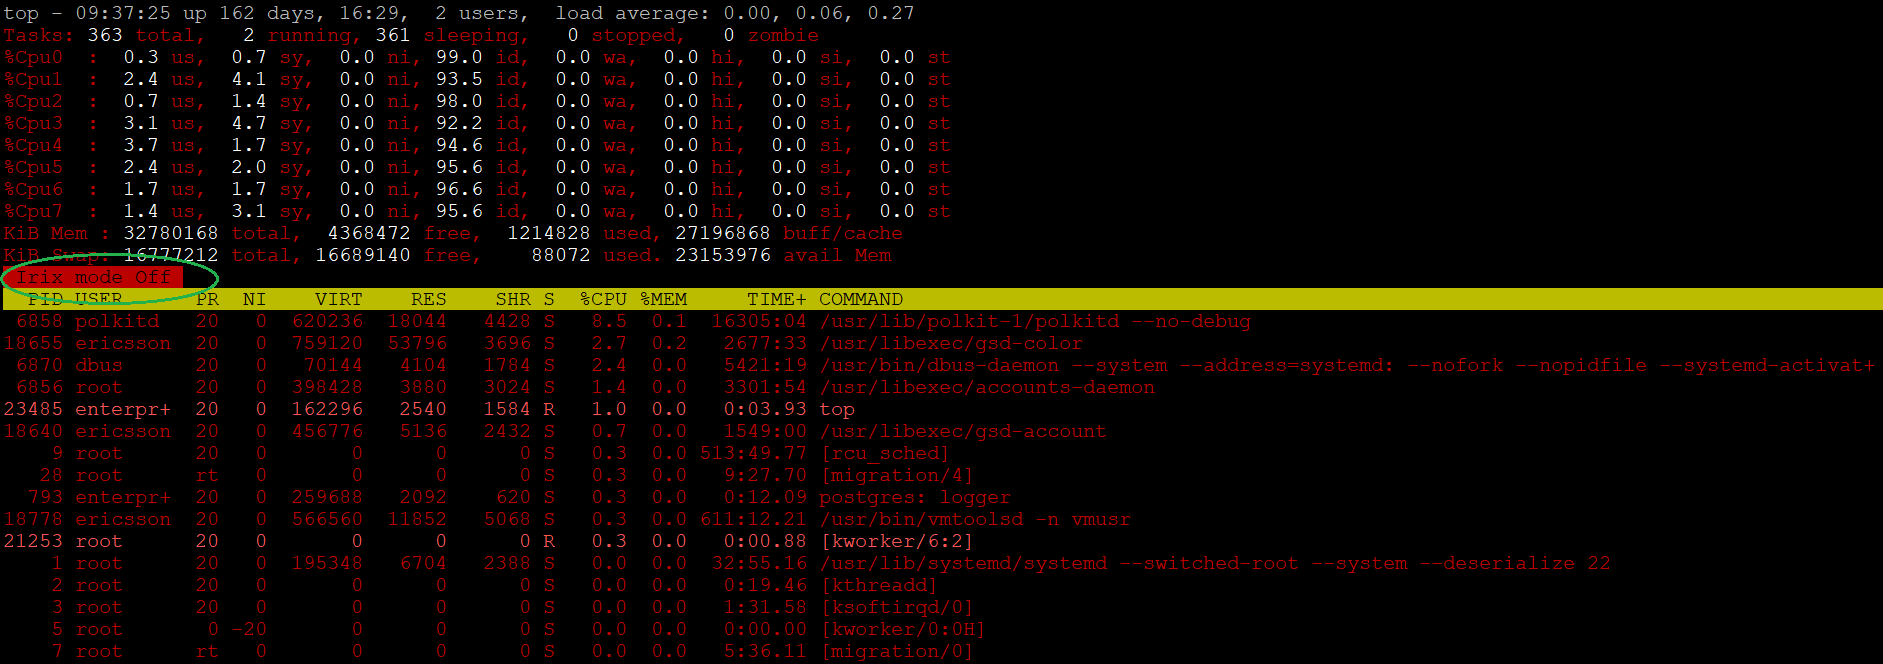
Now, let’s monitor system stats too to see overall load, processes their commands etc.

top - 00:19:39 up 159 days,  7:11,  6 users,  load average: 10.31, 9.97, 9.95
Tasks: 399 total,   9 running, 390 sleeping,   0 stopped,   0 zombie
%Cpu(s): 60.0 us, 38.4 sy,  0.0 ni,  1.6 id,  0.1 wa,  0.0 hi,  0.0 si,  0.0 st
KiB Mem : 32780168 total, 14568928 free,  1259976 used, 16951264 buff/cache
KiB Swap: 16777212 total, 16685044 free,    92168 used. 23083820 avail Mem

  PID USER      PR  NI    VIRT    RES    SHR S %CPU %MEM     TIME+ COMMAND
21831 enterpr+  20   0  591764   5228   2152 S 16.8  0.0 417:57.53 /usr/edb/as11/bin/pgbench -U enterprisedb enterprisedb -f wl.sql -c8 -j8 -T100000 -rn -P+
21845 enterpr+  20   0 8667644  24604  22256 R  9.7  0.1 209:53.07 postgres: enterprisedb enterprisedb [local] SELECT
21840 enterpr+  20   0 8667644  24584  22244 R  9.4  0.1 210:36.23 postgres: enterprisedb enterprisedb [local] idle
21844 enterpr+  20   0 8667644  24876  22528 R  9.4  0.1 209:38.54 postgres: enterprisedb enterprisedb [local] idle
21841 enterpr+  20   0 8667644  24836  22496 R  8.8  0.1 209:15.88 postgres: enterprisedb enterprisedb [local] SELECT
21847 enterpr+  20   0 8667644  24600  22252 S  8.8  0.1 206:16.87 postgres: enterprisedb enterprisedb [local] idle
21846 enterpr+  20   0 8667644  24604  22256 S  8.5  0.1 210:41.59 postgres: enterprisedb enterprisedb [local] idle
20421 enterpr+  20   0  259688   2124    632 R  7.1  0.0 146:27.66 postgres: logger
21843 enterpr+  20   0 8667644  24588  22248 R  6.6  0.1 210:05.38 postgres: enterprisedb enterprisedb [local] idle
21842 enterpr+  20   0 8667644  24600  22260 R  6.6  0.1 209:48.66 postgres: enterprisedb enterprisedb [local] idle
20426 enterpr+  20   0 8666684  18736  17208 R  4.0  0.1 102:43.53 postgres: walwriter
 6858 polkitd   20   0  620236  18044   4428 S  0.9  0.1  15940:23 /usr/lib/polkit-1/polkitd --no-debug

SESSION 2:

To my surprise, after ~8 hours of test run, the session screen where I have pgbench running, started throwing some WARNINGs to perform vacuum within specified number of transactions to avoid database shutdown. It kept on throwing those direct warnings for almost an hour before it stopped processing pgbench requests and started aborting workers with a message ‘ERROR: database is not accepting commands to avoid wraparound data loss in database “postgres”.

In the end it will present you the overall pgbench stats where it fired 2146483646 statements in total.

WARNING:  database "postgres" must be vacuumed within 5092920 transactions
HINT:  To avoid a database shutdown, execute a database-wide VACUUM in that database.
You might also need to commit or roll back old prepared transactions, or drop stale replication slots.
WARNING:  database "postgres" must be vacuumed within 5092920 transactions
HINT:  To avoid a database shutdown, execute a database-wide VACUUM in that database.
You might also need to commit or roll back old prepared transactions, or drop stale replication slots.
WARNING:  database "postgres" must be vacuumed within 5092917 transactions
HINT:  To avoid a database shutdown, execute a database-wide VACUUM in that database.
....
......
HINT:  To avoid a database shutdown, execute a database-wide VACUUM in that database.
You might also need to commit or roll back old prepared transactions, or drop stale replication slots.
WARNING:  database "postgres" must be vacuumed within 3178805 transactions
HINT:  To avoid a database shutdown, execute a database-wide VACUUM in that database.
You might also need to commit or roll back old prepared transactions, or drop stale replication slots.
WARNING:  database "postgres" must be vacuumed within 3178808 transactions
HINT:  To avoid a database shutdown, execute a database-wide VACUUM in that database.
You might also need to commit or roll back old prepared transactions, or drop stale replication slots.
WARNING:  database "postgres" must be vacuumed within 3178804 transactions
HINT:  To avoid a database shutdown, execute a database-wide VACUUM in that database.
You might also need to commit or roll back old prepared transactions, or drop stale replication slots.
WARNING:  database "postgres" must be vacuumed within 3178803 transactions
HINT:  To avoid a database shutdown, execute a database-wide VACUUM in that database.
You might also need to commit or roll back old prepared transactions, or drop stale replication slots.
WARNING:  database "postgres" must be vacuumed within 3178801 transactions
HINT:  To avoid a database shutdown, execute a database-wide VACUUM in that database.
You might also need to commit or roll back old prepared transactions, or drop stale replication slots.
WARNING:  database "postgres" must be vacuumed within 3178799 transactions
HINT:  To avoid a database shutdown, execute a database-wide VACUUM in that database.
......
........
You might also need to commit or roll back old prepared transactions, or drop stale replication slots.
WARNING:  database "postgres" must be vacuumed within 1000002 transactions
HINT:  To avoid a database shutdown, execute a database-wide VACUUM in that database.
You might also need to commit or roll back old prepared transactions, or drop stale replication slots.
WARNING:  database "postgres" must be vacuumed within 1000002 transactions
HINT:  To avoid a database shutdown, execute a database-wide VACUUM in that database.
You might also need to commit or roll back old prepared transactions, or drop stale replication slots.
client 0 aborted in command 0 (SQL) of script 0; ERROR:  database is not accepting commands to avoid wraparound data loss in database "postgres"
HINT:  Stop the postmaster and vacuum that database in single-user mode.
You might also need to commit or roll back old prepared transactions, or drop stale replication slots.

client 1 aborted in command 0 (SQL) of script 0; ERROR:  database is not accepting commands to avoid wraparound data loss in database "postgres"
HINT:  Stop the postmaster and vacuum that database in single-user mode.
You might also need to commit or roll back old prepared transactions, or drop stale replication slots.

client 7 aborted in command 0 (SQL) of script 0; ERROR:  database is not accepting commands to avoid wraparound data loss in database "postgres"
HINT:  Stop the postmaster and vacuum that database in single-user mode.
You might also need to commit or roll back old prepared transactions, or drop stale replication slots.

client 6 aborted in command 0 (SQL) of script 0; ERROR:  database is not accepting commands to avoid wraparound data loss in database "postgres"
HINT:  Stop the postmaster and vacuum that database in single-user mode.
You might also need to commit or roll back old prepared transactions, or drop stale replication slots.

client 2 aborted in command 0 (SQL) of script 0; ERROR:  database is not accepting commands to avoid wraparound data loss in database "postgres"
HINT:  Stop the postmaster and vacuum that database in single-user mode.
You might also need to commit or roll back old prepared transactions, or drop stale replication slots.

client 4 aborted in command 0 (SQL) of script 0; ERROR:  database is not accepting commands to avoid wraparound data loss in database "postgres"
HINT:  Stop the postmaster and vacuum that database in single-user mode.
You might also need to commit or roll back old prepared transactions, or drop stale replication slots.

WARNING:  database "postgres" must be vacuumed within 1000005 transactions
HINT:  To avoid a database shutdown, execute a database-wide VACUUM in that database.
You might also need to commit or roll back old prepared transactions, or drop stale replication slots.
client 3 aborted in command 0 (SQL) of script 0; ERROR:  database is not accepting commands to avoid wraparound data loss in database "postgres"
HINT:  Stop the postmaster and vacuum that database in single-user mode.
You might also need to commit or roll back old prepared transactions, or drop stale replication slots.

client 5 aborted in command 0 (SQL) of script 0; ERROR:  database is not accepting commands to avoid wraparound data loss in database "postgres"
HINT:  Stop the postmaster and vacuum that database in single-user mode.
You might also need to commit or roll back old prepared transactions, or drop stale replication slots.

transaction type: wl.sql
scaling factor: 1
query mode: simple
number of clients: 8
number of threads: 8
duration: 100000 s
number of transactions actually processed: 2146483646
latency average = 0.159 ms
latency stddev = 1.102 ms
tps = 50437.366776 (including connections establishing)
tps = 50437.386645 (excluding connections establishing)
statement latencies in milliseconds:
         0.171  select txid_current();
You have new mail in /var/spool/mail/enterprisedb
-bash-4.2$

SESSION 3:

Lets check our screen 3 to see where we are in terms on oldest current XID and percent towards wraparound, and I see XID numbers are not increasing and we have reached 107% towards wraparound (strange, why it goes beyond 100%).

enterprisedb=# WITH max_age AS ( 
    SELECT 2000000000 as max_old_xid
        , setting AS autovacuum_freeze_max_age 
        FROM pg_catalog.pg_settings 
        WHERE name = 'autovacuum_freeze_max_age' )
, per_database_stats AS ( 
    SELECT datname
        , m.max_old_xid::int
        , m.autovacuum_freeze_max_age::int
        , age(d.datfrozenxid) AS oldest_current_xid 
    FROM pg_catalog.pg_database d 
    JOIN max_age m ON (true) 
    WHERE d.datallowconn ) 
SELECT max(oldest_current_xid) AS oldest_current_xid
    , max(ROUND(100*(oldest_current_xid/max_old_xid::float))) AS percent_towards_wraparound
    , max(ROUND(100*(oldest_current_xid/autovacuum_freeze_max_age::float))) AS percent_towards_emergency_autovac 
FROM per_database_stats;

(1 row)
                     Tue 20 Jul 2021 06:57:51 AM IST (every 10s)

 oldest_current_xid | percent_towards_wraparound | percent_towards_emergency_autovac
--------------------+----------------------------+-----------------------------------
         2146483647 |                        107 |                              1073
(1 row)


                     Tue 20 Jul 2021 06:58:01 AM IST (every 10s)

 oldest_current_xid | percent_towards_wraparound | percent_towards_emergency_autovac
--------------------+----------------------------+-----------------------------------
         2146483647 |                        107 |                              1073
(1 row)


enterprisedb=# SELECT datname
, age(datfrozenxid)
, current_setting('autovacuum_freeze_max_age')
FROM pg_database
 ORDER BY 2 DESC;

   datname    |    age     | current_setting
--------------+------------+-----------------
 postgres     | 2146483647 | 200000000
 edb          | 2146483647 | 200000000
 template1    | 2146483647 | 200000000
 template0    | 2146483647 | 200000000
 immortal     | 2146483647 | 200000000
 darkthrone   | 2146483647 | 200000000
 immortal1    | 2146483647 | 200000000
 mayhem       | 2146483647 | 200000000
 murduk       | 2146483647 | 200000000
 burzum       | 2146483647 | 200000000
 gorgoroth    | 2146483647 | 200000000
 repmgr       | 2146483647 | 200000000
 enterprisedb | 2146483647 | 200000000
(13 rows)

Let’s connect with the database and see what happens when we try to do both SELECT & UPDATE statements …

enterprisedb=# \dt+
                            List of relations
 Schema |       Name       | Type  |    Owner     |  Size   | Description
--------+------------------+-------+--------------+---------+-------------
 public | pgbench_accounts | table | enterprisedb | 13 MB   |
 public | pgbench_branches | table | enterprisedb | 40 kB   |
 public | pgbench_history  | table | enterprisedb | 40 kB   |
 public | pgbench_tellers  | table | enterprisedb | 40 kB   |
 public | scale_data       | table | enterprisedb | 6720 MB |
(5 rows)

enterprisedb=# select * from pgbench_history;
 tid | bid |  aid  | delta |           mtime           | filler
-----+-----+-------+-------+---------------------------+--------
   2 |   1 | 64444 | -1096 | 19-JUL-21 18:41:15.655738 |
   3 |   1 | 18460 | -4688 | 19-JUL-21 18:41:15.668699 |
   2 |   1 | 92762 | -4669 | 19-JUL-21 18:41:15.670741 |
   2 |   1 | 55081 |  1817 | 19-JUL-21 18:41:15.672719 |
   5 |   1 | 47743 |   803 | 19-JUL-21 18:41:15.674666 |
   5 |   1 | 23899 | -3910 | 19-JUL-21 18:41:15.67664  |
  10 |   1 | 33384 |  4005 | 19-JUL-21 18:41:15.678631 |
   6 |   1 | 88383 | -4257 | 19-JUL-21 18:41:15.680629 |
   8 |   1 | 87562 |   200 | 19-JUL-21 18:41:15.682612 |
   5 |   1 |  3957 | -2407 | 19-JUL-21 18:41:15.684595 |
(10 rows)

enterprisedb=#
enterprisedb=# update pgbench_history set aid=65555 where aid=64444;
ERROR:  database is not accepting commands to avoid wraparound data loss in database "postgres"
HINT:  Stop the postmaster and vacuum that database in single-user mode.
You might also need to commit or roll back old prepared transactions, or drop stale replication slots.
enterprisedb=#
enterprisedb=#
enterprisedb=#

Alright, so with transaction wraparound is already there, we only be able to run SELECT queries, but DMLS will fail with a message printed to stop the database and vacuum it in single-user mode.

So, what we have learned

  • Database will keep on running and accepting READ ONLY (SELECT) requests, error will be thrown in case if DMLs tried.
  • 2,000,000,000 seems a huge number, but in case of busy transactional database, it’s just a matter of few hours.
  • AUTOVACUUMING is good thing, at least for this scenario, let’s not discuss about its bugs and other problems.
  • Add VACUUMING a routine activity else you will soon find yourself in a big mess.

The easiest way to get the highest TXID age value back down is to force a vacuum on the entire database cluster. And the best way to do this cluster-wide vacuum is the vacuumdb binary utility that comes with PostgreSQL. I will cover it in my next post as this post is all about simulating wraparounds.

Hope It Helped!
Prashant Dixit

Posted in Advanced, troubleshooting | Tagged: , , | 7 Comments »

New names to RecoveryWalAll and RecoveryWalStream wait events in PostgreSQL 13

Posted by FatDBA on July 9, 2021

Hi Guys,

Recently while working on PostgreSQL Version 13 I have identified few new changes related with the wait events, particularly related with recovery in order to make the names and what they are more consistent.

For all who are new to events, they can tell you a lot about query and system performance, specially scenarios like .. why a query isn’t making progress ? – One example of a wait event may be IO / DataFileRead, which points that a process is currently waiting for data to be read from disk or the page cache.

So, talking about those waits, first one is event ‘RecoveryWalAll‘ which tells recovery is waiting for WAL from a stream, that could be from any kind of source i.e. local, archive or stream, is now changed to ‘RecoveryWalStream’.

Another one is ‘RecoveryWalStream‘ which can help you to make sure that each standby does not have more WAL to replay or helps to identify what is waiting for WAL from a stream at recovery, is now changed/renamed to RecoveryRetrieveRetryInterval. I have also noticed a change in event class or category of RecoveryRetrieveRetryInterval to Timeout from Activity.

Hope It Helps
Prashant Dixit

Posted in Advanced, troubleshooting | Tagged: , , | Leave a Comment »

Quarantine a SQL ? This can save from a system performance pandemic …

Posted by FatDBA on July 6, 2021

Hi Guys,

Last weekend I was asked to examine a performance problem where customer was observing sporadic resource spikes on CPU & PIOs (Physical IO scans), and had no idea how to handle the situation. They already have identified the problematic SQL and asked me to take a look, while doing initial investigation on the system, I found the resource manager was enabled and was killing the ill SQL every time when it tries to breach the limits set on CPU & other resources.

I spent some time understanding query behavior and performance, and I found this a scenario of SQL plan (PHV) flip where the query optimizer toggles between a good and a worst plan. This being a time sensitive issue and customer needs a quick fix before I identify the reason behind the PHV flip, we have to think of any technique on how we can stop the SQL execution with bad PHVs. This was an Oracle EE 19c system running on Exadata, I immediately proposed for a solution using new feature of ‘SQL Quarantine‘, which helps to prevent reuse of same execution plan which was terminated by resource managers due to resource limits.

Let me show you how to do that, here I will demonstrate how to quarantine a SQL & all its execution plans.

Well this is just a use case, you can also quarantine the SQL for all its PHVs or execution plans or even through the SQL Text. Here I will show how you can quarantine a SQL for all its execution plans.

Note: This feature is currently available only on Enterprise Edition on Engineered Systems, like Exadata and Exadata Cloud Service, but for this demo, I will be enabling the ‘_exadata_feature_on‘ parameter for demo purposes on my sandbox setup.

** Please don’t touch this parameter in your production environments if you’re not running on Oracle EE on the top of Exadata or Exadata Cloud services.

[oracle@canttowinsec ~]$ !sql
sqlplus / as sysdba

SQL*Plus: Release 19.0.0.0.0 - Production on Sat Jul 3 23:33:41 2021
Version 19.3.0.0.0

Copyright (c) 1982, 2019, Oracle.  All rights reserved.


SQL>
SQL> @hidden
Enter value for param: exadata_feature_on
old   5:    and a.ksppinm like '%&param%'
new   5:    and a.ksppinm like '%exadata_feature_on%'

Parameter                                     Session Value             Instance Value            descr
--------------------------------------------- ------------------------- ------------------------- ------------------------------------------------------------
_exadata_feature_on                           FALSE                     FALSE                     Exadata Feature On

SQL>
SQL>


SQL> shut immediate
Database closed.
Database dismounted.
ORACLE instance shut down.
SQL>
SQL>


SQL> startup
ORACLE instance started.

Total System Global Area  922745216 bytes
Fixed Size                  8903040 bytes
Variable Size             843055104 bytes
Database Buffers           67108864 bytes
Redo Buffers                3678208 bytes
Database mounted.
Database opened.
SQL>
SQL>
SQL>


SQL>
SQL> @hidden
Enter value for param: exadata_feature_on
old   5:    and a.ksppinm like '%&param%'
new   5:    and a.ksppinm like '%exadata_feature_on%'

Parameter                                     Session Value             Instance Value            descr
--------------------------------------------- ------------------------- ------------------------- ------------------------------------------------------------
_exadata_feature_on                           TRUE                      TRUE                      Exadata Feature On

SQL>


-- For this demo I have created one table with 1000000 rows. 

SQL> select count(*) from bigtab;

  COUNT(*)
----------
   1000000

Next check the SQLID, PHV and TEXT of the SQL for which you want to setup this QUARANTINE feature and will create the quarantine configuration for it. You can set it for SQL ID, SQL ID + PHV or for SQL TEXT.

SQL> select sql_id, plan_hash_value, sql_text from v$sqlarea where sql_text like '%select * from bigtab%';

SQL_ID        PLAN_HASH_VALUE
------------- ---------------
SQL_TEXT
--------------------------------------------------------------------------------------------------------------------------------------------------------------------------------------------------------
6fwqzurbc8y7k       441133017
select * from bigtab

SQL>


-- You can create CREATE_QUARANTINE BY SQL_ID 
quarantine_config := DBMS_SQLQ.CREATE_QUARANTINE_BY_SQL_ID(SQL_ID => '&sql_id')
quarantine_config := DBMS_SQLQ.CREATE_QUARANTINE_BY_SQL_ID(SQL_ID => '&sql_id', PLAN_HASH_VALUE => '&PLAN_HASH_VALUE');

-- You can create CREATE_QUARANTINE_BY_SQL_TEXT.
quarantine_config := DBMS_SQLQ.CREATE_QUARANTINE_BY_SQL_TEXt(SQL_TEXT => to_clob('select count(*) from emp'));


-- This command creates a quarantine configuration for SQL ID '6fwqzurbc8y7k' and all its execution plans.
SQL>
SQL> DECLARE
quarantine_sql VARCHAR2(30);
BEGIN
quarantine_sql :=   DBMS_SQLQ.CREATE_QUARANTINE_BY_SQL_ID(SQL_ID => '6fwqzurbc8y7k');
END;
/  

PL/SQL procedure successfully completed.

SQL>


-- Check if quarantine config/profile is created.

SQL> select NAME, SQL_TEXT, ELAPSED_TIME, cpu_time,CREATED, ENABLED from dba_sql_quarantine;


NAME                           SQL_TEXT                       ELAPSED_TIME         CPU_TIME                       CREATED                        ENA
------------------------------ ------------------------------ -------------------- ------------------------------ ------------------------------ ---
SQL_QUARANTINE_2akx3bq44wvc5   select * from bigtab           ALWAYS               ALWAYS                         04-JUL-21 12.09.25.567422 AM   YES


Now next we will use the DBMS_SQLQ.ALTER_QUARANTINE procedure to put limits on resource usage i.e. Elapsed time, CPU, IO (MBs), Number of physical (PIOs) requests, Number of logical (LIOs) requests.

SQL>
SQL> BEGIN
    DBMS_SQLQ.ALTER_QUARANTINE(
       QUARANTINE_NAME => 'SQL_QUARANTINE_2akx3bq44wvc5',
       PARAMETER_NAME  => 'CPU_TIME',
       PARAMETER_VALUE => '5');

    DBMS_SQLQ.ALTER_QUARANTINE(
       QUARANTINE_NAME => 'SQL_QUARANTINE_2akx3bq44wvc5',
       PARAMETER_NAME  => 'ELAPSED_TIME',
       PARAMETER_VALUE => '10');
END;
/  2    3    4    5    6    7    8    9   10   11   12

PL/SQL procedure successfully completed.

SQL>


-- let's verify limits that we have set against this SQL Quarantine profile.

NAME                           SQL_TEXT                       ELAPSED_TIME         CPU_TIME                       CREATED                        ENA
------------------------------ ------------------------------ -------------------- ------------------------------ ------------------------------ ---
SQL_QUARANTINE_2akx3bq44wvc5   select * from bigtab           10                   5                              04-JUL-21 12.12.41.918609 AM   YES

Next we will setup the RESOURCE MANAGER.

-- Create a pending area.
SQL> begin
 dbms_resource_manager.create_pending_area();
 end;
 /  2    3    4

PL/SQL procedure successfully completed.

-- Create a consumer group with name 'DIXITPOC_GROUP'.
SQL> begin
 dbms_resource_manager.create_consumer_group(CONSUMER_GROUP=>'DIXITPOC_GROUP',COMMENT=>'To test SQL quarantine feature for one SQL');
 end;
 /  2    3    4

PL/SQL procedure successfully completed.


-- Now bind the consumer group with the user 'DIXIT', I mean this could be any group through which you will execute the query.
SQL> begin
 dbms_resource_manager.set_consumer_group_mapping(attribute => 'ORACLE_USER',value => 'DIXIT',consumer_group =>'DIXITPOC_GROUP' );
 end;
  /  2    3    4

PL/SQL procedure successfully completed.


-- Create a resource plan with name 'POC_FOR_QUARANTINE'.
SQL> begin
dbms_resource_manager.create_plan(plan => 'POC_FOR_QUARANTINE',comment => 'Kill SQL and its other execution plans when exceeding CPU and Elapsed seconds');
end;
/  2    3    4

PL/SQL procedure successfully completed.


-- Create a plan directive by allocating resource plan 'POC_FOR_QUARANTINE' to consumer group 'DIXITPOC_GROUP'. I am setting execution limit of 5 seconds for the SQL.
SQL> begin
 dbms_resource_manager.create_plan_directive(
 plan => 'POC_FOR_QUARANTINE',
 group_or_subplan => 'DIXITPOC_GROUP',
 comment => 'Kill SQL and its other execution plans when exceeding CPU and Elapsed seconds',
 switch_group=>'CANCEL_SQL',
 switch_time => 5,
 switch_estimate=>false);
 end;
 /  2    3    4    5    6    7    8    9   10

PL/SQL procedure successfully completed.


-- Allocate full resources to rest of the sessions which are not part of this plan.
SQL> begin
 dbms_resource_manager.create_plan_directive(PLAN=> 'POC_FOR_QUARANTINE', GROUP_OR_SUBPLAN=>'OTHER_GROUPS',COMMENT=>'leave rest as is');
 end;
 /  2    3    4

PL/SQL procedure successfully completed.


-- Validate and submit pending area.
SQL> begin
 dbms_resource_manager.validate_pending_area();
 end;
 /  2    3    4

PL/SQL procedure successfully completed.

SQL> begin
 dbms_resource_manager.submit_pending_area();
 end;
 /  2    3    4

PL/SQL procedure successfully completed.

SQL>


-- Grant switch privilege to the DIXIT user which will switch it to 'DIXITPOC_GROUP' group.
SQL> begin
dbms_resource_manager_privs.grant_switch_consumer_group('DIXIT','DIXITPOC_GROUP',false);
end;
/  2    3    4

PL/SQL procedure successfully completed.

-- Create initial consumer group for DIXIT user for 'DIXITPOC_GROUP' group.
SQL> begin
dbms_resource_manager.set_initial_consumer_group('DIXIT','DIXITPOC_GROUP');
end;
/  2    3    4

PL/SQL procedure successfully completed.

SQL>

Next set the resource manager at the database level, we will have to set the RESOURCE_MANAGER_PLAN to value or name of the plan ‘POC_FOR_QUARANTINE’.

SQL> show parameter resource

NAME                                 TYPE        VALUE
------------------------------------ ----------- ------------------------------
resource_limit                       boolean     TRUE
resource_manage_goldengate           boolean     FALSE
resource_manager_cpu_allocation      integer     5
resource_manager_plan                string
SQL> 


SQL> alter DIXITtem set RESOURCE_MANAGER_PLAN = 'POC_FOR_QUARANTINE';
DIXITtem altered.

SQL> show parameter resource

NAME                                 TYPE        VALUE
------------------------------------ ----------- ------------------------------
resource_limit                       boolean     TRUE
resource_manage_goldengate           boolean     FALSE
resource_manager_cpu_allocation      integer     5
resource_manager_plan                string      POC_FOR_QUARANTINE
SQL>

Execute the SQL for the first time, you will get ‘active time limit exceeded’ due to RM.

SQL>
SQL> select * from emp;

ERROR at line 2:
ORA-00040: active time limit exceeded - call aborted

Now, if you run the SQL for the second time, you will see your quarantine plan/profile will be used and will abort the execution of the SQL.

SQL>
SQL> select * from emp;

ERROR at line 2:
ORA-56955: quarantined plan used

Hope It Helped
Prashant Dixit

Posted in Advanced, troubleshooting | Tagged: , , , , | 1 Comment »