Many of you might be thinking after reading the title – Why to write about such a simple or rudimentary task, what is so tricky about installing EDB PostgreSQL software ? I know it’s quite easy and straight forward, but only if you are able to add the EDB repository to your server or register it, if you fail to add or register it, then it will be very difficult and becomes a tedious and a time consuming activity to install all of the software’s and their long list of dependencies. This post is all about how to deal with such situation, how to download the source RPMs and install them on the server if you are not able to add the EDB repository.
First step is to download the complete EDB’s tarball, I am downloading the complete tarball here as I don’t want to miss any dependent packages which are needed by the core components. This tarball is close to 1.8 GBs in size, you can download the file using below wget command, here you need to use your EDB credentials.
Now, once the tarball is installed, we can go and create the YUM local repository, though to create YUM repository is optional as you can also install RPMs directly, but will make your work lot easier otherwise you have to look out for dependencies manually. So, I have deceided to create the local repository here.
Once the above file is downloaded, unzip it. You will see list of all core and dependent packages/rpm, just like below.
Next I will create a directory which will be used as a repository container. [root@canttowin edb]# mkdir -p /home/user/repo
move all unzipped files/rpms to this new directory. [root@canttowin edb]# mv * /home/user/repo
change permissions of the directory. [root@canttowin edb]# chown -R root.root /home/user/repo [root@canttowin edb]# chmod -R o-w+r /home/user/repo
Now we can go and create the repository, for that we will use ‘createrepo‘ command. [root@canttowin edb]# createrepo /home/user/repo Spawning worker 0 with 1151 pkgs Workers Finished Saving Primary metadata Saving file lists metadata Saving other metadata Generating sqlite DBs Sqlite DBs complete
Now let’s create the YUM repository entry under /etc/yum.repos.d [root@canttowin edb]# more /etc/yum.repos.d/myrepo.repo [local] name=Prashant Local EDB Repo baseurl=file:///home/user/repo enabled=1 gpgcheck=0 [root@canttowin edb]#
All set! let’s try to look for any EDB’s package using this new local repository
[root@canttowin ~]# yum search edb-as12-server
Loaded plugins: langpacks, ulninfo
=============================================================== N/S matched: edb-as12-server ================================================================
edb-as12-server.x86_64 : EnterpriseDB Advanced Server Client and Server Components
edb-as12-server-client.x86_64 : The client software required to access EDBAS server.
edb-as12-server-cloneschema.x86_64 : cloneschema is a module for EnterpriseDB Advanced Server
edb-as12-server-contrib.x86_64 : Contributed source and binaries distributed with EDBAS
edb-as12-server-core.x86_64 : The core programs needed to create and run a EnterpriseDB Advanced Server
edb-as12-server-devel.x86_64 : EDBAS development header files and libraries
edb-as12-server-docs.x86_64 : Extra documentation for EDBAS
edb-as12-server-edb-modules.x86_64 : EDB-Modules for EnterpriseDB Advanced Server
edb-as12-server-indexadvisor.x86_64 : Index Advisor for EnterpriseDB Advanced Server
edb-as12-server-libs.x86_64 : The shared libraries required for any EDBAS clients
edb-as12-server-llvmjit.x86_64 : Just-In-Time compilation support for EDBAS
edb-as12-server-parallel-clone.x86_64 : parallel_clone is a module for EnterpriseDB Advanced Server
edb-as12-server-pldebugger.x86_64 : PL/pgSQL debugger server-side code
edb-as12-server-plperl.x86_64 : The Perl procedural language for EDBAS
edb-as12-server-plpython.x86_64 : The Python procedural language for EDBAS
edb-as12-server-plpython3.x86_64 : The Python3 procedural language for EDBAS
edb-as12-server-pltcl.x86_64 : The Tcl procedural language for EDBAS
edb-as12-server-sqlprofiler.x86_64 : SQL profiler for EnterpriseDB Advanced Server
edb-as12-server-sqlprotect.x86_64 : SQL Protect for EnterpriseDB Advanced Server
Great, so we are now able to look and install all our EDB packages through YUM, it’s lot easier than manually fixing dependencies and install core packages.
Today’s post will be all about monitoring your PostgreSQL database clusters using EDB PostgreSQL Enterprise Manager (PEM). Postgres Enterprise Manager is a comprehensive, customizable solution providing an interface to control and optimize your PostgreSQL deployment.
I will be doing the installation, configuration, adding servers to the console and will perform a live monitoring of the database while I will be generating some synthetic load on the database host. I am doing this on a standalone RHEL 7 64 Bit server which I will be using it both as a PEM server and local instance. Alright, so without further ado, lets start. So, first you need to download EDB’s official repository and install following package.
Below is a complete list of packages available with name ‘edb-pem’, you need to install version: edb-pem-8.0.1-1.rhel7.x86_64
=================================================================== N/S matched: edb-pem ====================================================================
edb-pem-debuginfo.x86_64 : Debug information for package edb-pem
edb-pem.x86_64 : PostgreSQL Enterprise Manager
edb-pem-agent.x86_64 : Postgres Enterprise Manager Agent
edb-pem-docs.x86_64 : Documentation for Postgres Enterprise Manager
edb-pem-server.x86_64 : PEM Server Components
Once installation is completed, go to the default installation directory, it’s /usr/edb in my case, and go to pem/bin folder.
[root@canttowin ~]# cd /usr/edb/
[root@canttowin edb]# ls
as12 bart efm-4.1 jdbc migrationtoolkit pem pgbouncer1.15 pgpool4.2
[root@canttowin ~]# cd /usr/edb/pem/bin/
[root@canttowin bin]# ls
configure-pem-server.sh configure-selinux.sh
We see two configuration shell scripts are present, we will be using the configuration script – configure-pem-server.sh Here I will be choosing option 1 which means I will be installing web services and databases all on one host, next you need to input installation path (/usr/edb/as12 in my case), followed by super user name, port numbers and IP Address of the server.
Before I call the config script, let me quickly reset the default superuser’s password.
postgres=# alter user postgres with password 'dixit';
ALTER ROLE
Now, let’s call the configuration scipt and pass all discussed values.
[root@canttowin bin]# ./configure-pem-server.sh
-----------------------------------------------------
EDB Postgres Enterprise Manager
-----------------------------------------------------
Install type: 1:Web Services and Database, 2:Web Services 3: Database [ ] :1
Enter local database server installation path (i.e. /usr/edb/as12 , or /usr/pgsql-12, etc.) [ ] :/usr/edb/as12
Enter database super user name [ ] :enterprisedb
Enter database server port number [ ] :5444
Enter database super user password [ ] :
Please enter CIDR formatted network address range that agents will connect to the server from, to be added to the server's pg_hba.conf file. For example, 192.168.1.0/24 [ 0.0.0.0/0 ] :10.0.0.153/32
Enter database systemd unit file or init script name (i.e. edb-as-12 or postgresql-12, etc.) [ ] :edb-as-12Please specify agent certificate path (Script will attempt to create this directory, if it does not exists) [ ~/.pem/ ] :
CREATE EXTENSION
[Info] Configuring database server.
CREATE DATABASE
CREATE ROLE
CREATE ...
..
..
..
CREATE EXTENSION
--> [Info] --> [Info] Configuring database server.
--> [Info] --> [Info] creating role pem
--> [Info] --> [Info] Generating certificates
--> [Info] --> [Info] Executing systemctl stop edb-as-12
--> [Info] --> [Info] Skipping - configurations for /var/lib/edb/as12/data/pg_hba.conf and /var/lib/edb/as12/data/postgresql.conf file
--> [Info] --> [Info] Executing systemctl start edb-as-12
--> [Info] --> [Info] Enable pemagent service.
--> [Info] --> [Info] Executing systemctl enable pemagent
--> [Info] --> [Info] Stop pemagent service
--> [Info] --> [Info] Executing systemctl stop pemagent
--> [Info] --> [Info] Start pemagent service.
--> [Info] --> [Info] Executing systemctl start pemagent
--> [Info] --> [Info] Configuring httpd server
--> [Info] --> [Info] Executing systemctl stop httpd
--> [Info] --> [Info] Taking backup of /usr/edb/pem/web/pem.wsgi
--> [Info] --> [Info] Creating /usr/edb/pem/web/pem.wsgi
--> [Info] --> [Info] Taking backup of /usr/edb/pem/web/config_local.py.
--> [Info] --> [Info] Generating PEM Cookie Name.--> [Info] --> [Info] Creating /usr/edb/pem/web/config_local.py
--> [Info] --> [Info] Taking backup of /etc/httpd/conf.d/edb-pem.conf
--> [Info] --> [Info] Creating /etc/httpd/conf.d/edb-pem.conf
--> [Info] --> [Info] Configuring httpd server sslconf
--> [Info] --> [Info] Taking backup of /etc/httpd/conf.d/edb-ssl-pem.conf
--> [Info] --> [Info] Taking backup of /etc/httpd/conf.d/edb-ssl-pem.conf
--> [Info] --> [Info] Executing /usr/edb/pem/web/setup.py
Postgres Enterprise Manager - Application Initialisation
========================================================
--> [Info] --> [Info] Check and Configure SELinux security policy for PEM
getenforce found, now executing 'getenforce' command
Configure the httpd to work with the SELinux
Allow the httpd to connect the database (httpd_can_network_connect_db = on)
Allow the httpd to connect the network (httpd_can_network_connect = on)
Allow the httpd to work with cgi (httpd_enable_cgi = on)
Allow to read & write permission on the 'pem' user home directory
SELinux policy is configured for PEM
--> [Info] --> [Info] Executing systemctl start httpd
--> [Info] --> [Info] Configured the webservice for EDB Postgres Enterprise Manager (PEM) Server on port '8443'.
--> [Info] --> [Info] PEM server can be accessed at https://127.0.0.1:8443/pem at your browser
It’s completed, and at the very end it has provided URL to access the PEM GUI.
Now next step is to install PEM Agents to the server, you need to install it on all servers which you want to monitor, I am leaving the PEMAgents configuration that you do in agent.cfg file.
[root@canttowin bin]# yum install edb-pem-agent
Let’s check the PEM GUI now.
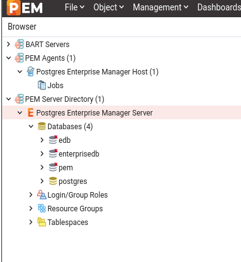
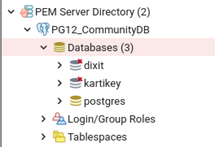
Here on the left panel you will notice there’s already one database present under ‘PEM Server Directory’ folder, this is the same database which we have configured/used PEM server, hence it will be automatically added to the server list. We will manually add one more database cluster to explain how to do it explicitly.
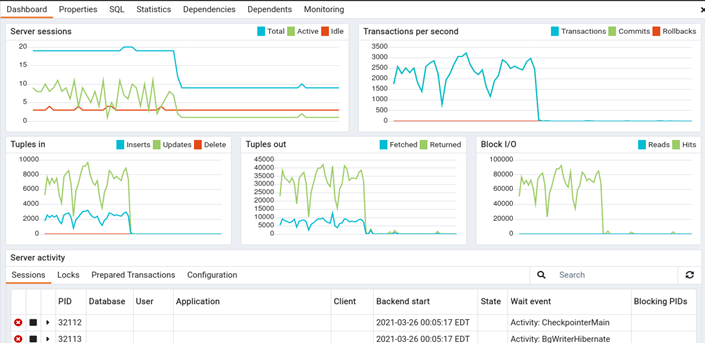
Let’s check the dashboard for the same (PEM Server) database for session, TPS, IO related details.
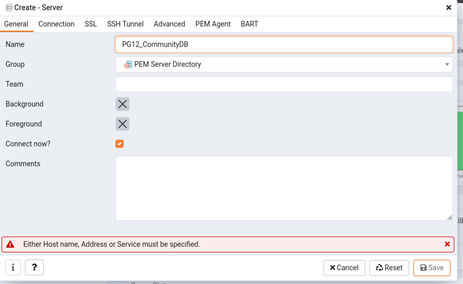
Now, let’s add another database to the monitoring console. I will be adding a community PostgreSQL 12 database to it. Go to ‘PEM Server Directory’ folder right click on it, choose option create-> server.
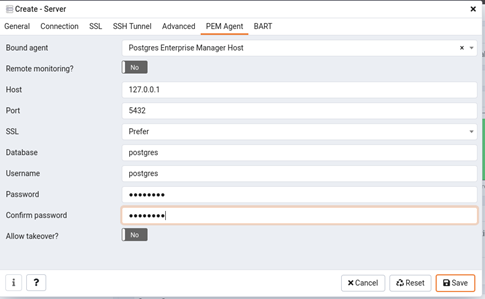
Next, fill connection wizard with all details i.e, username, password, IP, port and security related details for the new database and click save at the end.
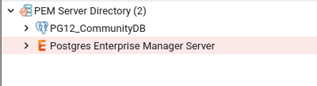
And you are done!
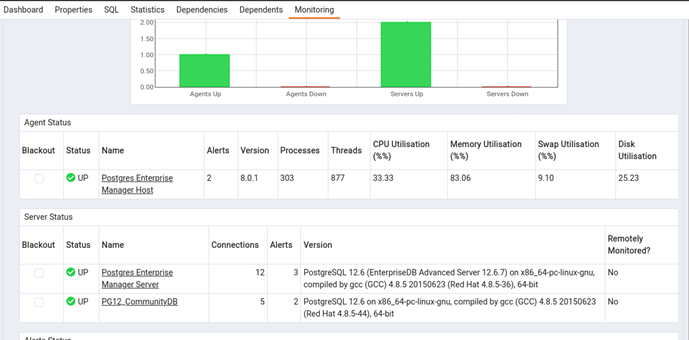
Now, let’s see the default landing page of PEM GUI and here you see details of all added hosts and agents with their status.
Next I will create some new databases to see how that data reflects in PEM GUI. postgres=# postgres=# create database dixit; CREATE DATABASE postgres=# create database kartikey; CREATE DATABASE
All good! now let’s do some performance test to see how useful PEM can be in case of performance issues. In order to mimic or simulate the situation, I will generating some synthetic load using PostgreSQL’s default utility Pgbench.
Reference: -c number of clients -j 2 number of threads -t amount of transactions
These values are 10000 transactions per client. So : 10 x 10000 = 100,000 transactions
Let’s see how the changes are captured and presented in PEM.
Okay, we can see the peaks are recorded and presented.
The load is still running and we can clearly see that from the below graph.
[postgres@canttowin bin]$ ./pgbench -U postgres -p 5432 -c 10 -j 2 -t 10000 postgres starting vacuum…end.transaction type: scaling factor: 1 query mode: simple number of clients: 10 number of threads: 2 number of transactions per client: 10000 number of transactions actually processed: 100000/100000 latency average = 18.217 ms tps = 548.940142 (including connections establishing) tps = 548.970173 (excluding connections establishing)
Alright, so the load run has ended, let see how the graph now looks like.
So to conclude, PEM is a great tool which can fulfil all your monitoring needs, it has got some cool features too i.e. performance dashboards, tuning wizards, advisories and other graphs.
I am back with the another post, this time it’s for monitoring PostgreSQL database using one of the popular interactive visualization platform Grafana. I have recently implemented Grafana + Prometheus and created few really cool performance charts and database metric dashboards using one of the popular PostgreSQL metric exporter ‘postgres_exporter‘ to monitor a EDB 12 PostgreSQL database cluster.
I have divided everything in to three parts – Grafana Installation & configuration, Prometheus Installation and Configuration and final postgres_exporter installation and configuration.
let’s first start with Grafana installation and configuration on Linux server (this is EL 7).
Grafana Installation:
1. Disable SELinux
Change SELINUX=enforcing to SELINUX=disabled and Reboot.
This will install all binaries to location /usr/sbin/grafana-server, copies init.d file to /etc/init.d/grafana-server and default log location would be /var/log/grafana/grafana.log.
Enable Grafana service on system boot systemctl enable grafana-server.service
Start it using the following command: systemctl start grafana-server
6. Check Grafana web interface
http://IPADDRESSorHOSTNAME:3000/
Note: Default username and password is ‘admin‘, and once you login, it will prompt you to set a new password.
Add PostgreSQL as Data Source:
Next we now going to add PostgreSQL as a data source in Grafana.
1. Login to Grafana and go to ‘configuration‘ tab on the left of the console.
2. Add PostgreSQL as a data source, populate all details like hostname, port number, database name, DB user and password, PostgreSQL version and some optional entries like connection limits, SSL details etc. Once done, click on button with name save and test to see if all details are fine.
3. Now you will start seeing PostgreSQL as a data source under data source tab.
Prometheus Installation & Config
All good, now next is to install and configure ‘Prometheus’, this is a time-series database that is optimized for storing and serving time series through associated pairs of time(s) and value(s). You can also use InfluxDB or Graphite as a time series database for Grafana.
1. Download and untar the Prometheus file for your respective OS. Example: curl -LO url -LO https://github.com/prometheus/prometheus/releases/download/v2.22.0/prometheus-2.22.0.linux-amd64.tar.gz tar -xvf prometheus-2.22.0.linux-amd64.tar.gz mv prometheus-2.22.0.linux-amd64 prometheus-files
2. Create prometheus user, directories and make that account owner for all the files and folders.
[root@canttowin edb]# systemctl status prometheus
● prometheus.service - Prometheus
   Loaded: loaded (/etc/systemd/system/prometheus.service; enabled; vendor preset: disabled)
   Active: active (running) since Wed 2021-03-24 05:55:53 EDT; 4s ago
 Main PID: 17641 (prometheus)
    Tasks: 7
   CGroup: /system.slice/prometheus.service
           └─17641 /usr/local/bin/prometheus --config.file /etc/prometheus/prometheus.yml --storage.tsdb.path /var/lib/prometheus/ --web.console.templates...

Mar 24 05:55:54 canttowin.ontadomain prometheus[17641]: level=info ts=2021-03-24T09:55:54.172Z caller=head.go:714 component=tsdb msg="WAL segment ...gment=10
Mar 24 05:55:54 canttowin.ontadomain prometheus[17641]: level=info ts=2021-03-24T09:55:54.358Z caller=head.go:714 component=tsdb msg="WAL segment ...gment=10
Mar 24 05:55:54 canttowin.ontadomain prometheus[17641]: level=info ts=2021-03-24T09:55:54.455Z caller=head.go:714 component=tsdb msg="WAL segment ...gment=10
Mar 24 05:55:54 canttowin.ontadomain prometheus[17641]: level=info ts=2021-03-24T09:55:54.456Z caller=head.go:714 component=tsdb msg="WAL segment ...gment=10
Mar 24 05:55:54 canttowin.ontadomain prometheus[17641]: level=info ts=2021-03-24T09:55:54.456Z caller=head.go:719 component=tsdb msg="WAL replay c...173255ms
Mar 24 05:55:54 canttowin.ontadomain prometheus[17641]: level=info ts=2021-03-24T09:55:54.478Z caller=main.go:732 fs_type=XFS_SUPER_MAGIC
Mar 24 05:55:54 canttowin.ontadomain prometheus[17641]: level=info ts=2021-03-24T09:55:54.478Z caller=main.go:735 msg="TSDB started"
Mar 24 05:55:54 canttowin.ontadomain prometheus[17641]: level=info ts=2021-03-24T09:55:54.478Z caller=main.go:861 msg="Loading configuration file"...heus.yml
Mar 24 05:55:54 canttowin.ontadomain prometheus[17641]: level=info ts=2021-03-24T09:55:54.481Z caller=main.go:892 msg="Completed loading of configuration …µs
Mar 24 05:55:54 canttowin.ontadomain prometheus[17641]: level=info ts=2021-03-24T09:55:54.481Z caller=main.go:684 msg="Server is ready to receive ...quests."
Hint: Some lines were ellipsized, use -l to show in full.
9. If no issues till here, you are all good, time to check Prometheus WEB GUI, you can access its using below URL.
http://10.0.0.153:9090/graph
10. You can check other stats and other available metrics via GUI console.
11. Now you will start seeing ‘Prometheus’ in the list of data sources along with PostgreSQL which we have added at the first step.
Postgres_Exporter Installation and configuration
Now, when Grafana and Prometheus is all set, time to install and configure postgres_exporter. Postgres_exporter is a popular PostgreSQL metric exporter for Prometheus.
1. Lets create few required directories first.
mkdir /opt/postgres_exporter
cd /opt/postgres_exporter
2. Download and untar the file.
wget https://github.com/wrouesnel/postgres_exporter/releases/download/v0.5.1/postgres_exporter_v0.5.1_linux-amd64.tar.gz
tar -xzvf postgres_exporter_v0.5.1_linux-amd64.tar.gz
cd postgres_exporter_v0.5.1_linux-amd64
3. Copy core file ‘postgres_exporter’ file to /usr/local/bin directory
cp postgres_exporter /usr/local/bin
4. Next, lets create the configuration file for postres_exporter
cd /opt/postgres_exporter
sudo vi postgres_exporter.env
I want to visualize my EDB 12 PostgreSQL stats, so will use below data source details. This is for all database, you can also monitor any specific database.
[root@canttowin edb]# more /opt/postgres_exporter/postgres_exporter.env
DATA_SOURCE_NAME="postgresql://enterprisedb:oracle@10.0.0.153:5444/?sslmode=disable"
[root@canttowin edb]# systemctl status postgres_exporter
● postgres_exporter.service - Prometheus exporter for Postgresql
   Loaded: loaded (/etc/systemd/system/postgres_exporter.service; enabled; vendor preset: disabled)
   Active: active (running) since Wed 2021-03-24 05:52:17 EDT; 2s ago
 Main PID: 16984 (postgres_export)
    Tasks: 3
   CGroup: /system.slice/postgres_exporter.service
           └─16984 /usr/local/bin/postgres_exporter --web.listen-address=:9187 --web.telemetry-path=/metrics

Mar 24 05:52:17 canttowin.ontadomain systemd[1]: Started Prometheus exporter for Postgresql.
Mar 24 05:52:17 canttowin.ontadomain postgres_exporter[16984]: time="2021-03-24T05:52:17-04:00" level=info msg="Established new database connection...go:777"
Mar 24 05:52:17 canttowin.ontadomain postgres_exporter[16984]: time="2021-03-24T05:52:17-04:00" level=info msg="Semantic Version Changed on \"10.0....o:1229"
Mar 24 05:52:18 canttowin.ontadomain postgres_exporter[16984]: time="2021-03-24T05:52:18-04:00" level=info msg="Starting Server: :9187" source="pos...o:1437"
Hint: Some lines were ellipsized, use -l to show in full.
7. Now we can check status if postgres_exporter (as a target) state information and other details. This we can check it through Prometheus web GUI.
As we have configured postgres_exporter and mapped it with Prometheus, we can also look for many of the expressions that it has created. This you can access on ‘graph’ page under Prometheus GUI console.
You can check it’s immediate results in both graphical or in console itself.
Alright, we have installed and configured Grafana and have added PostgreSQL and Prometheus as a data source and have configured postgres_exporter metric collector too. Time to generate some graphs. Well, you can do it by creating manual queries under new dashboards or else you can use any of prebuild Grafana dashboard templates for PostgreSQL i.e. 6742 or even 9628 (there are many more on Grafana labs repo).
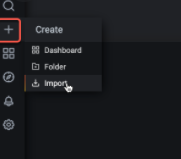
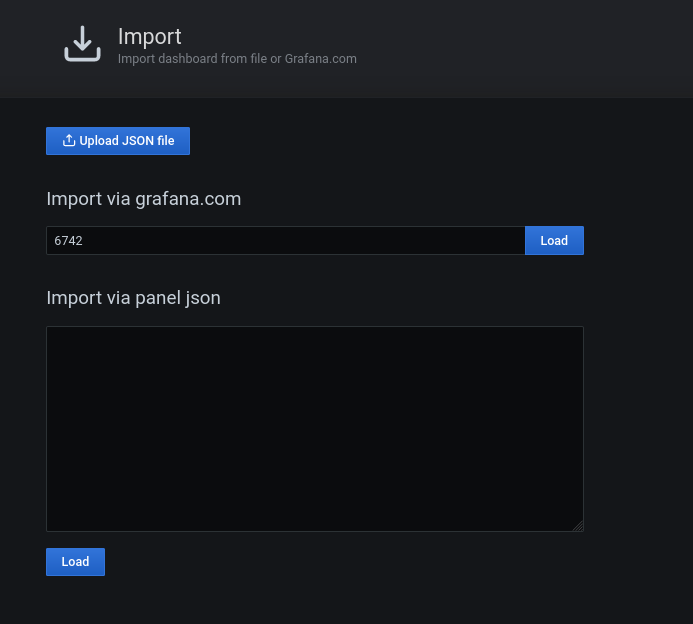
1. Lets Import dashboard with ID 6742. Go to option with + sign on the left panel and choose last option ‘import’.
2. In next screen, pass dashboard ID 6742 and press button Load. You can also use JSON file entries instead of ID, I will use ID here in this sample configuration. Here select ‘Prometheus’ from the drop down list and click ‘Import’ and it’s all set!
3. Now this will bring the final dashboard showing lot’s of PostgreSQL metrics and their current values.
Last weekend I’ve got a call from one of my friend asking about a weird issue in his master-slave (primary-standby) setup where he’s using repmgr for automatic failover and switchover operations. He said after the failover (server crashed) with role reversal or promotion the old standby becomes new primary (expected, all good till here), but as soon as the old primary comes back online and rejoins the configuration, it started as a primary too. I mean you can imagine something like below, both of the two hosts becomes master and there is no sign of a new standby.
He checked repmgr logs on the standby node and everything looks okay, standby promotion was sucessfull. It seems something was stopping the repmgr to update the information and bring that crashed node (previous primary) back as a standby. So the final situation is there are two primary nodes at this point.
So, how to and where to start from ?
A quick solution to this problem is to create an UPDATE TRIGGER on one of the internal table EVENTS of repmgr database (it creates its own database with default name of repmgr). The logic of creating a trigger is to handle events “standby_promote”, I mean when it happens a script is triggered that will bring back the old primary as new standby.
Next we would be needing a script that will help to automate the standby promotion. For that purpose you can use this script (link) or you can write something similar. And now when we have to call a bash script or to write stored procedures in a shell, we need the ‘.plsh’ extension in the database. Let’s install one of the most popular extension to do that, petere/plsh (link)
[postgresdb@fatdba ~]$ cd /usr/share/postgresql/12/extension/
[postgresdb@fatdba ~]$ sudo git clone https://github.com/petere/plsh.git
[postgresdb@fatdba ~]$ cd plsh
[postgresdb@fatdba ~]$ sudo make PG_CONFIG=/usr/bin/pg_config
[postgresdb@fatdba ~]$ sudo apt-get install make
[postgresdb@fatdba ~]$ sudo apt-get install gcc
[postgresdb@fatdba ~]$ sudo apt-get install postgresql-server-dev-12
[postgresdb@fatdba ~]$ sudo make install PG_CONFIG=/usr/bin/pg_config
Now, next create the extension in the database.
[postgresdb@fatdba ~]$ psql -U repmgr
This one needs to be executed only n primary side.
repmgr=# create extension plsh;
Now, let’s create the function and a trigger to invoke the script failover_promote.sh
[postgresdb@fatdba ~]$ psql
postgres=# CREATE FUNCTION failover_promote() RETURNS trigger AS $$
#!/bin/sh
/bin/bash /tmp/psqlscripts/failover_promote.sh $1 $2
$$
LANGUAGE plsh;
And the UPDATE TRIGGER on EVENTS table to call function created above.
postgres=#  create trigger failover
after insert
on events
for each row
execute procedure failover_promote();
Yes, that’s it. All done!
Now you can mimic the failover scenario i.e by stopping the primary database and check repmgr logs on the standby server.
You will see the standby is promoted and becomes new primary and as soon it’s finished, it will start pinging the crashed node and the moment it is back it will be promoted as a new standby.
Ever encountered a situation where the backup history (TIMELINE_HISTORY) file was deleted by mistake or maybe someone removed it purposely, it was quite old and you try to restore a new backup. I remember many issues related with replication, backup tools (BARMAN & BART) that you might face if that file is removed from PG_WAL directory. Would like to discuss a problem that we encountered while taking BART backup on EDB version 10.
These ‘timeline files’ are quite important, as using the timeline history files, the pg_basebackup can follow the latest timeline present in the primary, just as it can follow new timelines appearing in an archive WAL directory. So, in short, it shows which timeline it branched off from and when. These history files are necessary to allow the system to pick the right WAL segment files when recovering from an archive that contains multiple timelines. So, its important to have this file there in WAL directory.
[enterprisedb@fatdba ~]$ bart -c /usr/edb-bart-1.1/etc/bart.cfg BACKUP -s edbserver --backup-name MAINFULLBKP_10-13-20
INFO:  DebugTarget - getVar(checkDiskSpace.bytesAvailable)
INFO:  creating full backup using pg_basebackup for server 'edbserver'
INFO:  creating backup for server 'edbserver'
INFO:  backup identifier: '1602788909136'
ERROR: backup failed for server 'edbserver'
pg_basebackup: could not send replication command "TIMELINE_HISTORY": ERROR: could not open file "pg_wal/00000002.history": No such file or directory
1633701/1633701 kB (100%), 2/2 tablespaces
pg_basebackup: child process exited with error 1
pg_basebackup: removing data directory "/edbbackup/edbserver/1602788909136"
The file is not there under said directory.
[enterprisedb@fatdba ~]$ cd /edb/as10/as10/data/pg_wal/
[enterprisedb@fatdba pg_wal]$ ls
0000000200000005000000EA  0000000200000005000000EB.00000060.backup  0000000200000005000000ED  archive_status
0000000200000005000000EB  0000000200000005000000EC                  0000000200000005000000EE
In case of file missing/moved, you can always create a brand new empty file and that will be used by the respective utility and will be populated with metadata soon after. So, in order to quickly restore this issue, let’s create one.
Today would like to discuss about the issue that we faced while doing a BART restore operation of one of the EDB 11 PostgreSQL instance. This was a new system under realization phase (before delivery to customer). So, during one of the test we saw the restore got failed with a message which says something about the value ‘tablespace_path’. I know I have a tablespace in this system, but I initially though that BART will take care of it by its own, but its was not the case.
Below was the error what I have encountered during the test.
[enterprisedb@fatdba archived_wals]$ bart -c /usr/edb-bart-1.1/etc/bart.cfg RESTORE -s edbserver -i 1602187005158 -p /edb/as10/as10/data/
INFO:  restoring backup '1602187005158' of server 'edbserver'
ERROR: "tablespace_path" is not set
[enterprisedb@fatdba archived_wals]$
Okay, let’s first check tablespace details, we use the metacommand of ‘db’ to get that info about tablespaces. Okay, so we have it’s location, size details.
Let’s go inside the said directoy and see what all is there.
Note: Last two are the default tablespaces so need to worry about them.
Okay, so we have a soft-link created for the tablespace under PG_TBLSPC directory under DATA dir with OID 42250.
Now when we have all the information, time to add requisite parameter in bart.cfg file to consider tablespaces, just like below.
Format: OID_1=tablespace_path_1;OID_2=tablespace_path_2 …
example: tablespace_path = 42250=/edb/as10/as10/data_test/pg_tblspc
Note: tablespace_path parameter must exist or to be empty at the time you perform the BART RESTORE operation.
Now let’s modify our bart confguration file, will look something like below with the ‘tablespace_path’ option set.
This post is in continuation of my last post where I showed how to connect to Oracle database from an PostgreSQL instance. Last post was all about accessing Oracle database using Foreign data wrappers. This post is about accessing/querying Oracle database from PostgreSQL using DB Links.
Cool, let’s connect with the PostgreSQL instance and create the DBLink. To create that you need Oracle username and its password which you want to connect and its IP address along with SID or database name, and you are done. And yes, don’t forget to set the LD_LIBRARY_PATH to the location of your Oracle instant client.
[enterprisedb@fatdba ~]$ export LD_LIBRARY_PATH=/usr/lib/oracle/12.2/client64/lib
[enterprisedb@fatdba ~]$
[enterprisedb@fatdba ~]$ psql -d enterprisedb -U enterprisedb
psql.bin (10.12.20)
Type "help" for help.
enterprisedb=#
enterprisedb=#
enterprisedb=# select version();
                                                    version
---------------------------------------------------------------------------------------------------------------
 EnterpriseDB 10.12.20 on x86_64-pc-linux-gnu, compiled by gcc (GCC) 4.4.7 20120313 (Red Hat 4.4.7-23), 64-bit
(1 row)

enterprisedb=#
enterprisedb=# CREATE DATABASE LINK dixdroid CONNECT TO migr IDENTIFIED BY 'oracle90' USING oci '//10.0.0.130/fatdb';
CREATE DATABASE LINK
enterprisedb=#
Great, now time to test. Lets do a query on Oracle’s table from Postgresql instance using DB Link named ‘dixdroid’ which we have created earlier.
enterprisedb=# select * from migr.bigtab1@dixdroid;
  id  |    created_date    | lookup_id |            data
------+--------------------+-----------+----------------------------
  320 | 19-MAY-19 02:10:38 |         1 | This is some data for 320
  321 | 19-MAY-18 02:10:38 |         2 | This is some data for 321
  322 | 19-MAY-19 02:10:38 |         1 | This is some data for 322
  323 | 19-MAY-20 02:10:38 |         3 | This is some data for 323
  324 | 19-MAY-18 02:10:38 |         2 | This is some data for 324
  325 | 19-MAY-20 02:10:38 |         3 | This is some data for 325
  326 | 19-MAY-19 02:10:38 |         1 | This is some data for 326
  327 | 19-MAY-18 02:10:38 |         2 | This is some data for 327
  328 | 19-MAY-19 02:10:38 |         1 | This is some data for 328
  329 | 19-MAY-20 02:10:38 |         3 | This is some data for 329
  330 | 19-MAY-18 02:10:38 |         2 | This is some data for 330
  331 | 19-MAY-20 02:10:38 |         3 | This is some data for 331