Tales From A Lazy Fat DBA

Its all about Databases, their performance, troubleshooting & much more …. ¯\_(ツ)_/¯

pgCenter, a TOP like utility to monitor PostgreSQL databases

Posted by FatDBA on July 12, 2021

Hi All,

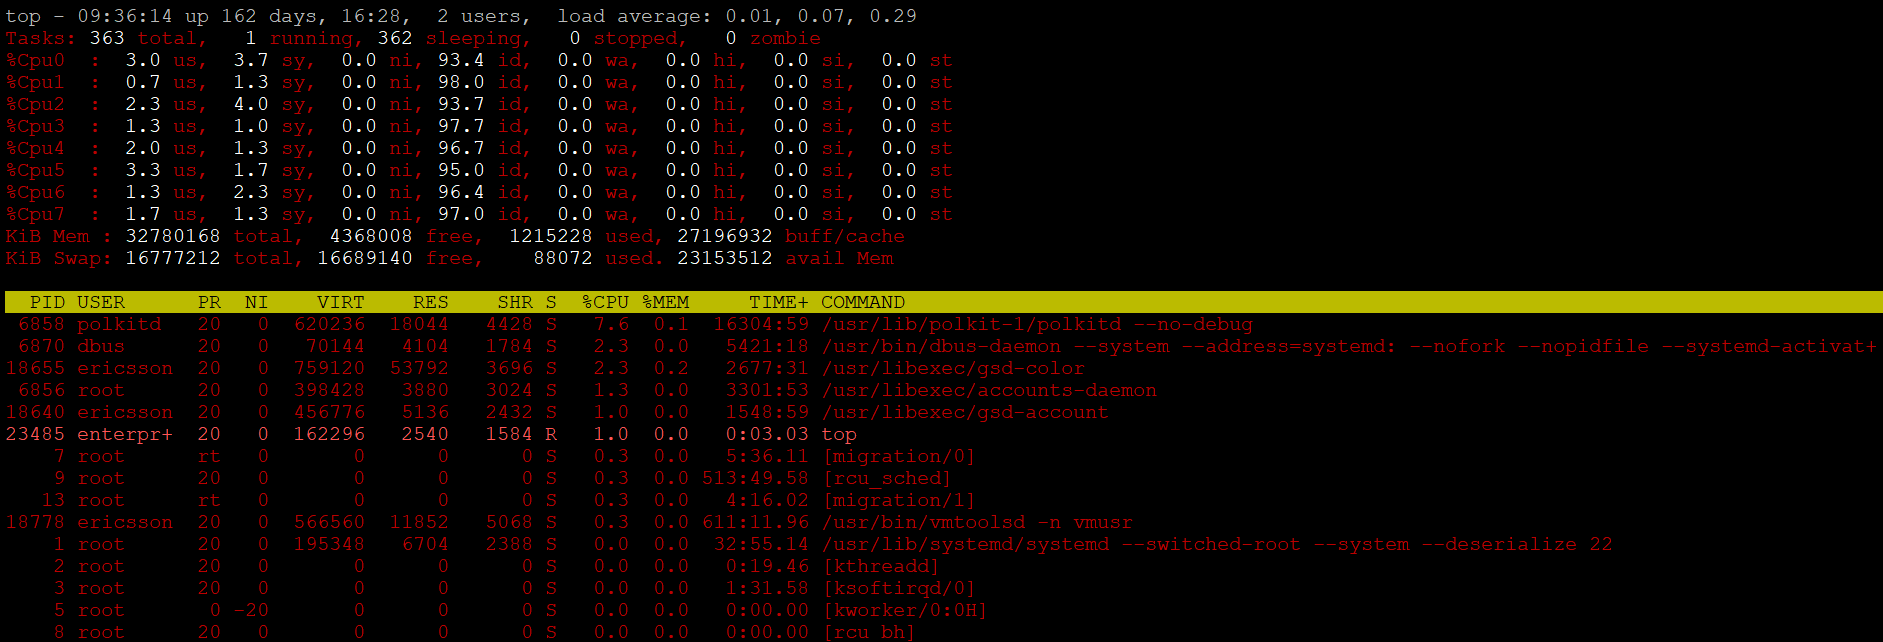
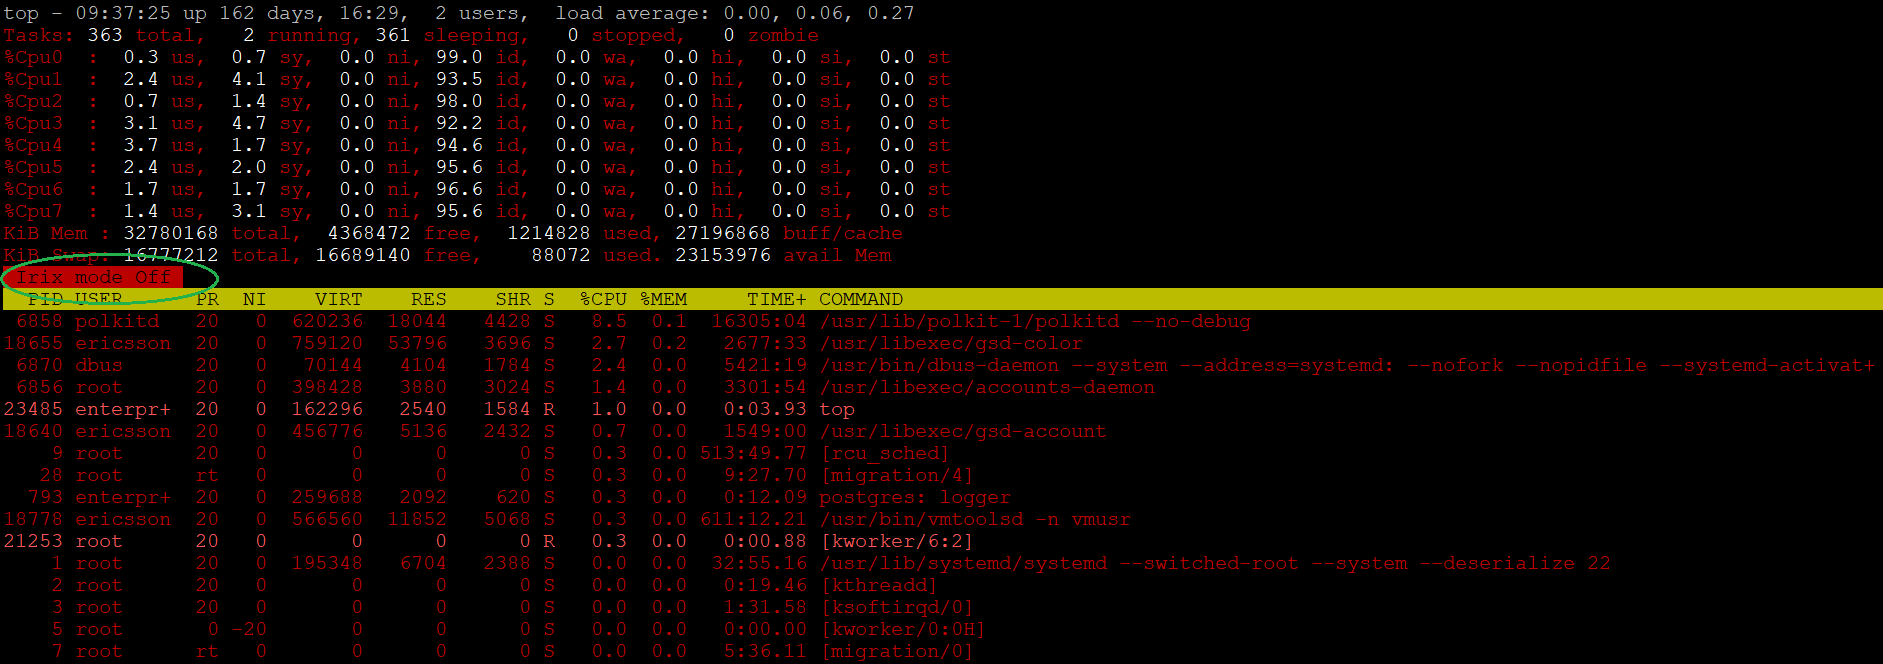
I was recently asked by one of my team mate to recommend any performance monitoring tool which is free, text based, light weight and is quick to run to check what all is running on the PostgreSQL database. He wanted to use it for one of the performance drive he was leading for one production database setup. The guy was coming from Oracle background, and was looking something like Linux TOP utility or like oratop (like top for oracle database) …

After carefully understanding his requirements, I recommended him to use pgCenter. This is an open source project by Lesovsky Alexey (the man behind pgstats.dev and Weaponry) and is a command-line admin tool for observing and troubleshooting Postgres database. I would have recommended pg_top to him, but pgCenter is one step ahead and better as it provide more details as compared to the later.

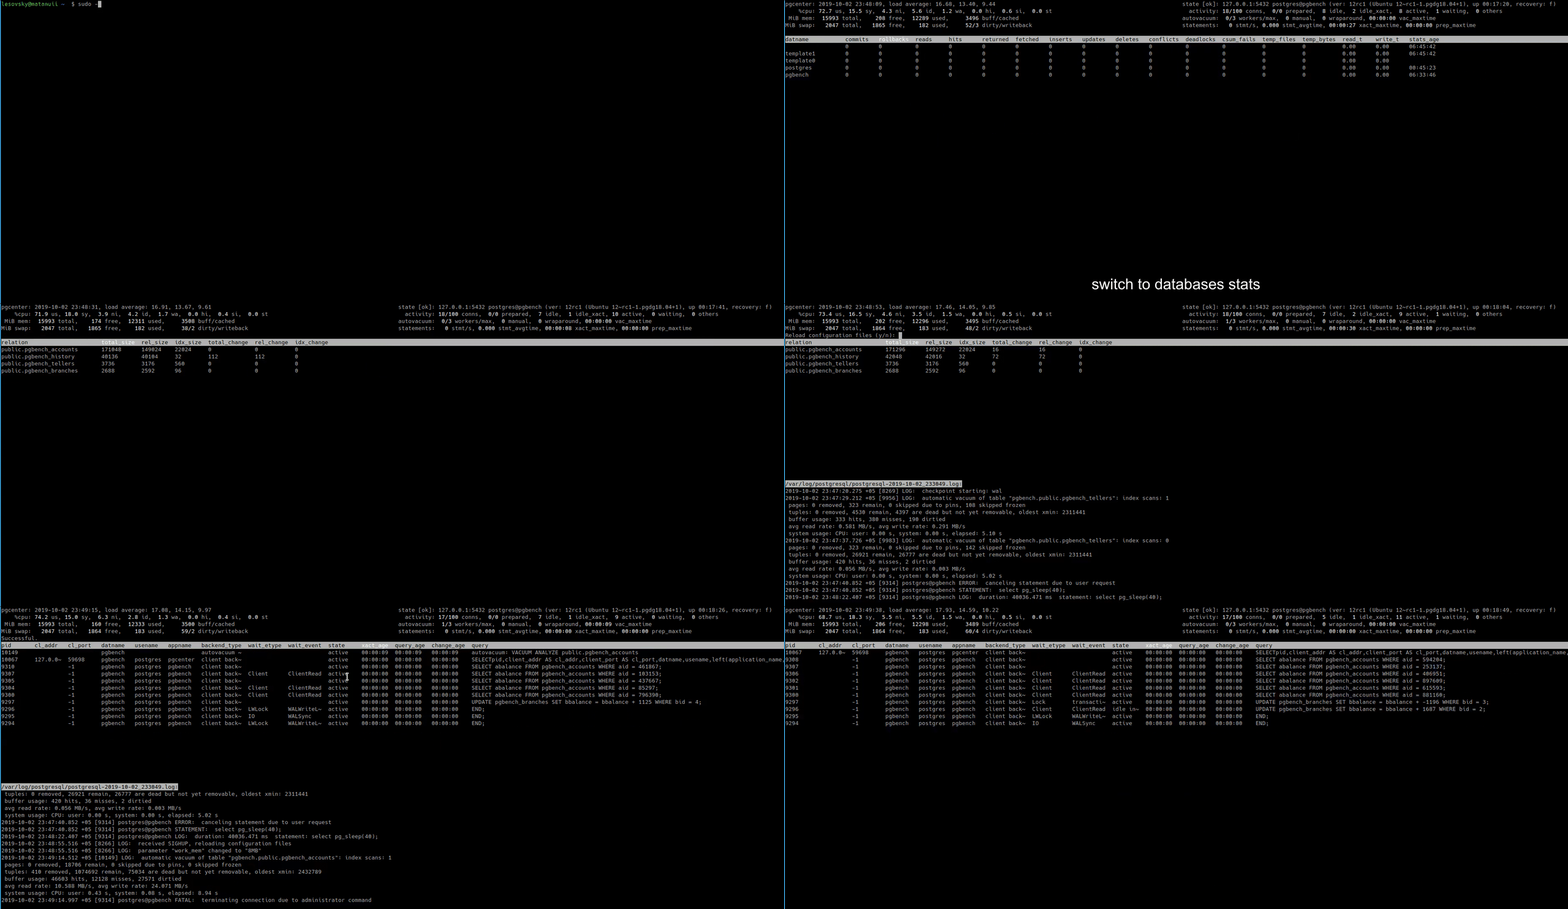
pgCenter’s main goal is to help Postgres DBA working with statistics and provide a convenient way to observe Postgres in runtime. Tool is capable to provide replication, table level, Index, activity, table size, database (overall), and function statistics. It also shows details on VACCUM, NIC & Disk stats along with OS level stats of CPU, Memory, load averages, connection and server details.

It’s pretty easy to call or install, please refer below project GitHub link to download and follow install actions. https://github.com/lesovsky/pgcenter

So, let’s see what all it monitors and catches.

[enterprisedb@fatdba ~]$
[enterprisedb@fatdba ~]$ pgcenter top -d perf -h 10.0.0.130 -U enterprisedb  -p 5444

A GIF (from project page on github) to show it in real-time, what all you can do with the tool.

Stats it supports …

PostgreSQL Stats it supports:

  • summary activity – a compilation/selection of metrics from different sources – postgres uptime, version, recovery status, number of clients grouped by their states, number of (auto)vacuums, statements per second, age of the longest transaction and the longest vacuum;
  • pg_stat_activity – activity of connected clients and background processes.
  • pg_stat_database – database-wide and sessions statistics, such as number of commits/rollbacks, processed tuples, deadlocks, temporary files, etc.
  • pg_stat_replication – replication statistics, like connected standbys, their activity and replication lag.
  • pg_stat_user_tables, pg_statio_user_tables – statistics on accesses (including IO) to tables.
  • pg_stat_user_indexes, pg_statio_user_indexes – statistics on accesses (including IO) to indexes.
  • pg_stat_user_functions – statistics on execution of functions.
  • pg_stat_wal – WAL usage statistics.
  • pg_stat_statements – statistics on SQL statements executed including time and resources usage.
  • statistics on tables sizes based on pg_relation_size() and pg_total_relation_size() functions;
  • pg_stat_progress_vacuum – progress of (auto)vacuums operations.
  • pg_stat_progress_cluster – progress of CLUSTER and VACUUM FULL operations.
  • pg_stat_progress_create_index – progress of CREATE INDEX and REINDEX operations.
  • pg_stat_progress_analyze – progress of ANALYZE operations.
  • pg_stat_progress_basebackup – progress of basebackup operations.
  • pg_stat_progress_copy – progress of COPY operations.

System Statistics it supports :

pgCenter top also provides system usage information based on statistics from procfs filesystem:

  • load average and CPU usage time (user, system, nice, idle, iowait, software, and hardware interrupts, steal);
  • memory and swap usage, amount of cached and dirty memory, writeback activity;
  • storage devices statistics: IOPS, throughput, latencies, average queue and requests size, devices utilization;
  • network interfaces statistics: throughput in bytes and packets, different kind of errors, saturation and utilization.
  • mounted filesystems’ usage statistics: total size, amount of free/used/reserved space and inodes.

Hope It Helps!
Prashant Dixit

Posted in troubleshooting | Tagged: , , , | Leave a Comment »

New names to RecoveryWalAll and RecoveryWalStream wait events in PostgreSQL 13

Posted by FatDBA on July 9, 2021

Hi Guys,

Recently while working on PostgreSQL Version 13 I have identified few new changes related with the wait events, particularly related with recovery in order to make the names and what they are more consistent.

For all who are new to events, they can tell you a lot about query and system performance, specially scenarios like .. why a query isn’t making progress ? – One example of a wait event may be IO / DataFileRead, which points that a process is currently waiting for data to be read from disk or the page cache.

So, talking about those waits, first one is event ‘RecoveryWalAll‘ which tells recovery is waiting for WAL from a stream, that could be from any kind of source i.e. local, archive or stream, is now changed to ‘RecoveryWalStream’.

Another one is ‘RecoveryWalStream‘ which can help you to make sure that each standby does not have more WAL to replay or helps to identify what is waiting for WAL from a stream at recovery, is now changed/renamed to RecoveryRetrieveRetryInterval. I have also noticed a change in event class or category of RecoveryRetrieveRetryInterval to Timeout from Activity.

Hope It Helps
Prashant Dixit

Posted in Advanced, troubleshooting | Tagged: , , | Leave a Comment »

Quarantine a SQL ? This can save from a system performance pandemic …

Posted by FatDBA on July 6, 2021

Hi Guys,

Last weekend I was asked to examine a performance problem where customer was observing sporadic resource spikes on CPU & PIOs (Physical IO scans), and had no idea how to handle the situation. They already have identified the problematic SQL and asked me to take a look, while doing initial investigation on the system, I found the resource manager was enabled and was killing the ill SQL every time when it tries to breach the limits set on CPU & other resources.

I spent some time understanding query behavior and performance, and I found this a scenario of SQL plan (PHV) flip where the query optimizer toggles between a good and a worst plan. This being a time sensitive issue and customer needs a quick fix before I identify the reason behind the PHV flip, we have to think of any technique on how we can stop the SQL execution with bad PHVs. This was an Oracle EE 19c system running on Exadata, I immediately proposed for a solution using new feature of ‘SQL Quarantine‘, which helps to prevent reuse of same execution plan which was terminated by resource managers due to resource limits.

Let me show you how to do that, here I will demonstrate how to quarantine a SQL & all its execution plans.

Well this is just a use case, you can also quarantine the SQL for all its PHVs or execution plans or even through the SQL Text. Here I will show how you can quarantine a SQL for all its execution plans.

Note: This feature is currently available only on Enterprise Edition on Engineered Systems, like Exadata and Exadata Cloud Service, but for this demo, I will be enabling the ‘_exadata_feature_on‘ parameter for demo purposes on my sandbox setup.

** Please don’t touch this parameter in your production environments if you’re not running on Oracle EE on the top of Exadata or Exadata Cloud services.

[oracle@canttowinsec ~]$ !sql
sqlplus / as sysdba

SQL*Plus: Release 19.0.0.0.0 - Production on Sat Jul 3 23:33:41 2021
Version 19.3.0.0.0

Copyright (c) 1982, 2019, Oracle.  All rights reserved.


SQL>
SQL> @hidden
Enter value for param: exadata_feature_on
old   5:    and a.ksppinm like '%&param%'
new   5:    and a.ksppinm like '%exadata_feature_on%'

Parameter                                     Session Value             Instance Value            descr
--------------------------------------------- ------------------------- ------------------------- ------------------------------------------------------------
_exadata_feature_on                           FALSE                     FALSE                     Exadata Feature On

SQL>
SQL>


SQL> shut immediate
Database closed.
Database dismounted.
ORACLE instance shut down.
SQL>
SQL>


SQL> startup
ORACLE instance started.

Total System Global Area  922745216 bytes
Fixed Size                  8903040 bytes
Variable Size             843055104 bytes
Database Buffers           67108864 bytes
Redo Buffers                3678208 bytes
Database mounted.
Database opened.
SQL>
SQL>
SQL>


SQL>
SQL> @hidden
Enter value for param: exadata_feature_on
old   5:    and a.ksppinm like '%&param%'
new   5:    and a.ksppinm like '%exadata_feature_on%'

Parameter                                     Session Value             Instance Value            descr
--------------------------------------------- ------------------------- ------------------------- ------------------------------------------------------------
_exadata_feature_on                           TRUE                      TRUE                      Exadata Feature On

SQL>


-- For this demo I have created one table with 1000000 rows. 

SQL> select count(*) from bigtab;

  COUNT(*)
----------
   1000000

Next check the SQLID, PHV and TEXT of the SQL for which you want to setup this QUARANTINE feature and will create the quarantine configuration for it. You can set it for SQL ID, SQL ID + PHV or for SQL TEXT.

SQL> select sql_id, plan_hash_value, sql_text from v$sqlarea where sql_text like '%select * from bigtab%';

SQL_ID        PLAN_HASH_VALUE
------------- ---------------
SQL_TEXT
--------------------------------------------------------------------------------------------------------------------------------------------------------------------------------------------------------
6fwqzurbc8y7k       441133017
select * from bigtab

SQL>


-- You can create CREATE_QUARANTINE BY SQL_ID 
quarantine_config := DBMS_SQLQ.CREATE_QUARANTINE_BY_SQL_ID(SQL_ID => '&sql_id')
quarantine_config := DBMS_SQLQ.CREATE_QUARANTINE_BY_SQL_ID(SQL_ID => '&sql_id', PLAN_HASH_VALUE => '&PLAN_HASH_VALUE');

-- You can create CREATE_QUARANTINE_BY_SQL_TEXT.
quarantine_config := DBMS_SQLQ.CREATE_QUARANTINE_BY_SQL_TEXt(SQL_TEXT => to_clob('select count(*) from emp'));


-- This command creates a quarantine configuration for SQL ID '6fwqzurbc8y7k' and all its execution plans.
SQL>
SQL> DECLARE
quarantine_sql VARCHAR2(30);
BEGIN
quarantine_sql :=   DBMS_SQLQ.CREATE_QUARANTINE_BY_SQL_ID(SQL_ID => '6fwqzurbc8y7k');
END;
/  

PL/SQL procedure successfully completed.

SQL>


-- Check if quarantine config/profile is created.

SQL> select NAME, SQL_TEXT, ELAPSED_TIME, cpu_time,CREATED, ENABLED from dba_sql_quarantine;


NAME                           SQL_TEXT                       ELAPSED_TIME         CPU_TIME                       CREATED                        ENA
------------------------------ ------------------------------ -------------------- ------------------------------ ------------------------------ ---
SQL_QUARANTINE_2akx3bq44wvc5   select * from bigtab           ALWAYS               ALWAYS                         04-JUL-21 12.09.25.567422 AM   YES


Now next we will use the DBMS_SQLQ.ALTER_QUARANTINE procedure to put limits on resource usage i.e. Elapsed time, CPU, IO (MBs), Number of physical (PIOs) requests, Number of logical (LIOs) requests.

SQL>
SQL> BEGIN
    DBMS_SQLQ.ALTER_QUARANTINE(
       QUARANTINE_NAME => 'SQL_QUARANTINE_2akx3bq44wvc5',
       PARAMETER_NAME  => 'CPU_TIME',
       PARAMETER_VALUE => '5');

    DBMS_SQLQ.ALTER_QUARANTINE(
       QUARANTINE_NAME => 'SQL_QUARANTINE_2akx3bq44wvc5',
       PARAMETER_NAME  => 'ELAPSED_TIME',
       PARAMETER_VALUE => '10');
END;
/  2    3    4    5    6    7    8    9   10   11   12

PL/SQL procedure successfully completed.

SQL>


-- let's verify limits that we have set against this SQL Quarantine profile.

NAME                           SQL_TEXT                       ELAPSED_TIME         CPU_TIME                       CREATED                        ENA
------------------------------ ------------------------------ -------------------- ------------------------------ ------------------------------ ---
SQL_QUARANTINE_2akx3bq44wvc5   select * from bigtab           10                   5                              04-JUL-21 12.12.41.918609 AM   YES

Next we will setup the RESOURCE MANAGER.

-- Create a pending area.
SQL> begin
 dbms_resource_manager.create_pending_area();
 end;
 /  2    3    4

PL/SQL procedure successfully completed.

-- Create a consumer group with name 'DIXITPOC_GROUP'.
SQL> begin
 dbms_resource_manager.create_consumer_group(CONSUMER_GROUP=>'DIXITPOC_GROUP',COMMENT=>'To test SQL quarantine feature for one SQL');
 end;
 /  2    3    4

PL/SQL procedure successfully completed.


-- Now bind the consumer group with the user 'DIXIT', I mean this could be any group through which you will execute the query.
SQL> begin
 dbms_resource_manager.set_consumer_group_mapping(attribute => 'ORACLE_USER',value => 'DIXIT',consumer_group =>'DIXITPOC_GROUP' );
 end;
  /  2    3    4

PL/SQL procedure successfully completed.


-- Create a resource plan with name 'POC_FOR_QUARANTINE'.
SQL> begin
dbms_resource_manager.create_plan(plan => 'POC_FOR_QUARANTINE',comment => 'Kill SQL and its other execution plans when exceeding CPU and Elapsed seconds');
end;
/  2    3    4

PL/SQL procedure successfully completed.


-- Create a plan directive by allocating resource plan 'POC_FOR_QUARANTINE' to consumer group 'DIXITPOC_GROUP'. I am setting execution limit of 5 seconds for the SQL.
SQL> begin
 dbms_resource_manager.create_plan_directive(
 plan => 'POC_FOR_QUARANTINE',
 group_or_subplan => 'DIXITPOC_GROUP',
 comment => 'Kill SQL and its other execution plans when exceeding CPU and Elapsed seconds',
 switch_group=>'CANCEL_SQL',
 switch_time => 5,
 switch_estimate=>false);
 end;
 /  2    3    4    5    6    7    8    9   10

PL/SQL procedure successfully completed.


-- Allocate full resources to rest of the sessions which are not part of this plan.
SQL> begin
 dbms_resource_manager.create_plan_directive(PLAN=> 'POC_FOR_QUARANTINE', GROUP_OR_SUBPLAN=>'OTHER_GROUPS',COMMENT=>'leave rest as is');
 end;
 /  2    3    4

PL/SQL procedure successfully completed.


-- Validate and submit pending area.
SQL> begin
 dbms_resource_manager.validate_pending_area();
 end;
 /  2    3    4

PL/SQL procedure successfully completed.

SQL> begin
 dbms_resource_manager.submit_pending_area();
 end;
 /  2    3    4

PL/SQL procedure successfully completed.

SQL>


-- Grant switch privilege to the DIXIT user which will switch it to 'DIXITPOC_GROUP' group.
SQL> begin
dbms_resource_manager_privs.grant_switch_consumer_group('DIXIT','DIXITPOC_GROUP',false);
end;
/  2    3    4

PL/SQL procedure successfully completed.

-- Create initial consumer group for DIXIT user for 'DIXITPOC_GROUP' group.
SQL> begin
dbms_resource_manager.set_initial_consumer_group('DIXIT','DIXITPOC_GROUP');
end;
/  2    3    4

PL/SQL procedure successfully completed.

SQL>

Next set the resource manager at the database level, we will have to set the RESOURCE_MANAGER_PLAN to value or name of the plan ‘POC_FOR_QUARANTINE’.

SQL> show parameter resource

NAME                                 TYPE        VALUE
------------------------------------ ----------- ------------------------------
resource_limit                       boolean     TRUE
resource_manage_goldengate           boolean     FALSE
resource_manager_cpu_allocation      integer     5
resource_manager_plan                string
SQL> 


SQL> alter DIXITtem set RESOURCE_MANAGER_PLAN = 'POC_FOR_QUARANTINE';
DIXITtem altered.

SQL> show parameter resource

NAME                                 TYPE        VALUE
------------------------------------ ----------- ------------------------------
resource_limit                       boolean     TRUE
resource_manage_goldengate           boolean     FALSE
resource_manager_cpu_allocation      integer     5
resource_manager_plan                string      POC_FOR_QUARANTINE
SQL>

Execute the SQL for the first time, you will get ‘active time limit exceeded’ due to RM.

SQL>
SQL> select * from emp;

ERROR at line 2:
ORA-00040: active time limit exceeded - call aborted

Now, if you run the SQL for the second time, you will see your quarantine plan/profile will be used and will abort the execution of the SQL.

SQL>
SQL> select * from emp;

ERROR at line 2:
ORA-56955: quarantined plan used

Hope It Helped
Prashant Dixit

Posted in Advanced, troubleshooting | Tagged: , , , , | 1 Comment »

Migration assessment report, possible with ora2pg ?

Posted by FatDBA on July 3, 2021

Hi Guys,

Last week someone asked if me if it’s possible to generate the migration assessment report (of any sort) if using ora2pg for migration ? – The entire team was coming from EDB PostgreSQL migration where they used their migration toolkit, and there you can generate something similar, but with their current project, ora2pg was finalized as a migration tool for Oracle to vanilla PostgreSQL migration.

And the answer to their question was YES, it’s possible to generate the migration assessment report with ora2pg too, which is very useful as it performs an assessment for the potential migration problems or difficulties. It allocates a cost per object types and also provides other details like invalid object counts, total number of object types, comments and more description about objects etc.

It inspects all database objects , functions, stored procedures to detect if there are some objects or PL/SQL code that cannot be automatically converted by the tool. At the end of the report it calculates the overall cost (sum of all costs) and assigns an approximate number of days or time to perform the migration.

Default time per “cost evaluation unit” is 5 minutes, and outputs can be generated in text (default), html or csv formats.

Let’s generate a sample report, but first let me show you the version of ora2pg, and next will call the report for Oracle database running on 18c for a particular schema.

$
$ ora2pg -t SHOW_VERSION -c config/ora2pg.conf
Oracle Database 18c Enterprise Edition Release 18.0.0.0.0


-- Here we used 'estimate_cost' is to activate the migration cost evaluation with SHOW_REPORT

$ ora2pg -t show_report  --estimate_cost -c config/ora2pg.conf --dump_as_html > /tmp/orapgtestmigr/ora2pgreport.html

-------------------------------------------------------------------------------
Ora2Pg v20.0 - Database Migration Report
-------------------------------------------------------------------------------
Version  Oracle Database 18c Enterprise Edition Release 18.0.0.0.0
Schema   DIXITSCH
Size     88.19 MB

Below is the screen snip of the report head.

Please click below link to view the full report.

Hope It Helped!
Prashant Dixit

Posted in Advanced | Tagged: , , , | 1 Comment »

Single command to prepare a DB for a Data Guard configuration in Oracle 21c – PREPARE DATABASE FOR DATA GUARD WITH

Posted by FatDBA on June 28, 2021

Hi Guys,

Another cool feature I have identified while doing a POC on Oracle 21c database!
Starting with Oracle 21c, now you can create Primary database in a Data Guard Broker configuration using one single command PREPARE DATABASE FOR DATA GUARD WITH <options>. This command will do all the work for you i.e. database preparation, enables force logging, set required parameters, creates standby redo log files, enables Flashback & enables Archivelog.

Below command will prepare the database with name dixitdb to use as a primary database in DG broker configuration.

[oracle@canttowin ~]$ dgmgrl
DGMGRL for Linux: Release 21.0.0.0.0 - Production on Sat Jun 26 11:10:11 2021
Version 21.1.0.0.0

Copyright (c) 1982, 2020, Oracle and/or its affiliates.  All rights reserved.

Welcome to DGMGRL, type "help" for information.
DGMGRL>

DGMGRL> PREPARE DATABASE FOR DATA GUARD WITH DB_UNIQUE_NAME IS dixitdb;
DB_RECOVERY_FILE_DEST IS "$ORACLE_BASE_HOME/dbs/"
DB_RECOVERY_FILE_DEST_SIZE is "400G"
DG_BROKER_CONFIG_FILE1 IS "$ORACLE_HOME/dbs/testfile.dat"
DG_BROKER_CONFIG_FILE2 IS "$ORACLE_HOME/dbs/testfile2.dat";
Preparing database "dixitdb" for Data Guard.
Creating server parameter file (SPFILE) from initialization parameter memory values.
Database must be restarted after creating the server parameter (SPFILE).
Shutting down database "dixitdb".
Database closed.
Database dismounted.
ORACLE instance shut down. Starting database "dixitdb" to mounted mode.
ORACLE instance started.
Database mounted. Server parameter file (SPFILE) is "ORACLE_BASE_HOME/dbs/spdixitdb.ora".
Initialization parameter DB_UNIQUE_NAME set to 'dixitdb'.
Initialization parameter DB_FILES set to 1024.
Initialization parameter LOG_BUFFER set to 401355151.
Primary database must be restarted after setting static initialization parameters. Primary database must be restarted to enable archivelog mode.
Shutting down database "dixitdb".
Database dismounted.
ORACLE instance shut down.
Starting database "dixitdb" to mounted mode.
ORACLE instance started.
Database mounted.
Initialization parameter DB_FLASHBACK_RETENTION_TARGET set to 120.
Initialization parameter DB_BLOCK_CHECKSUM set to 'TYPICAL'.
Initialization parameter DB_LOST_WRITE_PROTECT set to 'TYPICAL'.
Initialization parameter PARALLEL_THREADS_PER_CPU set to 1.
Removing RMAN archivelog deletion policy 1.
Removing RMAN archivelog deletion policy 2.
RMAN configuration archivelog deletion policy set to SHIPPED TO ALL STANDBY.
Initialization parameter DB_RECOVERY_FILE_DEST_SIZE set to '200G'.
Initialization parameter DB_RECOVERY_FILE_DEST set to 'ORACLE_BASE_HOME/dbs/'. Initialization parameter DG_BROKER_START set to FALSE.
Initialization parameter DG_BROKER_CONFIG_FILE1 set to 'ORACLE_HOME/dbs/testfile.dat'.
Initialization parameter DG_BROKER_CONFIG_FILE2 set to 'ORACLE_HOME/dbs/testfile2.dat'.
LOG_ARCHIVE_DEST_n initialization parameter already set for local archival.
Initialization parameter LOG_ARCHIVE_DEST_2 set to 'location=use_db_recovery_file_dest valid_for=(all_logfiles, all_roles)'.
Initialization parameter LOG_ARCHIVE_DEST_STATE_2 set to 'Enable'.
Initialization parameter STANDBY_FILE_MANAGEMENT set to 'MANUAL'.
Standby log group 4 will be dropped because it was not configured correctly.
Standby log group 3 will be dropped because it was not configured correctly.
Adding standby log group size 26214400 and assigning it to thread 1.
Initialization parameter STANDBY_FILE_MANAGEMENT set to 'AUTO'.
Initialization parameter DG_BROKER_START set to TRUE.
Database set to FORCE LOGGING. Database set to ARCHIVELOG.
Database set to FLASHBACK ON.
Database opened.


Hope It Helped!
Prashant Dixit

Posted in Advanced | Tagged: , , | Leave a Comment »

Getting SQL Net message from dblink, have you tried DRIVING_SITE hint ?

Posted by FatDBA on June 27, 2021

Hi Guys,

Last week I was asked to take a look in to one performance problem where customer DBA reported excessive ‘SQL*Net message from dblink’ in the system. As I don’t have direct access to the box, I asked him to share both AWR and ASH performance reports for the time when they observe the problem. And yes, he was right, there were few waits on this event but with very high average elapsed times or single execution times. Next I verified the ASH data for the period and I was able to identify this SQL (SELECT) which is frequently waiting on this wait tvent.

About this event, as you guys know SQL Net messages are classified as Network classed events and happens when some part of the final dataset is coming from a remote database which is accessed via DBLink. Alright, so we know the problem and we have the problematic SQL, let’s simulate the problem and the solution.

I will first create the DBLink that I will be using to access the remote data which is present in a different database on a different server/host and next I will create the sample table with some test data both on Site A and Site B.

Reference used:
BIGTAB: Table on Site 1, local site.
BIGTAB2: Table on site 2, remote location

SQL>
SQL> CREATE DATABASE LINK dixitdlink1
  2     CONNECT TO dixit IDENTIFIED BY oracle90
   USING '(DESCRIPTION=
            (ADDRESS = (PROTOCOL = TCP)(HOST = canttowinsec.quebecdomain)(PORT = 1521))
            (CONNECT_DATA=(SERVICE_NAME=dhavaldb.quebecdomain))
          )';  

Database link created.

SQL>


-- On source database, on local host.
CREATE TABLE BIGTAB (
   id         NUMBER,
   weight     NUMBER,
   adate      DATE
);

Table created.

INSERT INTO BIGTAB (id, weight, adate)
SELECT MOD(ROWNUM,1000),
       DBMS_RANDOM.RANDOM,
       SYSDATE-1000+DBMS_RANDOM.VALUE(0,1000)
 FROM all_objects
/

67447 rows created.


SQL> delete from prashant.BIGTAB where rownum < 60000;

59999 rows deleted.


-- This I have created on target database, on a remote host.
CREATE TABLE BIGTAB2 (
   id         NUMBER,
   weight     NUMBER,
   adate      DATE
);

Table created.


INSERT INTO BIGTAB2 (id, weight, adate)
SELECT MOD(ROWNUM,1000),
       DBMS_RANDOM.RANDOM,
       SYSDATE-1000+DBMS_RANDOM.VALUE(0,1000)
 FROM all_objects
/

67447 rows created.

Alright, the test data is created on both the sites, and in order to mimic the exact case that I’d faced, I have intentionally deleted 59999 table from table that exists in site 1. So now we have table BIGTAB with 7735 records and on remote database we have a table with name BIGTAB2 with 67447 rows. Let’s execute few queries and do a Inner Join on both the tables.

Test 1: With no hint or tuning/tweaking of any kind. Asking to bring all data from remote site here to local site and then perform the join operation or this can also be done if we put the hint and mention name of the local table, or table that is small i.e. /*+ DRIVING_SITE(BIGTAB) */

SQL> select * from prashant.BIGTAB, dixit.BIGTAB2@dixitdlink1 where ADATE=DATEOFREGISTER;

        ID     WEIGHT ADATE             ID     WEIGHT DATEOFREG
---------- ---------- --------- ---------- ---------- ---------
       502 -1.363E+09 09-MAR-20        989 1353403341 09-MAR-20
       577 -185863752 22-FEB-21        247 -626839962 22-FEB-21
........
............
...............
.................


Execution Plan
----------------------------------------------------------
Plan hash value: 2705338834

----------------------------------------------------------------------------------------------
| Id  | Operation          | Name    | Rows  | Bytes | Cost (%CPU)| Time     | Inst   |IN-OUT|
----------------------------------------------------------------------------------------------
|   0 | SELECT STATEMENT   |         | 19931 |  1362K|   144   (0)| 00:00:01 |        |      |
|*  1 |  HASH JOIN         |         | 19931 |  1362K|   144   (0)| 00:00:01 |        |      |
|   2 |   TABLE ACCESS FULL| BIGTAB  |  6948 |   237K|    68   (0)| 00:00:01 |        |      |
|   3 |   REMOTE           | BIGTAB2 | 19930 |   681K|    76   (0)| 00:00:01 | DIXIT~ | R->S |
----------------------------------------------------------------------------------------------

Predicate Information (identified by operation id):
---------------------------------------------------

   1 - access("ADATE"="DATEOFREGISTER")

Remote SQL Information (identified by operation id):
----------------------------------------------------

   3 - SELECT "ID","WEIGHT","DATEOFREGISTER" FROM "DIXIT"."BIGTAB2" "BIGTAB2"
       (accessing 'DIXITDLINK1.ONTADOMAIN' )


Note
-----
   - dynamic statistics used: dynamic sampling (level=2)

So, this was happening there on that day, on that system with that query waiting on ‘SQL*Net message from dblink‘, now this is the right time I should introduce the DRIVING_SITE hint, I have been trying and experimenting with this hint for a long time now, maybe since my 9i days.

This hint is useful for distributed queries to force optimizer to use a particular site as a driving site, or it instructs the optimizer to execute the query at a different site than that selected by the database. Like in previous test case all rows from remote host which matches the condition are sent to the local site and the join is finally executed on the local site.

Now, I am going to use the DRIVING_SITE (will mention name of the remote table) and force the optimizer to perform all join operations at the remote site, hence the query will be executed there and the result set is returned to the local site.

So, you should try with the DRIVING_SITE hint on the site where the huge table resides!

Test 2: With DRIVING_HINT on remote table BIGTAB2 which is big and has 67447 records.

SQL> select /*+ DRIVING_SITE(BIGTAB2) */ * from prashant.BIGTAB, dixit.BIGTAB2@dixitdlink1 where ADATE=DATEOFREGISTER;

        ID     WEIGHT ADATE             ID     WEIGHT DATEOFREG
---------- ---------- --------- ---------- ---------- ---------
       502 -1.363E+09 09-MAR-20        989 1353403341 09-MAR-20
       577 -185863752 22-FEB-21        247 -626839962 22-FEB-21
.....
.......
........
..........


Execution Plan
----------------------------------------------------------
Plan hash value: 2214131741

--------------------------------------------------------------------------------------------------
| Id  | Operation              | Name    | Rows  | Bytes | Cost (%CPU)| Time     | Inst   |IN-OUT|
--------------------------------------------------------------------------------------------------
|   0 | SELECT STATEMENT REMOTE|         |    82 |  5740 |    70   (0)| 00:00:01 |        |      |
|*  1 |  HASH JOIN             |         |    82 |  5740 |    70   (0)| 00:00:01 |        |      |
|   2 |   REMOTE               | BIGTAB  |    82 |  2870 |     2   (0)| 00:00:01 |      ! | R->S |
|   3 |   TABLE ACCESS FULL    | BIGTAB2 | 53126 |  1815K|    68   (0)| 00:00:01 | DHAVA~ |      |
--------------------------------------------------------------------------------------------------

Predicate Information (identified by operation id):
---------------------------------------------------

   1 - access("A2"."ADATE"="A1"."DATEOFREGISTER")

Remote SQL Information (identified by operation id):
----------------------------------------------------

   2 - SELECT "ID","WEIGHT","ADATE" FROM "PRASHANT"."BIGTAB" "A2" (accessing '!' )


Note
-----
   - fully remote statement
   - dynamic statistics used: dynamic sampling (level=2)

Look at the cost, rows processed and bytes (data processed), all of them are reduced by a great extent. Of course not much elapsed time difference you see here in this example as the dataset is small and is a less complex query, you can try it yourself and see the magic!

Hope It Helped!
Prashant Dixit

Posted in Advanced, troubleshooting | Tagged: , , | Leave a Comment »

Running on Oracle 19c ? – Why to enable full supplemental logging when SUBSET DATABASE REPLICATION is there

Posted by FatDBA on June 26, 2021

Hi Folks,

Today’s post is about one of the cool feature added in Oracle 19c, that is very useful and I recently discovered about it while working on one GG setup.

This is about Supplemental logging which enables database to capture extra logging for a redo-based application i.e. logical standby or Golden Gate, this may require that additional columns be logged in the redo log files and causes a great stress and overhead on the database. Things looks very unworthy specially if you are doing only a partial Golden Gate replication, I mean for only few tables.

Starting from Oracle 19c, this is something that you can now control. With this version, you can enable the fine grain supplemental logging (SUBSET DATABASE REPLICATION) which will reduce lot of logging overhead. This feature allows you to disable supplemental logging on the entire database and on all tables. So, if you are running on Oracle 19c and your have the COMPATIBLE parameter to 19.0.0.0.0 or greater and have enabled enable_goldengate_replication parameter to TRUE, you can use this option.

Note: I know few of the products where ‘Supplemental Log Data Subset Database Replication’ doesn’t work or the product doesn’t support it, i.e. HVR 6

SQL> select BANNER_FULL from v$version;

BANNER_FULL
--------------------------------------------------------------------------------
Oracle Database 19c Enterprise Edition Release 19.0.0.0.0 - Production
Version 19.3.0.0.0


SQL> SELECT  FORCE_LOGGING, supplemental_log_data_min, supplemental_log_data_sr from v$database;

FORCE_LOGGING                           SUPPLEMENTAL_LOG_DATA_MIN                                    SUPPLEMENTAL_LOG_DATA_SR
--------------------------------------- ------------------------------------------------------------ ----------------------------------------
YES                                     YES                                                          NO


SQL> ALTER DATABASE ADD SUPPLEMENTAL LOG DATA SUBSET DATABASE REPLICATION;

Database altered.

SQL> SELECT  FORCE_LOGGING, supplemental_log_data_min, supplemental_log_data_sr from v$database;

FORCE_LOGGING                           SUPPLEMENTAL_LOG_DATA_MIN                                    SUPPLEMENTAL_LOG_DATA_SR
--------------------------------------- ------------------------------------------------------------ ----------------------------------------
YES                                     YES                                                          YES

You can disable it anytime using below mentioned steps/commands.

SQL>
SQL> ALTER DATABASE ADD SUPPLEMENTAL LOG DATA;

Database altered.

SQL>  ALTER DATABASE DROP SUPPLEMENTAL LOG DATA SUBSET DATABASE REPLICATION;

Database altered.

SQL> SELECT  FORCE_LOGGING, supplemental_log_data_min, supplemental_log_data_sr from v$database;

FORCE_LOGGING                           SUPPLEMENTAL_LOG_DATA_MIN                                    SUPPLEMENTAL_LOG_DATA_SR
--------------------------------------- ------------------------------------------------------------ ----------------------------------------
YES                                     YES                                                          NO

Hope It Helps!
Prashant Dixit

Posted in Advanced | Tagged: , , | 2 Comments »

‘WARNING OGG-00552, ODBC error: SQLSTATE IM002 native database error 0. [DataDirect][ODBC lib]’ while doing data migration from Oracle to PostgreSQL using Golden Gate …

Posted by FatDBA on June 24, 2021

Hey Guys,

Just a question – Have you ever received below error message while doing the data migration from Oracle to PostgreSQL database using Golden Gate ?

GGSCI (canttowin.ontadomain) 2> dblogin sourcedb ora19topg12 userid opeth
Password:

2021-06-23 14:52:32  WARNING OGG-00552 Database operation failed: Couldn't connect to odbc. 
ODBC error: SQLSTATE IM002 native database error 0. 
[DataDirect][ODBC lib] Data source name not found and no default driver specified.
ERROR: Database operation failed: Couldn't connect to ora19topg12. 
ODBC error: SQLSTATE IM002 native database error 0. 
[DataDirect][ODBC lib] Data source name not found and no default driver specified Failed to open data source ora19topg12 for user opeth.

If yes, then few of things that you can always go and check!

First, check if your pg_hba.conf has below entries, so that ALL clients can connect. The sample below just means that all clients can connect to the Postgres database. Commonly this could show more restrictive setting depending on business rules, so it is always worth to have a look at this file when clients can not connect to the Postgres database using the ODBC driver.

# IPv4 local connections:
host    all             all             0.0.0.0/0             md5

Second, check for listen_adress parameter in postgresql.conf file on your PostgreSQL host. You can set it as ‘*’ (just like below), that means that Postgres listens on all available addresses.

# - Connection Settings -

listen_addresses = '*'          # what IP address(es) to listen on;
                                # comma-separated list of addresses;
                                # defaults to 'localhost'; use '*' for all
                                # (change requires restart)

Third, after all these changes, don’t forget to rebooted your PostgreSQL database ….

Hopefully after all above actions, you will be able to resolve the problem, if not, please let me know that through comments, I can try and help!

Hope It Helped!
Prashant Dixit

Posted in Advanced | Tagged: , , , | Leave a Comment »

Golden Gate HEARTBEAT TABLE and its improvements in GG 19.1

Posted by FatDBA on June 23, 2021

Hi Mates,

This week I was working on one Golden Gate upgrade from 12.2 to 19.1, and have noticed few new features & improvements related to the HEARTBEAT TABLE. If you are yet to explore about it, you should do it now!. It’s a fantastic feature which provides some interesting delay/wait related information which LAG command failed to provide. Starting from GG 12.2 Oracle has a built in Heartbeat table which presents some really cool information and houses historical information too.

Let me show you why is it good to have them in your GG setup – Let’s quickly add the table to your setup, connect with your gg user and add the table.

GGSCI (canttowin.ontadomain as gger@dixitdb) 31> add heartbeattable
2021-06-22 14:42:57  INFO    OGG-14001  Successfully created heartbeat seed table ""gger"."GG_HEARTBEAT_SEED"".
2021-06-22 14:42:57  INFO    OGG-14089  Successfully tracking extract restart position with heartbeat table ""gger"."GG_HEARTBEAT_SEED"".
2021-06-22 14:43:04  INFO    OGG-14032  Successfully added supplemental logging for heartbeat seed table ""gger"."GG_HEARTBEAT_SEED"".
2021-06-22 14:43:04  INFO    OGG-14000  Successfully created heartbeat table ""gger"."GG_HEARTBEAT"".
2021-06-22 14:43:04  INFO    OGG-14089  Successfully tracking extract restart position with heartbeat table ""gger"."GG_HEARTBEAT"".
2021-06-22 14:43:04  INFO    OGG-14033  Successfully added supplemental logging for heartbeat table ""gger"."GG_HEARTBEAT"".
2021-06-22 14:43:04  INFO    OGG-14016  Successfully created heartbeat history table ""gger"."GG_HEARTBEAT_HISTORY"".
2021-06-22 14:43:04  INFO    OGG-14089  Successfully tracking extract restart position with heartbeat table ""gger"."GG_HEARTBEAT_HISTORY"".
2021-06-22 14:43:04  INFO    OGG-14086  Successfully disabled partitioning for heartbeat history table ""gger"."GG_HEARTBEAT_HISTORY"".
2021-06-22 14:43:04  INFO    OGG-14023  Successfully created heartbeat lag view ""gger"."GG_LAG"".
2021-06-22 14:43:04  INFO    OGG-14024  Successfully created heartbeat lag history view ""gger"."GG_LAG_HISTORY"".
2021-06-22 14:43:05  INFO    OGG-14003  Successfully populated heartbeat seed table with "DIXITDB".
2021-06-22 14:43:05  INFO    OGG-14004  Successfully created procedure ""gger"."GG_UPDATE_HB_TAB"" to update the heartbeat tables.
2021-06-22 14:43:05  INFO    OGG-14017  Successfully created procedure ""gger"."GG_PURGE_HB_TAB"" to purge the heartbeat history table.
2021-06-22 14:43:06  INFO    OGG-14005  Successfully created scheduler job ""gger"."GG_UPDATE_HEARTBEATS"" to update the heartbeat tables.
2021-06-22 14:43:06  INFO    OGG-14018  Successfully created scheduler job ""gger"."GG_PURGE_HEARTBEATS"" to purge the heartbeat history table.

Let’s check some details about it.

GGSCI (canttowin.ontadomain as gger@dixitdb) 45> info heartbeattable

HEARTBEAT table gger.gg_heartbeat exists.
HEARTBEAT table gger.gg_heartbeat_seed exists.
HEARTBEAT table gger.gg_heartbeat_history exists.
HEARTBEAT table gger.gg_heartbeat supplemental logging ENABLED.
HEARTBEAT table gger.gg_heartbeat_seed supplemental logging ENABLED.
HEARTBEAT table gger.gg_heartbeat_history partitioning DISABLED.
Frequency interval: 60 seconds.
Purge frequency interval: 1 days.
Retention time: 30 days.

Now when the table is successfully created, let’s check lag/delay stats both using LAG command and through new dynamic views created for the purpose.

GGSCI (canttowin.ontadomain as gger@dixitdb) 32> lag

Lag Information From Heartbeat Table

LAG                 AGE                 FROM                TO                  PATH
6.97s               24.24s              DHAVALDB            DIXITDB             DXQUEX ==> DXQUDP ==> DXONRP
4.82s               59.12s              DIXITDB             DHAVALDB            DXONEX ==> DXONDP ==> DXQUERP


SQL> col local_database format a10
col current_local_ts format a30
col remote_database format a10
col INCOMING_HEARTBEAT_AGE for a30
col incoming_path format a30
col incoming_lag format 999,999.999999

select LOCAL_DATABASE, CURRENT_LOCAL_TS, REMOTE_DATABASE,
INCOMING_HEARTBEAT_AGE, INCOMING_PATH, INCOMING_LAG
from GGER.GG_LAG;

LOCAL_DATA CURRENT_LOCAL_TS               REMOTE_DAT INCOMING_HEARTBEAT_AGE INCOMING_PATH                     INCOMING_LAG
---------- ------------------------------ ---------- ---------------------- ------------------------------ ---------------
DHAVALDB   22-JUN-21 06.45.42.581334 PM   DIXITDB                ##########  DXONEX ==> DXONDP ==> DXQUERP        4.754468


set pagesize 100
col local_database format a10
col heartbeat_received_ts format a30
col remote_database format a10
col incoming_path format a32
col incoming_lag format 999,999.999999

select local_database, heartbeat_received_ts, remote_database, incoming_path, incoming_lag from gger.gg_lag_history;

LOCAL_DATA HEARTBEAT_RECEIVED_TS          REMOTE_DAT INCOMING_PATH                       INCOMING_LAG
---------- ------------------------------ ---------- -------------------------------- ---------------
DHAVALDB   22-JUN-21 06.43.19.624247 PM   DIXITDB     DXONEX ==> DXONDP ==> DXQUERP         12.401984
DHAVALDB   22-JUN-21 06.44.11.776929 PM   DIXITDB     DXONEX ==> DXONDP ==> DXQUERP          5.167206
DHAVALDB   22-JUN-21 06.45.10.898463 PM   DIXITDB     DXONEX ==> DXONDP ==> DXQUERP          4.754468
DHAVALDB   22-JUN-21 06.46.10.996575 PM   DIXITDB     DXONEX ==> DXONDP ==> DXQUERP          4.823870
DHAVALDB   22-JUN-21 06.47.13.057097 PM   DIXITDB     DXONEX ==> DXONDP ==> DXQUERP          6.839796
DHAVALDB   22-JUN-21 06.48.13.163290 PM   DIXITDB     DXONEX ==> DXONDP ==> DXQUERP          7.016913

Now coming back to the learnings from this upgrade, I have learned two new things about GG heartbeat table which are specific to GG version 19.1

  1. Stating with Oracle Golden Gate 19.1 the command UPGRADE HEARTBEATTABLE is available to alter heartbeat table generated by the ADD HEARTBEATTABLE command using a previous Oracle Golden Gate release. So, if you have just completed your upgrade of GG, run the UPGRADE HEARTBEATTABLE command to add extra columns for tables and lag views. These extra columns are used to track the Extract restart position
GGSCI (canttowin.ontadomain as gger@dixitdb) 44> UPGRADE HEARTBEATTABLE
  1. NOADDTRANDATA option of ADD HEARTBEATTABLE has been deprecated in 19.1

Hope It Helped!
Prashant Dixit

Posted in Advanced | Tagged: , | Leave a Comment »

Lets spread some Chaos – Gremlin Chaos Engineering Practitioner Certification

Posted by FatDBA on June 17, 2021

Chaos Engineering is a disciplined approach of identifying potential failures before they become outages, and its engineering practices focused on (and built on) Kubernetes environments, applications, microservices, and infrastructure (including Databases, storage or networking).

Gremlin provides a ‘failure-as-a-service’ testing platform or a toolset built to make systems more reliable. It turns failure into resilience by offering engineers a fully hosted solution to safely experiment on complex systems, in order to identify weaknesses before they impact customers and cause revenue loss. It can be easily tested on any of the infrastructure components to avoid single point of failures and to remove any FPs make system more HA and failsafe.

So, this you can recommend to any of your customer before they go live, should test the infra by generating intentional chaos to test respective zones, services, software  component, Storage (Disk space etc.), Databases (Cluster, replicas, standbys), Applications (Kubernetes etc.) and Networks.

About exam – This certification tests your knowledge on Chaos Engineering concepts like Gremlin platform, GameDay, MoD (Master of disaster) and other similar experiments and techniques.

Exam is free of cost and if you have any prior knowledge you can directly go and give the exam, but its good to attend their free prep session. There is not any time limit, and you have to answer 20 questions in total. Passing percentage required is 80% and you have 2 attempts in total to do that.

Direct link to certification: https://www.gremlin.com/blog/announcing-the-gremlin-chaos-engineering-practitioner-certificate-program/

Link for free prep session registration: https://www.gremlin.com/webinars/gremlin-certificate-prep-session/

Hope It Helped!
Prashant Dixit

Posted in Basics | Tagged: , | 4 Comments »