Tales From A Lazy Fat DBA

Its all about Databases & their performance, troubleshooting & much more …. ¯\_(ツ)_/¯

Posts Tagged ‘analysis’

Prerequisite check CheckActiveFilesAndExecutables failed while applying July 2022 GI Release Update 19.16.0.0.220719, and the magic of opatchauto resume

Posted by FatDBA on August 8, 2022

Hi All,

Recently while applying the latest (July 2022) GI Release Update 19.16.0.0.220719 on GI+DB homes I’ve encountered an issue where the GI patching failed with an (expected) error ‘oracle.opatch.opatchsdk.OPatchException: Prerequisite check “CheckActiveFilesAndExecutables” failed’ and ended with ‘OPATCHAUTO-68061: The orchestration engine failed‘. Below pasted is what exactly happened …

[root@monkeybox patches]# /test/patch/dir/grid/OPatch/opatchauto apply /patchdir/july2022/34130714

OPatchauto session is initiated  
.....
..........

Performing prepatch operations on CRS - bringing down CRS service on home /test/patch/dir/grid
Prepatch operation log file location: /testdir/app/grid/crsdata/monkeyboxcrsconfig/hapatch_xxxxxx.log
CRS service brought down successfully on home /test/dir/grid

Start applying binary patch on home /oracledir/app/oracle/product/19c/dbhome
Binary patch applied successfully on home /oracledir/app/oracle/product/19c/dbhome

Start applying binary patch on home /test/patch/dir/grid
Failed while applying binary patches on home /test/patch/dir/grid   >>>>>>>>>>>>>>>>>>>>>>>>>>>>>>>>>>>

Execution of [OPatchAutoBinaryAction] patch action failed, check log for more details. Failures:
Patch Target : monkeybox->/test/patch/dir/grid Type[siha]
Details: [
---------------------------Patching Failed---------------------------------
Command execution failed during patching in home: /test/patch/dir/grid, host: monkeybox.
Command failed:  /test/patch/dir/grid/OPatch/opatchauto  apply /patchdir/july2022/34130714 -oh /test/patch/dir/grid -target_type has -binary -invPtrLoc /test/patch/dir/grid/oraInst.loc -jre /test/patch/dir/grid/OPatch/jre -persistresult /test/patch/dir/grid/opatchautocfg/db/sessioninfo/sessionresult_monkeybox_siha_1.ser -analyzedresult /test/patch/dir/grid/opatchautocfg/db/sessioninfo/sessionresult_analyze_monkeybox_siha_1.ser
Command failure output:
==Following patches FAILED in apply:

Patch: /patchdir/july2022/34130714/33575402
Log: /test/patch/dir/grid/cfgtoollogs/opatchauto/core/opatch/xxxx.log
Reason: Failed during Patching: oracle.opatch.opatchsdk.OPatchException: Prerequisite check "CheckActiveFilesAndExecutables" failed.

Patch: /patchdir/july2022/34130714/34133642
Log: /test/patch/dir/grid/cfgtoollogs/opatchauto/core/opatch/xxxxxxxxx.log
Reason: Failed during Patching: oracle.opatch.opatchsdk.OPatchException: Prerequisite check "CheckActiveFilesAndExecutables" failed. >>>>>>>>>>>>>

Patch: /patchdir/july2022/34130714/34139601
Log: /test/patch/dir/grid/cfgtoollogs/opatchauto/core/opatch/xxxxxxxxx.log
Reason: Failed during Patching: oracle.opatch.opatchsdk.OPatchException: Prerequisite check "CheckActiveFilesAndExecutables" failed. >>>>>>>>>>>>>

Patch: /patchdir/july2022/34130714/34160635
Log: /test/patch/dir/grid/cfgtoollogs/opatchauto/core/opatch/xxxxxxxxx.log
Reason: Failed during Patching: oracle.opatch.opatchsdk.OPatchException: Prerequisite check "CheckActiveFilesAndExecutables" failed. >>>>>>>>>>>>>

Patch: /patchdir/july2022/34130714/34318175
Log: /test/patch/dir/grid/cfgtoollogs/opatchauto/core/opatch/xxxxxxxxx.log
Reason: Failed during Patching: oracle.opatch.opatchsdk.OPatchException: Prerequisite check "CheckActiveFilesAndExecutables" failed. >>>>>>>>>>>>>

After fixing the cause of failure Run opatchauto resume  >>>>>>>>>>>>>

]
OPATCHAUTO-68061: The orchestration engine failed. >>>>>>>>>>>>>
OPATCHAUTO-68061: The orchestration engine failed with return code 1
OPATCHAUTO-68061: Check the log for more details.
OPatchAuto failed.

OPatchauto session completed at xxxxxxxxx
Time taken to complete the session 8 minutes, 50 seconds

This is a classic case where the patching failed as there were few executables/files from the HOME still active. Same you can verify in the standard logging directory cfgtoollogs for opatchauto for the patch failed.

[INFO]    Prerequisite check "CheckActiveFilesAndExecutables" failed.
The details are:

Following active files/executables/libs are used by ORACLE_HOME :/test/dir/grid

/test/dir/grid/lib/libclntsh.so.19.1
/test/dir/grid/lib/libasmclntsh19.so

The easiest way to fix this issue is to find which opened process is using a file, a directory or a socket, and that you can do it using fuser command. The fuser command lists the process numbers of local processes that use the local or remote files specified by the File parameter. Let’s do it!

[grid@monkeybox ~]$
[grid@monkeybox ~]$ /sbin/fuser /test/dir/grid/lib/libclntsh.so.19.1
/test/dir/grid/lib/libclntsh.so.19.1: 18199m
[grid@monkeybox ~]$
[grid@monkeybox ~]$ /sbin/fuser /test/dir/grid/lib/libasmclntsh19.so
/test/dir/grid/lib/libasmclntsh19.so: 18199m
[grid@monkeybox ~]$
[grid@monkeybox ~]$
[grid@monkeybox ~]$
[grid@monkeybox ~]$ ps -ef|grep 18199
grid     18199 13587  0 09:34 pts/2    00:00:00 /test/dir/grid/perl/bin/perl -w -I /test/dir/grid/perl/lib/5.32.0 -I /test/dir/grid/perl/lib/site_perl/5.32.0 -I /test/dir/grid/lib -I /test/dir/grid/lib/asmcmd -I /test/dir/grid/rdbms/lib/asmcmd /test/dir/grid/bin/asmcmdcore
grid     29647 16974  0 10:11 pts/3    00:00:00 grep --color=auto 13610
[grid@monkeybox ~]$
[grid@monkeybox ~]$
[grid@monkeybox ~]$ kill -9 18199
[grid@monkeybox ~]$

Now when we have killed those two opened files (libclntsh.so.19.1 and libasmclntsh19.so), lets resume the patch from the same spot where it has left last time before crashing. I mean opatchauto was able to patch DB HOME before it failed while applying it on GI HOME. So, this will resume from the same spot and will igore previous applied patches. So, will use ‘opatchauto resume’ instruction/command as this operation resumes a previous patching session.

opatchauto is a really powerful tool which even let you resume your patch even when the patching crashed in between by any reasons like server crash, reboot cases or even manual CTRL+C etc. The other two regular options are rollback and version.

[root@monkeybox patches]# /test/dir/grid/OPatch/opatchauto resume

OPatchauto session is initiated at xxxxxxxxx
Session log file is .....
Resuming existing session with id xxxxxx
....
.......
...............
OPatchAuto successful.

Patching is completed successfully. Please find the summary as follows:

OPatchauto session completed at xxxxxx
Time taken to complete the session 9 minutes, 12 seconds

[root@monkeybox patches]#

Hope It Helped!
Prashant Dixit

Advertisement

Posted in troubleshooting | Tagged: , , , , , | Leave a Comment »

Visualize your database performance statistics using Tableau.

Posted by FatDBA on January 28, 2018

Hi Everyone,

Today’s post is all about producing some interactive data visualizations your system/database statistics using one of the most popular BI tool Tableau.
There are lot’s of other tools which can be used for your data analysis i.e. Excel, Microstrategy Analytics, Domo, QlikView but i always find Tableau easiest way to do such things, specially during all my database audit, 360 health reviews and troubleshooting task-forces.

Tableau offers a suite of tools that include an online, desktop and server version. All of these versions provide a easy-to-use drag and drop interface that can help you quickly turn your data into business insights. Like many other data analytics and visualization tools, Tableau can connect to local or remote data of many different formats.

Okay now after that short introduction of the tool, time to do some tests using the tool.
I have divided process in to three step activity and are discussed below.

First: Data Collection
You can collect your AWR reports in TEXT format and which will be later on parsed to create a CSV file.
There are many tools/scripts available online to generate multiple AWR reports of your database. I see an awesome work was already done by FlashDBA (Download). You can use his script to generate batch AWR reports and yes in TEXT format ONLY!

Example:

[oracle@dixitlab AWR]$ ls -ltr
total 12852
-rw-r--r--. 1 oracle oinstall 225031 Jan 27 21:25 awrrpt_1_445_446.txt
-rw-r--r--. 1 oracle oinstall 255010 Jan 27 21:26 awrrpt_1_446_447.txt
-rw-r--r--. 1 oracle oinstall 253217 Jan 27 21:26 awrrpt_1_447_448.txt
-rw-r--r--. 1 oracle oinstall 253217 Jan 27 21:26 awrrpt_1_448_449.txt
-rw-r--r--. 1 oracle oinstall 244229 Jan 27 21:26 awrrpt_1_449_450.txt
........
.................

Second: Data Fold or Compression.
Now next you need a tool to fold your AWR reports in to a CSV. Here once again FlashDBA did a marvelous job, he wrote one fabulous script to parse your AWR text files and generate a final AWR report.
You can download the script from his Github (Download Link)

As far as the script, you need to pass the format of your files and direct output to a CSV as shown below.

[oracle@dixitlab AWR]$ ./awr-parser.sh awr*.txt > tunedbperftests.csv

Info : Parsing file awrrpt_1_445_446.txt at 2018-01-27 21:32:49
Info : Parsing file awrrpt_1_446_447.txt at 2018-01-27 21:32:53
Info : Parsing file awrrpt_1_447_448.txt at 2018-01-27 21:32:56
Info : Parsing file awrrpt_1_448_449.txt at 2018-01-27 21:33:01
Info : Parsing file awrrpt_1_449_450.txt at 2018-01-27 21:33:07
Info : Parsing file awrrpt_1_450_451.txt at 2018-01-27 21:33:15
Info : Parsing file awrrpt_1_451_452.txt at 2018-01-27 21:33:21
....
........
Info : Parsing file awrrpt_1_499_500.txt at 2018-01-27 21:36:56
Info : No more files found
Info :
Info : ______SUMMARY______
Info : Files found : 55
Info : Files processed : 55
Info : Processing errors : 0
Info :
Info : Completed with 0 errors
[oracle@dixitlab AWR]$

With that you are done with the parsing of reports and have got the final CSV which we will be using to play around within Tableau.
Contents inside the parsed file.

Filename	Database Name	Instance Number	Instance Name	Database Version	Cluster	Hostname	Host OS	Num CPUs	Server Memory (GB)	DB Block Size	Begin Snap	Begin Time	End Snap	End Time	Elapsed Time (mins)	DB Time (mins)	Average Active Sessions	Busy Flag	Logical Reads/sec
awrrpt_1_445_446.txt	TUNEDB	PRIMARY	tunedb	EE	1	dixitlab.localdo	Linux x86 64-bit	1	2.77	8K	445	1/26/2018 21:57	446	1/26/2018 23:00	62.24	6.33	0.1	N	2629.5
awrrpt_1_446_447.txt	TUNEDB	PRIMARY	tunedb	EE	1	dixitlab.localdo	Linux x86 64-bit	1	2.77	8K	446	1/26/2018 23:00	447	1/27/2018 0:00	60.19	12.18	0.2	N	13973.4
awrrpt_1_447_448.txt	TUNEDB	PRIMARY	tunedb	EE	1	dixitlab.localdo	Linux x86 64-bit	1	2.77	8K	447	1/27/2018 0:00	448	1/27/2018 1:00	60.15	13.52	0.2	N	14055.8
awrrpt_1_448_449.txt	TUNEDB	PRIMARY	tunedb	EE	1	dixitlab.localdo	Linux x86 64-bit	1	2.77	8K	448	1/27/2018 1:00	449	1/27/2018 2:00	60.15	10.13	0.1	N	11597.4
awrrpt_1_449_450.txt	TUNEDB	PRIMARY	tunedb	EE	1	dixitlab.localdo	Linux x86 64-bit	1	2.77	8K	449	1/27/2018 2:00	450	1/27/2018 3:00	60.16	0.03	0	N	65.4
awrrpt_1_450_451.txt	TUNEDB	PRIMARY	tunedb	EE	1	dixitlab.localdo	Linux x86 64-bit	1	2.77	8K	450	1/27/2018 3:00	451	1/27/2018 4:00	60.12	0.02	0	N	70.3
awrrpt_1_452_453.txt	TUNEDB	PRIMARY	tunedb	EE	1	dixitlab.localdo	Linux x86 64-bit	1	2.77	8K	452	1/27/2018 5:00	453	1/27/2018 6:00	60.13	0.69	0	N	189.8
awrrpt_1_453_454.txt	TUNEDB	PRIMARY	tunedb	EE	1	dixitlab.localdo	Linux x86 64-bit	1	2.77	8K	453	1/27/2018 6:00	454	1/27/2018 7:00	60.13	2.88	0	N	2439.1
awrrpt_1_454_455.txt	TUNEDB	PRIMARY	tunedb	EE	1	dixitlab.localdo	Linux x86 64-bit	1	2.77	8K	454	1/27/2018 7:00	455	1/27/2018 8:00	60.14	12.57	0.2	N	14027.3
awrrpt_1_455_456.txt	TUNEDB	PRIMARY	tunedb	EE	1	dixitlab.localdo	Linux x86 64-bit	1	2.77	8K	455	1/27/2018 8:00	456	1/27/2018 9:00	60.14	10.11	0.1	N	13916.6
awrrpt_1_456_457.txt	TUNEDB	PRIMARY	tunedb	EE	1	dixitlab.localdo	Linux x86 64-bit	1	2.77	8K	456	1/27/2018 9:00	457	1/27/2018 10:00	60.14	10.26	0.1	N	13941.5
awrrpt_1_457_458.txt	TUNEDB	PRIMARY	tunedb	EE	1	dixitlab.localdo	Linux x86 64-bit	1	2.77	8K	457	1/27/2018 10:00	458	1/27/2018 10:50	50.25	18.67	0.3	N	14118.9

Third: Data Representation using Tableau.
Okay so here we have the final parsed CSV of all those TEXT AWR reports named ‘tunedbperftests.csv’ and we are ready to play around and learn.

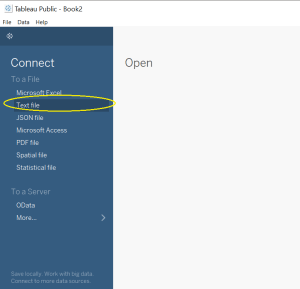
Immediately after launching you will see couple of options available for Data Sources on the left. Choose TEXT as the source and browse the CSV to load.

Next you will see all rows of your data source (tunedbperftests.csv in our case) file.

Next click on Worksheet, your personal area to play.

Tableau then divides the data in two main types: dimensions and measures. Dimensions are usually those fields that cannot be aggregated; measures, as its name suggests, are those fields that can be measured, aggregated, or used for mathematical operations. Dimension fields are usually used for row or column headings; measures are usually used for plotting or giving values to the sizes of markers.


Next tab is for Analytical functions, i.e. If you want to add a constant, average, mean, median averages or any reference lines to your graph/chart.

All good now, so we all all set yto plot out performance charts for that DB historical information that we have collected in the form of CSV and loaded to Tableau. Lets, plot for average hard parse per/second, Average DB Time, Average Pareses, Average Transactions happened against Time (Hourly rate of BEGIN TIME as a measure).

So, using above Area Graph you have plotted the average metric usages on the database during a time period.

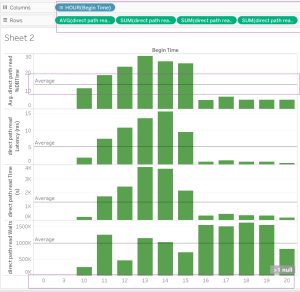
Next, i will visualize one of the most prominent db wait event observed in the database during the probe (data collection) period ‘DPR’ or ‘Direct Path Reads’ and will plot the Bar graph against the TIME (Hourly BEGIN TIME).

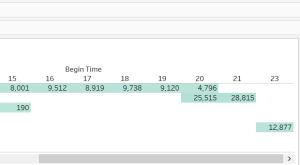
Some more stats visualisations, this time ‘top 5 waits‘ and their hourly frequency.

There are lot’s of other things that you can do with your statistics, i mean you can plot your data in the form of Square, side by side circle, polygon, pie char, polygons, gantt bar, line graph, area graphs, box-and-whisker plots, highlight tables and many more.

So, imagine and you can visualize your database statistics using Tableau!

Questions are welcome. Happy reading! 🙂 🙂

Hope It Helps
Prashant Dixit

Posted in Advanced, troubleshooting | Tagged: , , | Leave a Comment »

 
%d bloggers like this: