Tales From A Lazy Fat DBA

Its all about Databases, their performance, troubleshooting & much more …. ¯\_(ツ)_/¯

Posts Tagged ‘Database’

A simple script to automatically catch those intermittent database performance issues …

Posted by FatDBA on December 16, 2023

Hi All,

Occasionally, anticipating the occurrence of a problem becomes unpredictable, and simultaneously, dealing manually with a transient issue to extract necessary information may not always be feasible (mainly due to the rapid resolution of the problem before we can initiate the extraction process). Additionally, there is a requirement for adaptability in the content we aim to extract.

The ensuing approach allows us to attain our primary objectives without resorting to invasive measures. There could be multiple use cases, few of the scenarios would be :
Case 1 : With little changes to it, you can make it employable for gathering solely the system state upon encountering a specific wait event.
Case 2: Can be utilized for gathering 10046, error stack, etc., for the obstructing session when a designated wait event is triggered concurrently with the execution of a known SQL statement (SQL_ID).
Case 3: Utilizable for obtaining hang analysis, system state, and additionally, 10046, error stack for the session causing the obstruction when a specific wait event is encountered.

Let me explain how we can utilize this quick, short but handy code to generate the diagnostic dump like hanganalyze / systemstate / errorstack / 10046 trace etc if any session is found to be waiting on any specific wait event for any specific period of time.

This is the simple script to collect diagnostic information with few of the customizable parameters or inputs i.e. ‘waitevent’ which is for the event we know we have the problem with, ‘seconds’ is the amount of time we think a session can wait on that session before we decide it is stuck and want to trigger dumping and ‘tid’ which is the session we are going to attach to run oradebug against. This could be the waiting session, a blocking session.

In the example, I have modified the code to collect diag info if any session is found to be waiting on “enq: TX – row lock contention” waits above 10 seconds.

set serverout on
spool logit.sql
declare
waitevent varchar2(100):='enq: TX - row lock contention';
seconds number :=10;      
w1 v$session%rowtype;
w2 v$session%rowtype;
tid number := 0;

begin

loop
dbms_lock.sleep(seconds);
begin
select * into w1 
from v$session 
where event=waitevent and wait_time=0 and rownum=1;
dbms_lock.sleep(seconds);
select * into w2
from v$session
where wait_time=0
and sid=w1.sid
and event=waitevent
and seq#=w1.seq# ;
select spid into tid from v$process
where addr=(select paddr from v$session where sid=w2.blocking_session);
dbms_output.put_line('oradebug setospid '||tid);
dbms_output.put_line('oradebug unlimit');
dbms_output.put_line('oradebug hanganalyze 3');  /**If RAC then use -G all**/
dbms_output.put_line('oradebug tracefile_name');
dbms_output.put_line('exit');
exit;
exception
when no_data_found then null;
end;
end loop;
end;
/
exit


-- Result : 
SQL>  
oradebug setospid 6794
oradebug unlimit
oradebug hanganalyze 3
oradebug tracefile_name
exit

PL/SQL procedure successfully completed.

SQL> 

The subsequent instance is intricate yet showcases versatility of this simple script. In this scenario, I encounter an intermittent issue involving sessions experiencing wait times due to TX enqueue row lock contention. While I may not be overly concerned about these sessions, it is crucial for me to understand the actions of the session causing the blockage. Given that I am aware of the SQL being executed during that period, I can leverage this information to ensure accurate trapping of the relevant event.
Here is something that you can do to alter it accordingly.

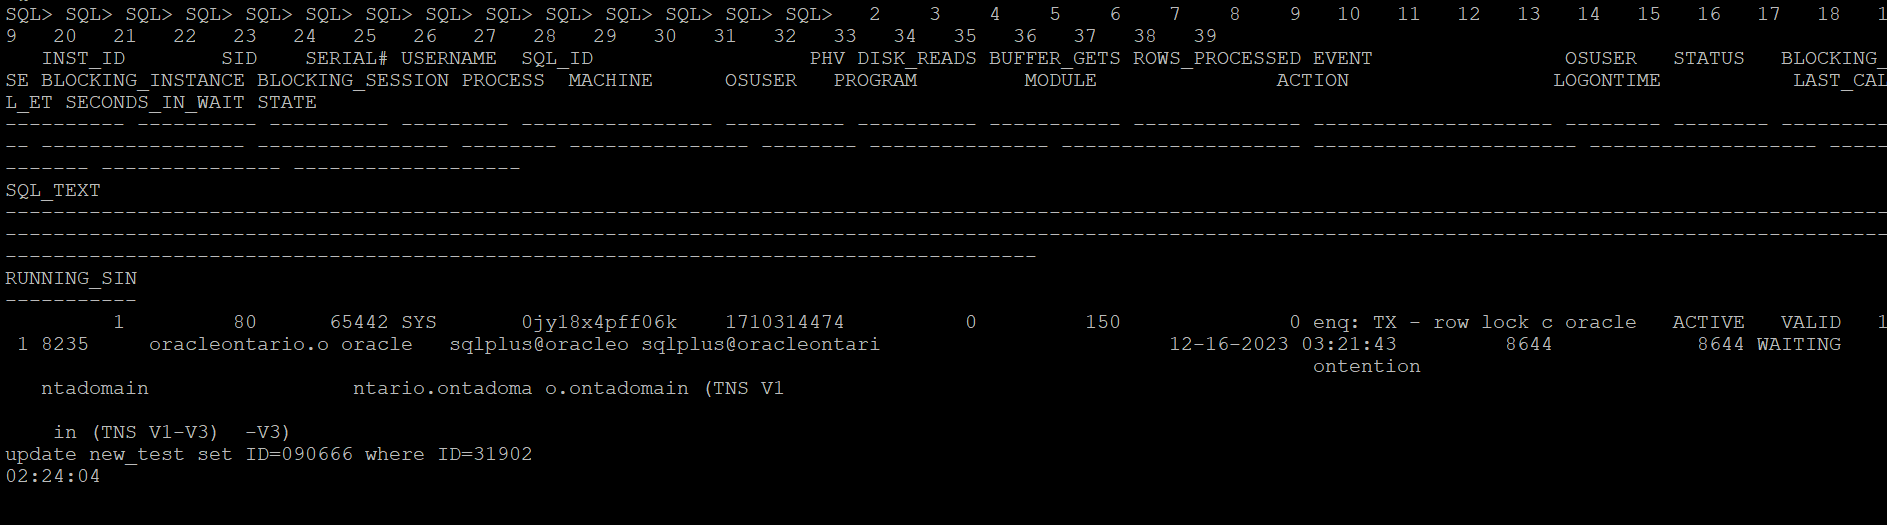
Let me create a row locking situation and see how it captures stats for a particular SQLID. Below is the row locking case that I have created to test how the scripts catches details for this SQLID ‘0jy18x4pff06k’

This is the modified version of the script which catches details for the SQL waiting on any specific wait event.

set serverout on
spool logit.sql
declare
waitevent varchar2(100):='enq: TX - row lock contention';
seconds number :=10;
w1 v$session%rowtype;
w2 v$session%rowtype;
tid number := 0;

begin

loop
dbms_lock.sleep(seconds);
begin
select * into w1
from v$session
where event=waitevent and wait_time=0 and sql_id='0jy18x4pff06k' and rownum=1;
dbms_lock.sleep(seconds);
select * into w2
from v$session
where wait_time=0
and sid=w1.sid
and event=waitevent
and seq#=w1.seq# ;
select spid into tid from v$process
where addr=(select paddr from v$session where sid=w2.blocking_session);
dbms_output.put_line('oradebug setospid '||tid);
dbms_output.put_line('oradebug unlimit');
dbms_output.put_line('oradebug dump errorstack 3');
dbms_output.put_line('oradebug event 10046 trace name context forever, level 8');
dbms_output.put_line('oradebug event 10200 trace name context forever, level 1');
dbms_output.put_line('oradebug event 10224 trace name context forever, level 1');
dbms_output.put_line('execute dbms_lock.sleep(20);');
dbms_output.put_line('oradebug event 10046 trace name context off');
dbms_output.put_line('oradebug event 10200 trace name context off');
dbms_output.put_line('oradebug event 10224 trace name context off');
dbms_output.put_line('exit');
exit;
exception
when no_data_found then null;
end;
end loop;
end;
/
exit


-- Result : 
SQL>  
oradebug setospid 6794
oradebug unlimit
oradebug dump errorstack 3
oradebug event 10046 trace name context forever, level 8
oradebug event 10200 trace name context forever, level 1
oradebug event 10224 trace name context forever, level 1
execute dbms_lock.sleep(20);
oradebug event 10046 trace name context off
oradebug event 10200 trace name context off
oradebug event 10224 trace name context off
exit

PL/SQL procedure successfully completed.

SQL> 

The next what we can do to trap any such wait events of interest when it exceeds the behnchmark, you can put eveything in a shell script and run it in the loop and execute the oradebug code. Once finished you can look it in the diagnostic_dest for the dump file. For 11g and above, look under subdirectory trace under home directory of ADR.

Next once you have put it in the shell script format, you can call it in the nohup mode and the script will run in background and sit in a loop for the defined condition to hit.

[oracle@oracleontario ~]$ more exec
#!/bin/bash
sqlplus -s '/ as sysdba' @waitdumpv1
[oracle@oracleontario ~]$
[oracle@oracleontario ~]$ chmod 777 exec
[oracle@oracleontario ~]$
[oracle@oracleontario ~]$

[oracle@oracleontario ~]$ nohup ./exec > waitdump2.log
nohup: ignoring input and redirecting stderr to stdout
[oracle@oracleontario ~]$

[oracle@oracleontario ~]$ more waitdump1.log
[oracle@oracleontario ~]$ nohup ./exec > waitdump2.log
nohup: ignoring input and redirecting stderr to stdout
[oracle@oracleontario ~]$ more waitdump2.log
oradebug setospid 6794
oradebug unlimit
oradebug hanganalyze 3
oradebug tracefile_name
exit

PL/SQL procedure successfully completed.

[oracle@oracleontario ~]$
[oracle@oracleontario ~]$

Hope It Helped!
Prashant Dixit

Posted in Uncategorized | Tagged: , , , , | Leave a Comment »

Some weirdness with V$DIAG_ALERT_EXT and magical support from Oracle Customer Support.

Posted by FatDBA on December 13, 2023

Hi All,

Recently, one of our custom monitoring scripts, which comprises more than 2000 lines of PL/SQL code covering all possible performance areas of the Oracle database, started behaving strangely on some 19c (19.15.0) databases. Usually, the report completes within 10-12 minutes on databases running version 12.2 and above, but it began taking approximately 30 minutes for a single run, with worst times exceeding 40 minutes. This issue seems to occur specifically on our 19c instances.

During analysis, we identified one of the underlying SQL queries in our script that queries V$DIAG_ALERT_EXT as the culprit, consuming most of the time and significantly exceeding average execution times. We utilize V$DIAG_ALERT_EXT to access the XML-formatted alert log from the Automatic Diagnostic Repository (ADR), particularly in cases where we can only access the database through integrated development environments (IDEs) like SQL Developer, and direct access to the databases is unavailable.

The SQL queries are straightforward, one of the simple one we used is focusing on capturing INCIDENT_ERROR and ERROR type codes. We have implemented filter conditions to select rows where the message_type is either 2 or 3 and where the originating_timestamp is within the last 8 hours (sysdate – 8/24 represents the current date and time minus 8 hours).

SELECT TO_CHAR(originating_timestamp,'DD/MM/YYYY HH24:MI:SS') AS time, message_text 

FROM v$diag_alert_ext
WHERE message_type IN (2, 3) AND originating_timestamp > sysdate - 8/24
ORDER BY RECORD_ID;

Initially, we were perplexed by the problem but were confident that it was specific to 21c databases, as all other versions where we had this script scheduled were working perfectly. After exhausting all optimization attempts and with no insights into what was happening with this specific dynamic view on this database version, we decided to engage Oracle support. They promptly confirmed that the issue was due to a known bug in Oracle 19c database – Bug 33513906, which is resolved in the 19.16.0.0.220719 (July 2022) Database Release Update (DB RU).

Oracle Database support stands out as one of the best I have worked with. They possess extensive knowledge about their products, provide comprehensive private and public documentation, and, in the presence of all diagnostic files, swiftly identify issues. Moreover, they offer both temporary and permanent fixes to problems.

Hope It Helped!
Prashant Dixit

Posted in Uncategorized | Tagged: , , , | Leave a Comment »

Why the Tablespace IO Stats are missing in my AWR report ?

Posted by FatDBA on October 22, 2023

Hi All,

In the past, I looked into a Database AWR performance report from a slow 19c where we suspected some IO issues and were looking into related metrics. “Tablespace IO Stats” was an important area and provided some important statistics like the average number of read requests per second, average read time in milliseconds, write waits, number of buffer waits, and average wait time in milliseconds for buffer waits for the tablespaces.

While looking into the report, I saw that the said section was not there and was missing for Tablespace IO stats. It appeared that the file IO statistics for Tablespaces had been disabled or were not collected. Below were the steps that you could do in such cases to get Tablespace IO stats data back in AWR reports in 19.X versions. Please run the following commands as SYS:

SQL> exec dbms_workload_repository.modify_table_settings(table_name => 'WRH$_FILESTATXS', flush_level => 'TYPICAL');
 
PL/SQL procedure successfully completed.
 
SQL> exec dbms_workload_repository.modify_table_settings(table_name => 'WRH$_DATAFILE', flush_level => 'TYPICAL');
 
PL/SQL procedure successfully completed.
 
SQL> exec dbms_workload_repository.modify_table_settings(table_name => 'Tempfile Group', flush_level => 'TYPICAL');
 
PL/SQL procedure successfully completed.
 
SQL> exec dbms_workload_repository.modify_table_settings(table_name => 'WRH$_TEMPFILE', flush_level => 'TYPICAL');
 
PL/SQL procedure successfully completed.
 
SQL> exec dbms_workload_repository.modify_table_settings(table_name => 'WRH$_TEMPSTATXS', flush_level => 'TYPICAL');
 
PL/SQL procedure successfully completed.
 
SQL>

When new AWR snapshots are generated, you will start getting Tablespace IO stats data for checking IO performance. You may have to run these commands in the PDBs also if you are generating AWR snapshots at PDB level and they are missing Tablespace IO stats data in AWR reports.

There is another way how you can force that data to the AWR, this is by using the new PL/SQL program called modify_table_settings() and that is recommended to be used to enable flushing of the tables WRH$_FILESTATXS, WRH$_DATAFILE and WRH$_TEMPSTATXS at TYPICAL or ALL depending on the flush_level of “Tempfile Group”.

Hope It Helped!
Prashant Dixit

Posted in Uncategorized | Tagged: , , , | Leave a Comment »

A story of Advance Queues mayhem … ORA-24002 ORA-04063

Posted by FatDBA on October 9, 2023

Hi Everyone,

Todays’ post was about an interesting scenario faced by my colleagues while they were doing an application upgrade and migration. Due to some reasons, the upgrade was supposed to be rolled back, and as a part of the strategy, they had to drop specific schemas touched by the failed upgrade and import a healthy backup taken just before the activity.

The steps were simple and were well discussed and vetted. While doing the import, they started getting errors which reported about the AQ (Oracle Advanced Queues). The error pointed out that the import job had failed to create the AQs with a ‘no data found’ message. Many of the AQs were not imported, and the queues were in an INVALID state.

21-SEPT-23 17:20:40.797: ORA-39083: Object type PROCDEPOBJ:"TESTDBSC"."DPF_OUT" failed to create with error:
ORA-01403: no data found
	
Failing sql is:
BEGIN
SYS.DBMS_AQ_IMP_INTERNAL.IMPORT_QUEUE(HEXTORAW('ASHQ18371NDDU1842NXXXXXXXXXXX'),
'AQTST_PTT_OUT','AQ$_AQTST_PTT_OUT_E',1,0,0,0,0,'exception queue');COMMIT; END;

We have even tried to drop the schema, but failed with errors reporting about missing advance queue tables. Tried to drop the the queue table and force all queues to be stopped and dropped by the system, but landed into all different errors.

SQL> drop user TESTDBSC cascade;
drop user TESTDBSC cascade
*
ERROR at line 1:
ORA-00604: error occurred at recursive SQL level 1
ORA-24002: QUEUE_TABLE TESTDBSC.AQTST_XXX does not exist
ORA-06512: at "SYS.DBMS_AQADM", line 707
ORA-06512: at "SYS.DBMS_AQADM_SYS", line 7735
ORA-06512: at "SYS.DBMS_SYS_ERROR", line 86
ORA-06512: at "SYS.DBMS_AQADM_SYS", line 7070
ORA-06512: at "SYS.DBMS_AQADM_SYS", line 7402
ORA-06512: at "SYS.DBMS_AQADM", line 702
ORA-06512: at line 1


begin dbms_aqadm.stop_queue (queue_name => 'AQ$_AQTST_PTT_IN_E', enqueue => TRUE, dequeue => FALSE); end;
*
ERROR at line 1:
ORA-04063: TESTDBSC.AQTST_XXX_IN has errors
ORA-06512: at "SYS.DBMS_AQADM", line 788
ORA-06512: at "SYS.DBMS_AQADM_SYS", line 8702
ORA-06512: at "SYS.DBMS_AQADM_SYSCALLS", line 926
ORA-06512: at "SYS.DBMS_AQADM_SYS", line 8687
ORA-06512: at "SYS.DBMS_AQADM", line 783
ORA-06512: at line 1

During the investigation, we found there were ~ 70 individual queue tables in the db that need to be cleared. There are no entries in DBA_QUEUE_TABLES so we can’t use the AQ api to force drop them. There were few child or orphan objects that still exist and need to be cleared. These child or dependent objects were – Views, Sequences, EVALUATION CONTEXT etc. apart from Queues and Tables.

OBJECT_ID	   OBJECT_NAME	                    OBJECT_TYPE
-----------    ------------------------------   --------------------------------------- 
124238	       AQ$_AQTST_FATDBA_UPD_V	        EVALUATION CONTEXT
124239	       AQ$_AQTST_FATDBA_UPD_N	        SEQUENCE
124259	       AQ$_AQTST_MONKEYINDC_UPD_N	    VIEW

As a breakthrough, we found all of the objects have the prefix AQTST, so it will be little easy to clean them.

SQL> select QUEUE_TABLE from dba_queue_tables where owner='TESTDBSC';

QUEUE_TABLE
------------------------------------------------------------
AQTST_XXXXXXXXXXXX_UPD
AQTST_XXXXXX_IN_UPD
AQTST_XXXXXXXXXXXX_UPD
AQTST_XXXXXX_IN_UPD
AQTST_XXXXXX_OUT_UPD

We first started dropping SEQUENCES, just to lower down number of elements followed by Views and Queue Tables. For Queue tables, we’ve set 10851 debugging event, this is to allow drop command to drop queue tables. This was kind of a last resort to drop queue table if all other options fail. This makes sense as we were manually cleaning AQ’s metadata after this operation.

select 'drop view "'||view_name||'";' as statements from user_views;

drop sequence AQ$_AQTST_XXXXXXXXXXXX_UPD_N;	
drop sequence AQ$_AQTST_XXXXXXXXXXXX_UPD_N;
drop sequence AQ$_AQTST_XXXX_XXXXX_IN_N;
.....
........

ALTER SESSION SET EVENTS '10851 trace name context forever, level 2';

-- Above command went fine, hence moved to the below step
-- Connected with the same schema that we tried to drop earlier and were failing 
select 'drop table "'||table_name|| ' cascade constraints";' as statements from user_tables;

Next, we need to manually start the cleanup.
Note: Take a valid backup before proceeding with the manual cleanup as it involves deleting from SYS objects.

We started the cleanup for remaining AQ objects related to %AQTST% from user # (TESTDBSC). First we deleted all object IDs of orphan objects from system tables i.e. SYSTEM.AQ$_QUEUES, SYS.OBJ$, SYSTEM.AQ$_QUEUE_TABLES etc.

Note: You can use Oracle’s provided AQ & MGW Health Check and Configuration Script (Doc ID 1193854.1) which will help you to quickly point out INVALID objects, object IDs and AQs consistency information.

SQL>  DELETE FROM SYSTEM.AQ$_QUEUES WHERE table_objno in (<object_id>,<object_id>,<object_id>,<object_id>,<object_id>);
1 rows deleted.

SQL>  DELETE FROM SYS.OBJ$ WHERE obj# IN (<object_id> ,<object_id>,<object_id>,<object_id>,
<object_id>,<object_id>,<object_id>,<object_id>);
34 rows deleted.

DELETE FROM SYSTEM.AQ$_QUEUE_TABLES where objno in (<object_id>,<object_id>,<object_id>,
<object_id>,<object_id>,<object_id><object_id>,<object_id>)
/

SQL> commit;
Commit complete.

Next we decided to drop the rule sets and rule evaluation contexts.

execute DBMS_RULE_ADM.DROP_EVALUATION_CONTEXT ('TESTDBSC.AQ$_AQTST_XXXXXXXXXXXX_UPD_V',TRUE)
execute DBMS_RULE_ADM.DROP_EVALUATION_CONTEXT ('TESTDBSC.AQ$_AQTST_XXXX_XXXX_V',TRUE)
..
....
execute DBMS_RULE_ADM.DROP_RULE_SET ('TESTDBSC.AWARD_XXX_XXXX_N',TRUE);
execute DBMS_RULE_ADM.DROP_RULE_SET ('TESTDBSC.AWARD_XXXX_XXXX_R',TRUE);
...
....

Now we have all of the queues named %AQTST% properly cleaned from the impacted schema. Just as a precautionary measure, we flushed our shared pool. We tried to drop the user after manual cleanup and were able to drop the schema which was earlier throwing AQ related errors.

So, in short this all happened because there was a AQ metadata mismatch which lead to failed import as it contained queues and we had to manually cleanup the advance queue’s metadata.

Hope It Helped!
Prashant Dixit

Posted in Uncategorized | Tagged: , , | Leave a Comment »

Exploring new shiny Oracle 23 Developer Free Release …

Posted by FatDBA on April 8, 2023

Hi All,

Oracle on April 3, 2023 announced a free version of Oracle Database 23c (Release 23.0.0.0.0 – Developer-Release). Oracle Database 23c Free—Developer Release is available for download as a Docker Image, VirtualBox VM, or Linux RPM installation file, without requiring a user account or login.

Oracle 23c has a long list of new features, example Boolean datatype, No select from DUAL table just select it from the expression, lock free DMLs, joins in UPDATE & DELETE statements, 4096 columns in a table. Some of the development related additions i.e. drop table if exists, create table if not exists, Java script in the database (MLE), Multiple rows in a single insert command, store data as JSON and as relational both etc.

This long weekend gave me an opportunity to test the new Oracle 23c Developer release. This post is to explain the easy installation of the database on Oracle Linux 8 using RPM. You have to download Oracle 23c preinstall and core/main RPM file. Get it from the download link https://www.oracle.com/database/technologies/free-downloads.html

[root@mississauga files]#
[root@mississauga files]# ls
oracle-database-free-23c-1.0-1.el8.x86_64.rpm  oracle-database-preinstall-23c-1.0-0.5.el8.x86_64.rpm
[root@mississauga files]# yum install oracle-database-preinstall-23c-1.0-0.5.el8.x86_64.rpm
Last metadata expiration check: 0:03:51 ago on Sat 08 Apr 2023 01:17:02 PM EDT.
Dependencies resolved.
=============================================================================================================================================================
 Package                                          Architecture             Version                                 Repository                           Size
=============================================================================================================================================================
Installing:
 oracle-database-preinstall-23c                   x86_64                   1.0-0.5.el8                             @commandline                         30 k
Installing dependencies:
 compat-openssl10                                 x86_64                   1:1.0.2o-4.el8_6                        ol8_appstream                       1.1 M
 ksh                                              x86_64                   20120801-257.0.1.el8                    ol8_appstream                       929 k
 libnsl                                           x86_64                   2.28-211.0.1.el8                        ol8_baseos_latest                   105 k

Transaction Summary
=============================================================================================================================================================
Install  4 Packages

Total size: 2.2 M
Total download size: 2.1 M
Installed size: 6.3 M
Is this ok [y/N]: y
Downloading Packages:
(1/3): libnsl-2.28-211.0.1.el8.x86_64.rpm                                                                                    548 kB/s | 105 kB     00:00
(2/3): compat-openssl10-1.0.2o-4.el8_6.x86_64.rpm                                                                            4.5 MB/s | 1.1 MB     00:00
(3/3): ksh-20120801-257.0.1.el8.x86_64.rpm                                                                                   3.5 MB/s | 929 kB     00:00
-------------------------------------------------------------------------------------------------------------------------------------------------------------
Total                                                                                                                        7.9 MB/s | 2.1 MB     00:00
Oracle Linux 8 BaseOS Latest (x86_64)                                                                                        3.0 MB/s | 3.1 kB     00:00
Importing GPG key 0xAD986DA3:
 Userid     : "Oracle OSS group (Open Source Software group) <build@oss.oracle.com>"
 Fingerprint: 76FD 3DB1 3AB6 7410 B89D B10E 8256 2EA9 AD98 6DA3
 From       : /etc/pki/rpm-gpg/RPM-GPG-KEY-oracle
Is this ok [y/N]: y
Key imported successfully
Running transaction check
Transaction check succeeded.
Running transaction test
Transaction test succeeded.
Running transaction
  Preparing        :                                                                                                                                     1/1
  Installing       : ksh-20120801-257.0.1.el8.x86_64                                                                                                     1/4
  Running scriptlet: ksh-20120801-257.0.1.el8.x86_64                                                                                                     1/4
  Installing       : compat-openssl10-1:1.0.2o-4.el8_6.x86_64                                                                                            2/4
  Running scriptlet: compat-openssl10-1:1.0.2o-4.el8_6.x86_64                                                                                            2/4
  Installing       : libnsl-2.28-211.0.1.el8.x86_64                                                                                                      3/4
  Installing       : oracle-database-preinstall-23c-1.0-0.5.el8.x86_64                                                                                   4/4
  Running scriptlet: oracle-database-preinstall-23c-1.0-0.5.el8.x86_64                                                                                   4/4
  Verifying        : libnsl-2.28-211.0.1.el8.x86_64                                                                                                      1/4
  Verifying        : compat-openssl10-1:1.0.2o-4.el8_6.x86_64                                                                                            2/4
  Verifying        : ksh-20120801-257.0.1.el8.x86_64                                                                                                     3/4
  Verifying        : oracle-database-preinstall-23c-1.0-0.5.el8.x86_64                                                                                   4/4

Installed:
  compat-openssl10-1:1.0.2o-4.el8_6.x86_64 ksh-20120801-257.0.1.el8.x86_64 libnsl-2.28-211.0.1.el8.x86_64 oracle-database-preinstall-23c-1.0-0.5.el8.x86_64

Complete!


[root@mississauga files]#
[root@mississauga files]# dnf -y localinstall /root/Desktop/files/oracle-database-free-23c-1.0-1.el8.x86_64.rpm
Last metadata expiration check: 0:05:23 ago on Sat 08 Apr 2023 01:17:02 PM EDT.
Dependencies resolved.
=============================================================================================================================================================
 Package                                          Architecture                   Version                          Repository                            Size
=============================================================================================================================================================
Installing:
 oracle-database-free-23c                         x86_64                         1.0-1                            @commandline                         1.6 G

Transaction Summary
=============================================================================================================================================================
Install  1 Package

Total size: 1.6 G
Installed size: 5.2 G
Downloading Packages:
Running transaction check
Transaction check succeeded.
Running transaction test
Transaction test succeeded.
Running transaction
  Preparing        :                                                                                                                                     1/1
  Running scriptlet: oracle-database-free-23c-1.0-1.x86_64                                                                                               1/1
  Installing       : oracle-database-free-23c-1.0-1.x86_64                                                                                               1/1
  Running scriptlet: oracle-database-free-23c-1.0-1.x86_64                                                                                               1/1
[INFO] Executing post installation scripts...
[INFO] Oracle home installed successfully and ready to be configured.
To configure Oracle Database Free, optionally modify the parameters in '/etc/sysconfig/oracle-free-23c.conf' and then run '/etc/init.d/oracle-free-23c configure' as root.

  Verifying        : oracle-database-free-23c-1.0-1.x86_64                                                                                               1/1

Installed:
  oracle-database-free-23c-1.0-1.x86_64

Complete!
[root@mississauga files]#
[root@mississauga files]#


[root@mississauga ~]# cd /etc/init.d
[root@mississauga init.d]# ls
functions  oracle-database-preinstall-23c-firstboot  oracle-free-23c  README
[root@mississauga init.d]# /etc/init.d/oracle-free-23c configure
Specify a password to be used for database accounts. Oracle recommends that the password entered should be at least 8 characters in length, contain at least 1 uppercase character, 1 lower case character and 1 digit [0-9]. Note that the same password will be used for SYS, SYSTEM and PDBADMIN accounts:
Confirm the password:
Configuring Oracle Listener.

        Listener configuration succeeded.
Configuring Oracle Database FREE.
Enter SYS user password:                                                                                                                                    **********
Enter SYSTEM user password:
*******
Enter PDBADMIN User Password:
***********
Prepare for db operation
7% complete
Copying database files
29% complete
Creating and starting Oracle instance
30% complete
33% complete
36% complete
39% complete
43% complete
Completing Database Creation
47% complete
49% complete
50% complete
Creating Pluggable Databases
54% complete
71% complete
Executing Post Configuration Actions
93% complete
Running Custom Scripts
100% complete
Database creation complete. For details check the logfiles at:
 /opt/oracle/cfgtoollogs/dbca/FREE.
Database Information:
Global Database Name:FREE
System Identifier(SID):FREE
Look at the log file "/opt/oracle/cfgtoollogs/dbca/FREE/FREE.log" for further details.

Connect to Oracle Database using one of the connect strings:
     Pluggable database: mississauga.candomain/FREEPDB1
     Multitenant container database: mississauga.candomain

[oracle@mississauga ~]$ sqlplus / as sysdba
SQL*Plus: Release 23.0.0.0.0 - Developer-Release on Sat Apr 8 13:57:09 2023
Version 23.2.0.0.0
Copyright (c) 1982, 2023, Oracle.  All rights reserved.
Connected to:
Oracle Database 23c Free, Release 23.0.0.0.0 - Developer-Release
Version 23.2.0.0.0

SQL>

Done with the installation. Though there are multiple additions into Oracle 23c database, I would like to start with a quick one, insert multiple rows in a single INSERT command. If you use DBMSs such as MySQL or SQL Server, the syntax for inserting multiple rows into a table with a single statement is quite straightforward. Its now available in Oracle databases! 🙂

[oracle@mississauga ~]$ sqlplus / as sysdba
SQL*Plus: Release 23.0.0.0.0 - Developer-Release on Sat Apr 8 13:57:09 2023
Version 23.2.0.0.0
Copyright (c) 1982, 2023, Oracle.  All rights reserved.
Connected to:
Oracle Database 23c Free, Release 23.0.0.0.0 - Developer-Release
Version 23.2.0.0.0

SQL> select name, open_mode from v$database;

NAME      OPEN_MODE
--------- --------------------
FREE      READ WRITE

SQL> 
SQL> create table albumdetails (album_code number(10), albumrack_number number(10), albumreleaseyear number(20), albumtype varchar2(70));

Table created.

SQL>
SQL> insert into albumdetails (album_code, albumrack_number, albumreleaseyear, albumtype) values
('100','20','1999','Vinyl'),
('101','18','2008','cassattee'),
('102','01','1992','Vinyl'),
('103','05','1988','LPRecord'),
('104','05','2018','Vinyl');  

5 rows created.

Next I will be posting each of the new features and experiments that I will be doing on 23c.

Hope It Helped!
Prashant Dixit

Posted in Uncategorized | Tagged: , , | Leave a Comment »

What is Cluster Health Advisor GUI or CHAG ?

Posted by FatDBA on January 4, 2023

CHA GUI (CHAG) is a graphical user interface for Cluster Health Advisor (CHA) which was earlier internal to Oracle teams but its now available to the customers. It is a standalone, interactive, real-time capable front-end/GUI to the classic CHA utility. Oracle 12.2 is the first version that is supported by CHA GUI (CHAG). You only require RAC license and there is no need for any additional license to use CHAG tool.

CHAG communicates directly with the Grid Infrastructure Management Repository (GIMR) using a JDBC connection.. GIMR is mandatory for CHAG to work as it fetches the data out of the GIMR repository. In case you don’t have the GIMR repo installed, for example on 19c databases as GIMR is optional there, you can use the local mode for CHAG to work, but in absence of GIMR mgmt repo you will not get the historical abilities to go back in time.

Installation is quite simple, you have to download and unzip the software on one of your cluster machines and I recommend not to dump it inside your ORACLE HOME, but in a separate place. CHAG requires X11 or XHost and Java as it uses Java Swing to open the GUI. CHAG can operate in several modes:

  • With a default connection to GIMR Database. This option initiate a live session and provide real-time monitoring.
  • With a user specified location of a GIMR Database (option -P). This option initiate a live session and provide real-time monitoring.
  • Read in a text file with monitoring data (option -f). This initiates a passive session, which allow to analyze textual data extracted from a GIMR, or data collected during a live session. This data is held in a “*.mdb” file.
  • Parse text file with data and generate JSON object with information similar to query “diagnosis” (option -C). This mode of operation ‘chag -C -f ‘ directs CHAG to parse a *.mdb file and to generate a summary of its content in JSON format.

For the offline mode you can get the “mdb” file to analyze using below command. Depending on the time model you will get n number of mdb files for the period.

chactl export repository -format mdb -start <timestamp> -end <timestamp>

About the usage, CHAG is invoked using the ‘chag’ script available in the bin directory of the CHA Home. CHAG is designed primarily for Cluster or Database experts. Usage is quite simple and straight forward, you can move the pointer/slider to choose any particular timeframe to catch problems, their cause and the corrective actions. You can use it both in real time and offline version, its just that for real time you have to be on any of the cluster node, for offline you can generate the MDB file (cha datafile) and can run it anywhere on the client machine with no need of oracle home and only Java will be needed.

Below is the CHAG look and feel, its running on a 2 node RAC cluster where we have two databases installed. Here you see few color codes, where red colors means there were few problems during that interval.

Next is how it explains more about any particular problem caught for the timeslot. Gives you cause and the corrective action, for example in below screenshot it has detected that the ASM IO service time is higher than the expected which points to the underlying IO Subsystem used by ASM disks.

You can use SHIFT keys combinations to get wait event specific details for the selected time period.

You can use few other SHIFT key combinations to present the same data in the form of line graphs.

Few more examples or problems detected by the CHAG. This time it was reporting for redo log writes which are slower and that is something expected as ASM IO is slow too means the entire IO subsystem is impacted.

I highly recommend all readers to go through Doc ID 2340062.1 on metalink for more details on Cluster Health Advisor Graphical User Interface – CHAG.

Hope It Helped!
Prashant Dixit

Posted in Advanced, troubleshooting | Tagged: , , , | Leave a Comment »

No Hint, No Degree, No Auto-DOP, Why my query is going for the parallelism ?

Posted by FatDBA on December 16, 2022

Recently I was working on a performance problem where customer reported few of their SQL statements going for parallelism even when they are not forcing DOP via any HINT, and all of the referenced table and underlying Indexes were with degree=1

I was asked to take a look, and I immediately checked if Auto DOP was the reason forcing unwanted parallelism, but parallel_degree_policy was set to MANUAL which means the auto DOP, statement queuing and in-memory parallel execution all were disabled.

SQL> show parameter parallel_degree_policy

NAME                                 TYPE        VALUE
------------------------------------ ----------- ------------------------------
parallel_degree_policy               string      MANUAL

Next, I thought to verify Table and Indexes general stats or details and I queried DBA_TABLES & DBA_INDEXES for Instances column, and found one of the table was set to value ‘DEFAULT’. If we have a value of DEFAULT set for INSTANCES, it will always force the query use DEFAULT degree of parallelism.

Let me explain the impact of having DEFAULT value for Instances, and how it forces SQL to spawn parallelism. For demo purpose, I am going to create a test table and an index with INSTANCES value set to DEFAULT.

[oracle@oracleontario ~]$ sqlplus / as sysdba

SQL*Plus: Release 19.0.0.0.0 - Production on Mon Dec 19 08:23:12 2022
Version 19.15.0.0.0

Copyright (c) 1982, 2022, Oracle.  All rights reserved.


SQL> create table fatdba_table as select * from dba_objects;

Table created.

SQL>
SQL> select count(*) from fatdba_table;

  COUNT(*)
----------
     74932

SQL>

SQL> create index fatdba_table_idx on fatdba_table(OBJECT_TYPE,object_name) parallel(DEGREE 1 INSTANCES DEFAULT);

Index created.

SQL>
SQL> select index_name,degree,instances from dba_indexes where index_name='FATDBA_TABLE_IDX';

INDEX_NAME                     DEGREE                                   INSTANCES
------------------------------ ---------------------------------------- ----------------------------------------
FATDBA_TABLE_IDX               1                                        DEFAULT

SQL>

Alright the stage is set, lets run a SQL statement and force it to use that Index and see its impact on the execution.

SQL> explain plan for select /*+ index_ffs(fatdba_table,fatdba_table_idx) */ count(distinct object_name) from fatdba_table 
where OBJECT_TYPE='TABLE';

Explained.

SQL> set linesize 400 pagesize 400
SQL> select * from table(dbms_xplan.display) ;

PLAN_TABLE_OUTPUT
--------------------------------------------------------------------------------------------------------------------------------
Plan hash value: 1154043599

-------------------------------------------------------------------------------------------------------------------------------
| Id  | Operation                     | Name             | Rows  | Bytes | Cost (%CPU)| Time     |    TQ  |IN-OUT| PQ Distrib |
-------------------------------------------------------------------------------------------------------------------------------
|   0 | SELECT STATEMENT              |                  |     1 |    66 |   157   (1)| 00:00:01 |        |      |            |
|   1 |  SORT AGGREGATE               |                  |     1 |    66 |            |          |        |      |            |
|   2 |   PX COORDINATOR              |                  |       |       |            |          |        |      |            |
|   3 |    PX SEND QC (RANDOM)        | :TQ10001         |     1 |    66 |            |          |  Q1,01 | P->S | QC (RAND)  |
|   4 |     SORT AGGREGATE            |                  |     1 |    66 |            |          |  Q1,01 | PCWP |            |
|   5 |      VIEW                     | VW_DAG_0         |  1558 |   100K|   157   (1)| 00:00:01 |  Q1,01 | PCWP |            |
|   6 |       HASH GROUP BY           |                  |  1558 | 68552 |   157   (1)| 00:00:01 |  Q1,01 | PCWP |            |
|   7 |        PX RECEIVE             |                  |  1561 | 68684 |   156   (0)| 00:00:01 |  Q1,01 | PCWP |            |
|   8 |         PX SEND HASH          | :TQ10000         |  1561 | 68684 |   156   (0)| 00:00:01 |  Q1,00 | P->P | HASH       |
|   9 |          PX BLOCK ITERATOR    |                  |  1561 | 68684 |   156   (0)| 00:00:01 |  Q1,00 | PCWC |            |
|* 10 |           INDEX FAST FULL SCAN| FATDBA_TABLE_IDX |  1561 | 68684 |   156   (0)| 00:00:01 |  Q1,00 | PCWP |            |
-------------------------------------------------------------------------------------------------------------------------------

Predicate Information (identified by operation id):
---------------------------------------------------

  10 - filter("OBJECT_TYPE"='TABLE')

22 rows selected.

SQL>

As expected, it forced SQL to go with parallelism. Let me set INSTANCE value of the Index to 1 and see what happens next.

SQL> alter index FATDBA_TABLE_IDX noparallel;

Index altered.

SQL> select index_name,degree,instances from dba_indexes where index_name='FATDBA_TABLE_IDX';


INDEX_NAME                     DEGREE                                   INSTANCES
------------------------------ ---------------------------------------- ----------------------------------------
FATDBA_TABLE_IDX               1                                        1

SQL> SQL>


SQL> select index_name,degree,instances from dba_indexes where index_name='FATDBA_TABLE_IDX';


INDEX_NAME                     DEGREE                                   INSTANCES
------------------------------ ---------------------------------------- ----------------------------------------
FATDBA_TABLE_IDX               1                                        1

SQL> SQL> explain plan for select /*+ index_ffs(fatdba_table,fatdba_table_idx) */ count(distinct object_name) 
from fatdba_table where OBJECT_TYPE='TABLE';

Explained.

SQL> select * from table(dbms_xplan.display) ;

PLAN_TABLE_OUTPUT
------------------------------------------------------------------------------------------------------
Plan hash value: 3184007477

--------------------------------------------------------------------------------------------
| Id  | Operation               | Name             | Rows  | Bytes | Cost (%CPU)| Time     |
--------------------------------------------------------------------------------------------
|   0 | SELECT STATEMENT        |                  |     1 |    66 |   157   (1)| 00:00:01 |
|   1 |  SORT AGGREGATE         |                  |     1 |    66 |            |          |
|   2 |   VIEW                  | VW_DAG_0         |  1558 |   100K|   157   (1)| 00:00:01 |
|   3 |    HASH GROUP BY        |                  |  1558 | 68552 |   157   (1)| 00:00:01 |
|*  4 |     INDEX FAST FULL SCAN| FATDBA_TABLE_IDX |  1561 | 68684 |   156   (0)| 00:00:01 |
--------------------------------------------------------------------------------------------

Predicate Information (identified by operation id):
---------------------------------------------------

   4 - filter("OBJECT_TYPE"='TABLE')

16 rows selected.

And no parallelism was used after set the value of INSTANCES to 1.

Hope It Helped!
Prashant Dixit

Posted in Advanced, troubleshooting | Tagged: , , , | Leave a Comment »

Why I am not able to locate 21c for my Always Free Autonomous Databases ?

Posted by FatDBA on December 4, 2022

Recently one of my friend who started learning OCI told me he is not able to locate Oracle 21c Autonomous database in the list, but can only see 19c. He was using ‘Always Free Autonomous Databases’ to test few things on Oracle Database version 21c.

I was sure it was happening due to region he selected, I mean you can provision free Autonomous Databases only in your home region, and not all regions support the same database versions. The supported version may be 19c-only or 21c-only, depending on the region you have selected.

When checked, found he was trying from the ap-tokyo-1 (Tokyo region – key NRT) where only 19c version is available in ‘Always Free Autonomous Databases’. So, it always depends the region where you are trying creating your Always Free Autonomous Database Oracle Database weather you see 19c or 21c.

Always Free databases can be created in Oracle Cloud Infrastructure accounts that are in a trial period, have paying status, or are always free. More details : https://docs.oracle.com/en-us/iaas/Content/Database/Concepts/adbfreeoverview.htm

Try and sign up for Oracle Cloud Free Tier, trust me its awesome 🙂 🙂 : https://www.oracle.com/cloud/free/

Hope It Helped
Prashant Dixit

Posted in Basics | Tagged: , , | Leave a Comment »

Some of the new exotic wait events in Oracle 21c …

Posted by FatDBA on November 12, 2022

Hi Guys,


Lately I was doing tests on Oracle 21c and came across few of the exotic new wait events added to Oracle 21c. I was using 21.3.0.0.0 and have noticed few new Exadata, ASM, Dataguard, AI/ML, Exascale, Cluster, exa persistent memory, CTWR etc. specific waits were added to the database. I have also noticed some strange looking waits as well i.e. ‘Spare1′,’Spare2′,’Spare3’ ….

Being an innovation release, and since this is a beta version, there is no document available or published for the customer for any of these new waits on Metalink

Couple of new ‘Bloom Filter‘ related waits added to 21c
Bloom Filter EOF
Bloom Filter Fetch

Bunch of new Exadata ‘smart Index|Table scan’ related, User I/O classed wait events added to 21c are
cell smart index scan request
cell smart index scan: db timezone upgrade
cell smart index scan: disabled by user
cell smart index scan: pass through
cell smart table scan request
cell smart table scan: db timezone upgrade
cell smart table scan: disabled by user
cell smart table scan: pass through
cell worker online completion
cell worker retry

Few of the new machine learning & Artificial Intellegence related wait events added in 21c are
enq: AI - Seek operation
enq: AI - dequeue operation
enq: AI - lwm update operation
enq: AI - remove subscriber
enq: AI - start cross operation
enq: AI - stop cross operation
enq: AI - truncate operation

Some of the new RAC (cluster class), global cache (cache fusion) block related waits added to 21c are
gc cr block direct read
gc current block direct read

Some of the new EDSLib/EBSLib latch waits, which are used to gum the code between RDBMS and Exascale storage added in 21c are given below.
latch: EDSLib File
latch: EDSLib Message
latch: EDSLib Root
latch: EGSLib Root
latch: EGSLibDS Root
latch: EGSLibDataStore Object
latch: EGSLibDataStoreShard Object
latch: EGSLibForum Object
latch: EGSLibNet Root
latch: EGSLibSP Root
latch: EGSLibStoragePool Object
latch: EGSLibStoragePoolRing Object
latch: FOB s.o list parent latch

This is by far the most interesting one, with no name and they seem some sort of free or extra wait events names. I am familiar with few of the other ‘spare’ i.e. “enq: BS – krb spare”, “enq: SP..xx”, “enq: SX.xx.xxx“, but these are different
spare 10
spare 2
spare 3
spare 4
spare 5
spare 6
spare 7
spare 8
spare 9

Couple of new ASM related wait events were added too
enq: AM - ASM Scrubbing
enq: AM - ASM used quota calculation

Some of the new enqueue waits on Change Tracking file are
enq: CT - CTWR DBA buffer resize
enq: CT - CTWR datafile sync
enq: CT - CTWR thread checkpoint

Some of the new enqueue related waits on Exadata Persistent Memory (PMEM)
enq: FF - PMEMfs - ODM
enq: FF - PMEMfs - Param
enq: FF - PMEMfs - Resize
enq: FF - PMEMfs - aXtnd pool
enq: FF - PMEMfs - reSze pool

Hope It Helped!
Prashant Dixit

Posted in Uncategorized | Tagged: , , , | Leave a Comment »

Kafka Java Client for Transactional Event Queues (TEQ), Another great feature added to Oracle 21c …

Posted by FatDBA on November 6, 2022

Hi Guys,

Recently I was testing some advance queuing functions to setup an asynchronous communication (using event queues) between few applications and users on Oracle 21c database, to build a messaging platform. I was looking for a way to connect my client side libraries to allow Kafka APIs to connect to Oracle DB.

I had no clue how to do this integration, and then I came across this official documentation which talks about a new functionality in Oracle Database Version 21c – Kafka Java Client for Transactional Event Queues (TEQ) that enables Kafka application compatibility with Oracle Database. This provides easy migration of Kafka applications to TEQ.

Oracle Transactional Event Queue (TEQ) makes it easy to implement event-based applications. It is also highly integrated with Apache Kafka. Apart from enabling apps that use Kafka APIs to transparently operate on Oracle TEQ, Oracle TEQ also supports bi-directional information flow between TEQ and Kafka, so that changes are available in TEQ or Kafka as soon as possible in near-real-time.

Apache Kafka Connect is a framework included in Apache Kafka that integrates Kafka with other systems. Oracle TEQ will provide standard JMS package and related JDBC, Transaction packages to establish the connection and complete the transactional data flow. Oracle TEQ configures standard Kafka JMS connectors to establish interoperability and complete the data flow between the two messaging systems.

Another great blog post on the topic : https://docs.oracle.com/en/database/oracle/oracle-database/21/adque/Kafka_cient_interface_TEQ.html#GUID-94589C97-F323-4607-8C3A-10A0EDF9DA0D

Hope It Helps!
Prashant Dixit

Posted in Uncategorized | Tagged: , , , | Leave a Comment »