Tales From A Lazy Fat DBA

Its all about Databases, their performance, troubleshooting & much more …. ¯\_(ツ)_/¯

Posts Tagged ‘migration’

Database Migration Challenges : JServer JAVA Virtual Machine gets INVALID or UPGRADING during manual upgrade

Posted by FatDBA on December 14, 2024

Migrations can be a horrifying experience —tricky, complex, time-intensive, and often riddled with unexpected challenges. This becomes even more evident when you’re migrating between older database versions, where architectural and component-level changes are significant. I remember one such encounter during a migration from Oracle 11g to 19c on a new infrastructure. Using RMAN DUPLICATE with the NOOPEN clause to restore source database backup in target before calling manual upgrade procedures, the process seemed smooth initially but soon wrapped into a host of issues with key database components.

The Problem

During the upgrade process, several critical components failed, leaving the database in an inconsistent state. The errors revolved around the following components:

COMP_IDCOMP_NAMEVERSIONSTATUS
JAVAVMJServer JAVA Virtual Machine11.2.0.4.0UPGRADING
XMLOracle XDK19.0.0.0.0INVALID
CATJAVAOracle Database Java Packages19.0.0.0.0INVALID

The errors observed in dbupgrade runtime logs included:

ORA-29554: unhandled Java out of memory condition
ORA-06512: at "SYS.INITJVMAUX", line 230
ORA-06512: at line 5

ORA-06512: : at "SYS.INITJVMAUX", line 230 ORA-06512: at line 5
[ORA-29548: Java system class reported: release of Java system classes in the database (11.2.0.4.190115) does not match that of the oracle executable (19.0.0.0.0 1.8)

These errors stemmed from a failure to allocate sufficient memory during the upgrade process. The Java Virtual Machine (JVM) ran out of memory, causing cascading errors that invalidated other components like Oracle XDK and Java Database Packages (CATJAVA). This wasn’t a mere inconvenience—it meant that critical database functionality was broken, making the system unusable for applications relying on these components.

Root Cause

Upon investigation, we found that the issue was caused by using a temporary RMAN parameter file during the restore process. This parameter file contained a minimal set of initialization parameters, which were insufficient to handle the resource-intensive operations required during the upgrade, particularly for recompiling and validating Java components.

Key memory areas like the SGA, shared pool, large pool, and Java pool were inadequately configured. These areas play a crucial role during the execution of upgrade scripts such as dbupgrade, catctl.pl, or catupgrd.sql. Without sufficient memory, the upgrade process for these components failed midway, leaving them in an invalid state.

The Fix

To resolve these issues and ensure the migration proceeded smoothly, the following steps were taken:

Step 1: Adjust Initialization Parameters

The first step was to allocate adequate memory for the Java components to prevent out-of-memory conditions. Critical parameters like the Java pool and other memory pools were adjusted to handle the load during the upgrade process:

ALTER SYSTEM SET java_jit_enabled = TRUE;
ALTER SYSTEM SET "_system_trig_enabled" = TRUE;
ALTER SYSTEM SET java_pool_size = 180M; -- Ensure at least 150 MB is allocated

Step 2: Recreate the Java Component

The next step was to drop and recreate the Java component in the database. This ensured that any inconsistencies caused by the previous upgrade failure were cleaned up:

CREATE OR REPLACE JAVA SYSTEM;

Step 3: Restart the Upgrade Scripts

After fixing the memory settings and recreating the Java component, the upgrade process was restarted using Oracle’s upgrade utilities:

  • dbupgrade: The recommended tool for 19c migrations.
  • catctl.pl: For manual control over the upgrade process.
  • catupgrd.sql: A fallback script for older methods.

Logs such as upg_summary.log were closely monitored during the process to catch any errors or exceptions in real-time.

Step 4: Verify the Upgrade

Once the upgrade process was completed, the status of all components was verified using the DBA_REGISTRY and DBA_REGISTRY_HISTORY views:

SELECT SUBSTR(comp_name, 1, 30) comp_name, 
SUBSTR(version, 1, 20) version,
status
FROM dba_registry
ORDER BY comp_name;

Expected output:

COMP_NAME                      VERSION              STATUS
------------------------------ -------------------- ---------------
JServer JAVA Virtual Machine 19.0.0.0.0 UPGRADED

Key Takeaways

This experience highlighted several crucial lessons when handling database migrations, especially for major version upgrades like 11g to 19c:

1. Adequate Initialization Parameters Are Essential

The memory-related initialization parameters (java_pool_size, shared_pool_size, etc.) must be configured appropriately before starting the upgrade process. Using a minimal parameter file during RMAN DUPLICATE can lead to critical issues if not adjusted later.

2. Resource-Intensive Components Need Extra Attention

Components like JAVAVM, Oracle XDK, and CATJAVA are highly resource-intensive. Even slight memory misconfigurations can lead to cascading failures that disrupt the entire migration process.

3. Monitor Upgrade Logs Closely

Keeping an eye on upgrade runtime logs and the summary logs (upg_summary.log) is vital for catching errors early. This allows you to address issues promptly before they snowball into larger problems.

4. Understand Dependencies

Database components often have interdependencies. For instance, a failure in the Java Virtual Machine component affected both the Oracle XDK and CATJAVA packages. Understanding these dependencies is key to resolving issues effectively.

Conclusion

Database migrations are inherently challenging, especially when dealing with major version jumps. This particular experience from migrating Oracle 11g to 19c served as a valuable reminder of the importance of preparation, thorough testing, and paying close attention to resource configurations. With the right approach, even complex migrations can be navigated successfully, ensuring the database is ready for modern workloads and enhanced performance.

By addressing these pitfalls and being proactive, you can ensure a smoother upgrade process and avoid unnecessary downtime or functionality issues.

Let me know if this approach resonates with your migration experiences!

Hope It Helped!
Prashant Dixit

Posted in Uncategorized | Tagged: , , , , , , | Leave a Comment »

Data Pump Troubleshooting Tips – My favorite 6

Posted by FatDBA on October 26, 2024

There are numerous utilities, options, and methods available for migrating and moving data between Oracle databases, yet Oracle Data Pump remains one of the most widely used tools. A significant number of DBAs are very comfortable with Data Pump, as it has been a trusted utility for a long time (originally as exp and imp). Its stability, user-friendliness, and robust capabilities make it a top choice for handling large data migrations, backup, and restore operations.

However, one area where DBAs still often face challenges is troubleshooting when issues arise. When a Data Pump job fails, performs poorly, or behaves unexpectedly, it can be unclear where to start, what logs to review, or what checks to perform. Many find it difficult to pinpoint the source of the problem and make adjustments to optimize performance or resolve issues.

Today’s post focuses on troubleshooting Data Pump performance and functionality issues, sharing the steps I typically follow when diagnosing problems. We’ll cover key areas to investigate, like log file analysis, parameter tuning, network considerations, and common bottlenecks. These steps aim to provide a practical guide to understanding and resolving Data Pump issues and optimizing your data movement processes.

Option 1: Generate an AWR Report to Assess Database Performance

Start by generating an AWR (Automatic Workload Repository) report to gain insight into the database’s overall performance during the relevant period. Adjusting the AWR snapshot interval to 15 minutes is recommended for a more granular view. This approach reduces the chances of averaging out short performance spikes, allowing you to capture transient issues more effectively.

exec dbms_workload_repository.modify_snapshot_settings(null, 15);
exec dbms_workload_repository.create_snapshot;

Option 2: Enable SQL Trace for Data Pump Processes or Specific SQL IDs
Optionally, you can enable SQL trace for the Data Pump processes (dm for the master process and dw for worker processes) or for specific SQL statements by SQL ID. This will help isolate SQL-level performance issues affecting the Data Pump job.

alter system set events 'sql_trace {process: pname = dw | process: pname = dm} level=8';
alter system set events 'sql_trace[SQL: 8krc88r46raff]';

Option 3: Run Data Pump Job with Detailed Trace Enabled
For enhanced tracing, run the Data Pump job with additional trace options, which provide more comprehensive output. Including metrics=yes, logtime=all, and trace=1FF0300 in the command enables detailed logging of both timing and activity metrics. Tracing can be enabled by specifying an 7 digit hexadecimal mask in the TRACE parameter of Export DataPump (expdp) or Import DataPump (impdp). The first three digits enable tracing for a specific Data Pump component, while the last four digits are usually: 0300.

expdp ... metrics=yes logtime=all trace=1FF0300
impdp ... metrics=yes logtime=all trace=1FF0300

Data Pump tracing can also be started with a line with EVENT 39089 in the initialization parameter file. This method should only be used to trace the Data Pump calls in an early state, e.g. if details are needed about the DBMS_DATAPUMP.OPEN API call. Trace level 0x300 will trace all Data Pump client processes.

-- Enable event
ALTER SYSTEM SET EVENTS = '39089 trace name context forever, level 0x300' ;
-- Disable event
ALTER SYSTEM SET EVENTS = '39089 trace name context off' ;

Option 4: Review Data Pump Trace Files
Locate and analyze the Data Pump trace files stored in the Oracle trace directory. The master control process file names typically contain *dm*, while worker process files include *dw*. These files provide insights into the processes, job details, and potential error sources during execution.

Option 5: Activate SQL_TRACE on specific Data Pump process with higher trace level.
Lets assume we see that the Data Pump Master process (DM00) has SID: 143 and serial#: 50 and the Data Pump Worker process (DW01) has SID: 150 and serial#: 17. These details can be used to activate SQL tracing in SQL*Plus with DBMS_SYSTEM.SET_EV, e.g.:

-- In SQL*Plus, activate SQL tracing with DBMS_SYSTEM and SID/SERIAL#  
-- Syntax: DBMS_SYSTEM.SET_EV([SID],[SERIAL#],[EVENT],[LEVEL],'') 

-- Example to SQL_TRACE Worker process with level 4 (Bind values):   
execute sys.dbms_system.set_ev(150,17,10046,4,''); 

-- and stop tracing: 
execute sys.dbms_system.set_ev(150,17,10046,0,'');  


-- Example to SQL_TRACE Master Control process with level 8 (Waits):  
execute sys.dbms_system.set_ev(143,50,10046,8,'');  

-- and stop tracing:  
execute sys.dbms_system.set_ev(143,50,10046,0,'');

Option 6: Use the Data Pump Log Analyzer

I’ve personally used the Data Pump Log Analyzer for some time and have found it to be incredibly user-friendly, making it simple to understand the performance and runtime statistics of Data Pump jobs. This tool is highly effective in streamlining troubleshooting efforts, quickly identifying bottlenecks, and delivering clear insights into job performance. It’s a fantastic addition to a DBA’s toolkit and provides valuable capabilities that aren’t typically found in standard scripts. The Data Pump Log Analyzer has been tested with Data Pump log files across various database versions, including those generated by Data Pump client (expdp/impdp), Zero Downtime Migration (ZDM), OCI Database Migration Service (DMS), and Data Pump API (DBMS_DATAPUMP).The Data Pump Log Analyzer is a Python-based command-line utility designed for in-depth analysis of Oracle Data Pump log files. It goes beyond basic log review by offering detailed, structured insights into key performance metrics, errors, and process details. This tool can be particularly useful for DBAs needing a quick and comprehensive view of Data Pump job behavior, helping with issue diagnosis and performance optimization. Link to read and download or a more detailed guide on it’s usage Link

With the Data Pump Log Analyzer, you get:

  • Detailed Operations and Processing Metrics: Granular information on data operations for pinpoint analysis.
  • Error and ORA- Code Analysis: Summaries and explanations of encountered errors for easier troubleshooting.
  • Object-Type Breakdown and Processing Times: Insight into performance by object type, aiding in performance tuning.
  • Data Pump Worker Performance: Analyzes individual worker processes for any lagging tasks.
  • Summarized Schema, Table, Partition Details: Overview of data handled by each schema, table, or partition.
  • Instance-Based Data Analysis (for Oracle 21c and later): Statistics by instance for performance evaluation in multitenant setups.
  • Flexible Output Options: Filter, sort, and export analysis results to text or HTML for efficient sharing and record-keeping.

One below is with basic syntax to get operational details.

$ python3 dpla.py import.log
========================
Data Pump Log Analyzer
========================
...
Operation Details
~~~~~~~~~~~~~~~~~
Operation: Import
Data Pump Version: 19.23.0.0.0
DB Info: Oracle Database 19c EE Extreme Perf Release 19.0.0.0.0
Job Name: FATDBAJOB1
Status: COMPLETED
 Processing: -
Errors: 1301
 ORA- Messages: 1267
Start Time: 2024-08-21 01:30:45
End Time: 2024-08-21 11:43:11
Runtime: 35:03:06
Data Processing
~~~~~~~~~~~~~~~
Parallel Workers: 104
Schemas: 47
Objects: 224718
Data Objects: 188131
Overall Size: 19.11 TB

Use flag ‘-e’ to view all ORA- messages encountered during the Data Pump operation, or optionally you can filter our specific errors as well i.e. ‘-e ORA-39082 ORA-31684′.

python3 dpla.py import.log -e
========================
Data Pump Log Analyzer
========================
...
ORA- MESSAGES DETAILS
~~~~~~~~~~~~~~~~~~~~~
(sorted by count):
Message Count
--------------------------------------------------------------------------------------------------- ---------
ORA-39346: data loss in character set conversion for object COMMENT 919
ORA-39082: Object type PACKAGE BODY created with compilation warnings 136
ORA-39346: data loss in character set conversion for object PACKAGE_BODY 54
ORA-39082: Object type TRIGGER created with compilation warnings 36
ORA-39082: Object type PROCEDURE created with compilation warnings 29
ORA-31684: Object type USER already exists 27
ORA-39111: Dependent object type PASSWORD_HISTORY skipped, base object type USER already exists 27
ORA-39346: data loss in character set conversion for object PACKAGE 18
ORA-39082: Object type PACKAGE created with compilation warnings 10
ORA-39082: Object type VIEW created with compilation warnings 7
ORA-39346: data loss in character set conversion for object PROCEDURE 2
ORA-39082: Object type FUNCTION created with compilation warnings 2
--------------------------------------------------------------------------------------------------- ---------
Total 1267
--------------------------------------------------------------------------------------------------- ---------


Use flag ‘-o’ to see details about which types of database objects were involved in the Data Pump operation.

python3 dpla.py import.log -o
========================
Data Pump Log Analyzer
========================
...
Object                                  Count      Seconds      Workers     Duration
----------------------------------      ---------- -----------  ----------- ------------
SCHEMA_EXPORT/TABLE/TABLE_DATA             188296    6759219         128       6759219
CONSTRAINT                                    767      37253           1         37253
TABLE                                        2112       3225          51           156
COMMENT                                     26442        639         128            18
PACKAGE_BODY                                  197        125         128             5
OBJECT_GRANT                                 5279         25           1            25
TYPE                                          270          6           1             6
ALTER_PROCEDURE                               149          5           2             3
ALTER_PACKAGE_SPEC                            208          4           3             2
PACKAGE                                       208          3           3             1
PROCEDURE                                     149          2           2             1

...
---------------------------------- ---------- ----------- ----------- ------------
Total 224755 6800515 128 6796697
---------------------------------- ---------- ----------- ----------- ------------


Hope It Helped!
Prashant Dixit

Posted in Uncategorized | Tagged: , , , , , , , , , , , | Leave a Comment »

Oracle zero downtime migration 21.2

Posted by FatDBA on August 31, 2021

I am happy, excited and I guess this time no much writing and explanation is needed, as this sole image is enough 🙂
Pic courtesy: Oracle Corp

Hope It Helped!
Prashant Dixit

Posted in Uncategorized | Tagged: , , | Leave a Comment »

Migration assessment report, possible with ora2pg ?

Posted by FatDBA on July 3, 2021

Hi Guys,

Last week someone asked if me if it’s possible to generate the migration assessment report (of any sort) if using ora2pg for migration ? – The entire team was coming from EDB PostgreSQL migration where they used their migration toolkit, and there you can generate something similar, but with their current project, ora2pg was finalized as a migration tool for Oracle to vanilla PostgreSQL migration.

And the answer to their question was YES, it’s possible to generate the migration assessment report with ora2pg too, which is very useful as it performs an assessment for the potential migration problems or difficulties. It allocates a cost per object types and also provides other details like invalid object counts, total number of object types, comments and more description about objects etc.

It inspects all database objects , functions, stored procedures to detect if there are some objects or PL/SQL code that cannot be automatically converted by the tool. At the end of the report it calculates the overall cost (sum of all costs) and assigns an approximate number of days or time to perform the migration.

Default time per “cost evaluation unit” is 5 minutes, and outputs can be generated in text (default), html or csv formats.

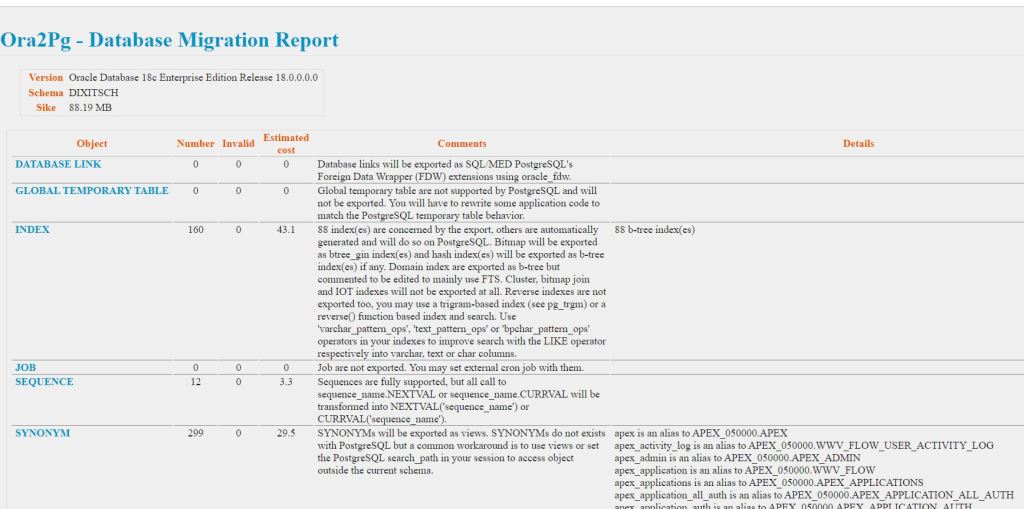
Let’s generate a sample report, but first let me show you the version of ora2pg, and next will call the report for Oracle database running on 18c for a particular schema.

$
$ ora2pg -t SHOW_VERSION -c config/ora2pg.conf
Oracle Database 18c Enterprise Edition Release 18.0.0.0.0


-- Here we used 'estimate_cost' is to activate the migration cost evaluation with SHOW_REPORT

$ ora2pg -t show_report  --estimate_cost -c config/ora2pg.conf --dump_as_html > /tmp/orapgtestmigr/ora2pgreport.html

-------------------------------------------------------------------------------
Ora2Pg v20.0 - Database Migration Report
-------------------------------------------------------------------------------
Version  Oracle Database 18c Enterprise Edition Release 18.0.0.0.0
Schema   DIXITSCH
Size     88.19 MB

Below is the screen snip of the report head.

Please click below link to view the full report.

Hope It Helped!
Prashant Dixit
Posted in Advanced | Tagged: , , , | 1 Comment »

‘WARNING OGG-00552, ODBC error: SQLSTATE IM002 native database error 0. [DataDirect][ODBC lib]’ while doing data migration from Oracle to PostgreSQL using Golden Gate …

Posted by FatDBA on June 24, 2021

Hey Guys,

Just a question – Have you ever received below error message while doing the data migration from Oracle to PostgreSQL database using Golden Gate ?

GGSCI (canttowin.ontadomain) 2> dblogin sourcedb ora19topg12 userid opeth
Password:

2021-06-23 14:52:32  WARNING OGG-00552 Database operation failed: Couldn't connect to odbc. 
ODBC error: SQLSTATE IM002 native database error 0. 
[DataDirect][ODBC lib] Data source name not found and no default driver specified.
ERROR: Database operation failed: Couldn't connect to ora19topg12. 
ODBC error: SQLSTATE IM002 native database error 0. 
[DataDirect][ODBC lib] Data source name not found and no default driver specified Failed to open data source ora19topg12 for user opeth.

If yes, then few of things that you can always go and check!

First, check if your pg_hba.conf has below entries, so that ALL clients can connect. The sample below just means that all clients can connect to the Postgres database. Commonly this could show more restrictive setting depending on business rules, so it is always worth to have a look at this file when clients can not connect to the Postgres database using the ODBC driver.

# IPv4 local connections:
host    all             all             0.0.0.0/0             md5

Second, check for listen_adress parameter in postgresql.conf file on your PostgreSQL host. You can set it as ‘*’ (just like below), that means that Postgres listens on all available addresses.

# - Connection Settings -

listen_addresses = '*'          # what IP address(es) to listen on;
                                # comma-separated list of addresses;
                                # defaults to 'localhost'; use '*' for all
                                # (change requires restart)

Third, after all these changes, don’t forget to rebooted your PostgreSQL database ….

Hopefully after all above actions, you will be able to resolve the problem, if not, please let me know that through comments, I can try and help!

Hope It Helped!
Prashant Dixit
Posted in Advanced | Tagged: , , , | Leave a Comment »

How to enable RAT feature and some Troubleshooting

Posted by FatDBA on February 28, 2020

Hi Everyone,

This post of all about preparing your database before you start using RAT on it, as it’s little tricky. You have to enable the feature at the binary level before you start using the RAT replay plus you have to patch your database with few of the RAT related mandatory patches.

This post is all about enabling the feature at the binary level and one of the issue that I have faced immediately after that.

My database which is 11.2.0.4.0 (2 Node RAC) has the RAT feature set to FALSE, which means that the option is not yet enabled.


SQL> select * from v$option where parameter like 'Real Application Testing';

PARAMETER                                                        VALUE
---------------------------------------------------------------- ----------------------------------------------------------------
Real Application Testing                                         FALSE
 

Alright, so next step is to enable the feature at the binary level, and to do that you have to run ‘make’ command and bind rat_on to your Oracle Home. Here I have a 2 Node RAC and I am starting with Node 1 and once done will repeat steps on Node 2.


[oracle@Testdb lib]$ make -f ins_rdbms.mk rat_on ioracle
/usr/bin/ar d /u01/app/oracle/product/11.2.0/dbhome_1/rdbms/lib/libknlopt.a kecnr.o
/usr/bin/ar cr /u01/app/oracle/product/11.2.0/dbhome_1/rdbms/lib/libknlopt.a /u01/app/oracle/product/11.2.0/dbhome_1/rdbms/lib/kecwr.o
chmod 755 /u01/app/oracle/product/11.2.0/dbhome_1/bin

 - Linking Oracle
rm -f /u01/app/oracle/product/11.2.0/dbhome_1/rdbms/lib/oracle
gcc  -o /u01/app/oracle/product/11.2.0/dbhome_1/rdbms/lib/oracle -m64 -z noexecstack -L/u01/app/oracle/product/11.2.0/dbhome_1/rdbms/lib/ -L/u01/app/oracle/product/11.2.0/dbhome_1/lib/ 
-L/u01/app/oracle/product/11.2.0/dbhome_1/lib/stubs/   -Wl,-E /u01/app/oracle/product/11.2.0/dbhome_1/rdbms/lib/opimai.o /u01/app/oracle/product/11.2.0/dbhome_1/rdbms/lib/ssoraed.o /u01/app/oracle/product/11.2.0/dbhome_1/rdbms/lib/ttcsoi.o  -Wl,--whole-archive -lperfsrv11 -Wl,--no-whole-archive /u01/app/oracle/product/11.2.0/dbhome_1/lib/nautab.o /u01/app/oracle/product/11.2.0/dbhome_1/lib/naeet.o /u01/app/oracle/product/11.2.0/dbhome_1/lib/naect.o /u01/app/oracle/product/11.2.0/dbhome_1/lib/naedhs.o /u01/app/oracle/product/11.2.0/dbhome_1/rdbms/lib/config.o  -lserver11 -lodm11 -lcell11 -lnnet11 -lskgxp11 -lsnls11 -lnls11  -lcore11 -lsnls11 -lnls11 -lcore11 -lsnls11 -lnls11 -lxml11 -lcore11 -lunls11 -lsnls11 -lnls11 -lcore11 -lnls11 -lclient11  -lvsn11 -lcommon11 -lgeneric11 -lknlopt `if /usr/bin/ar tv /u01/app/oracle/product/11.2.0/dbhome_1/rdbms/lib/libknlopt.a | grep xsyeolap.o > /dev/null 2>&1 ; then echo "-loraolap11" ; fi` -lslax11 -lpls11  -lrt -lplp11 -lserver11 -lclient11  -lvsn11 -lcommon11 -lgeneric11 `if [ -f /u01/app/oracle/product/11.2.0/dbhome_1/lib/libavserver11.a ] ; then echo "-lavserver11" ; else echo "-lavstub11"; fi` `if [ -f /u01/app/oracle/product/11.2.0/dbhome_1/lib/libavclient11.a ] ; then echo "-lavclient11" ; fi` -lknlopt -lslax11 -lpls11  -lrt -lplp11 -ljavavm11 -lserver11  -lwwg  `cat /u01/app/oracle/product/11.2.0/dbhome_1/lib/ldflags`    -lncrypt11 -lnsgr11 -lnzjs11 -ln11 -lnl11 -lnro11 `cat /u01/app/oracle/product/11.2.0/dbhome_1/lib/ldflags`    -lncrypt11 -lnsgr11 -lnzjs11 -ln11 -lnl11 -lnnz11 -lzt11 -lmm -lsnls11 -lnls11  -lcore11 -lsnls11 -lnls11 -lcore11 -lsnls11 -lnls11 -lxml11 -lcore11 -lunls11 -lsnls11 -lnls11 -lcore11 -lnls11 -lztkg11 `cat /u01/app/oracle/product/11.2.0/dbhome_1/lib/ldflags`    -lncrypt11 -lnsgr11 -lnzjs11 -ln11 -lnl11 -lnro11 `cat /u01/app/oracle/product/11.2.0/dbhome_1/lib/ldflags`    -lncrypt11 -lnsgr11 -lnzjs11 -ln11 -lnl11 -lnnz11 -lzt11   -lsnls11 -lnls11  -lcore11 -lsnls11 -lnls11 -lcore11 -lsnls11 -lnls11 -lxml11 -lcore11 -lunls11 -lsnls11 -lnls11 -lcore11 -lnls11 `if /usr/bin/ar tv /u01/app/oracle/product/11.2.0/dbhome_1/rdbms/lib/libknlopt.a | grep "kxmnsd.o" > /dev/null 2>&1 ; then echo " " ; else echo "-lordsdo11"; fi` -L/u01/app/oracle/product/11.2.0/dbhome_1/ctx/lib/ -lctxc11 -lctx11 -lzx11 -lgx11 -lctx11 -lzx11 -lgx11 -lordimt11 -lclsra11 -ldbcfg11 -lhasgen11 -lskgxn2 -lnnz11 -lzt11 -lxml11 -locr11 -locrb11 -locrutl11 -lhasgen11 -lskgxn2 -lnnz11 -lzt11 -lxml11  -loraz -llzopro -lorabz2 -lipp_z -lipp_bz2 -lippdcemerged -lippsemerged -lippdcmerged  -lippsmerged -lippcore  -lippcpemerged -lippcpmerged  -lsnls11 -lnls11  -lcore11 -lsnls11 -lnls11 -lcore11 -lsnls11 -lnls11 -lxml11 -lcore11 -lunls11 -lsnls11 -lnls11 -lcore11 -lnls11 -lsnls11 -lunls11  -lsnls11 -lnls11  -lcore11 -lsnls11 -lnls11 -lcore11 -lsnls11 -lnls11 -lxml11 -lcore11 -lunls11 -lsnls11 -lnls11 -lcore11 -lnls11 -lasmclnt11 -lcommon11 -lcore11 -laio    `cat /u01/app/oracle/product/11.2.0/dbhome_1/lib/sysliblist` -Wl,-rpath,/u01/app/oracle/product/11.2.0/dbhome_1/lib -lm    `cat /u01/app/oracle/product/11.2.0/dbhome_1/lib/sysliblist` -ldl -lm   -L/u01/app/oracle/product/11.2.0/dbhome_1/lib

test ! -f /u01/app/oracle/product/11.2.0/dbhome_1/bin/oracle ||\
           mv -f /u01/app/oracle/product/11.2.0/dbhome_1/bin/oracle /u01/app/oracle/product/11.2.0/dbhome_1/bin/oracleO
mv /u01/app/oracle/product/11.2.0/dbhome_1/rdbms/lib/oracle /u01/app/oracle/product/11.2.0/dbhome_1/bin/oracle
chmod 6751 /u01/app/oracle/product/11.2.0/dbhome_1/bin/oracle
[oracle@Testdb lib]$
 

Alright, so it’s done. No errors during the enablement process. Let’s connect with the database and see if the status of the feature.


[oracle@Testdb ~]$ !sql
sqlplus / as sysdba

SQL*Plus: Release 11.2.0.4.0 Production on Mon Sep 16 22:14:59 2019

Copyright (c) 1982, 2013, Oracle.  All rights reserved.

Connected.
SQL> alter system switch logfile;

ERROR at line 1:
ORA-01012: not logged on
Process ID: 0
Session ID: 0 Serial number: 0
 

Oops, why is that. I have set the environmental variables and everything is in place then why it’s not allowing me to connect with the database and say not logged on. This is strange!

Let’s check if there is anything captured withing alert logs and other traces.


Mon Jan 16 22:19:48 2019
WARNING: Oracle executable binary mismatch detected.
 Binary of new process does not match binary which started instance
issue alter system set "_disable_image_check" = true to disable these messages
Process J000 died, see its trace file
kkjcre1p: unable to spawn jobq slave process
Errors in file /u01/app/oracle/diag/rdbms/Testdb/Testdb1/trace/Testdb1_cjq0_176885.trc:
Mon Jan 16 22:19:49 2019
WARNING: Oracle executable binary mismatch detected.
 Binary of new process does not match binary which started instance
issue alter system set "_disable_image_check" = true to disable these messages
Mon Jan 16 22:19:49 2019
Errors in file /u01/app/oracle/diag/rdbms/Testdb/Testdb1/trace/Testdb1_j000_1389.trc:
ORA-27140: attach to post/wait facility failed
ORA-27300: OS system dependent operation:invalid_egid failed with status: 1
ORA-27301: OS failure message: Operation not permitted
ORA-27302: failure occurred at: skgpwinit6
ORA-27303: additional information: startup egid = 54322 (dba), current egid = 54321 (oinstall)
Mon Jan 16 22:19:49 2019
WARNING: Oracle executable binary mismatch detected.
 Binary of new process does not match binary which started instance
issue alter system set "_disable_image_check" = true to disable these messages
 

But it’s all good, no error except a general warning of “_disable_image_check” which happens as we have made a live change and it’s reporting that a mismatch is there at the binary level which were used to start the database instance. This can be easily suppressed by setting the parameter “_disable_image_check” to true.

Alright, so no idea or any hint from alerts and other logs.
Next I have checked the permissions of executable ‘oracle’ under ORACLE_HOME/bin folder.


[oracle@Testdb bin]$ ls -ll oracle
-rwsr-s--x 1 oracle oinstall 228395182 Sep 16 23:02 oracle


Why the group has changed from ‘dba’ to ‘oinstall’. This is strange!
Let me revert back the group name and re-assign it back to the older group.


[oracle@Testdb bin]$ chown oracle:dba oracle


Second I have noted the change in file permissions. It’s missing the ‘setuid’ access right flag from it, which is present in Node 2 where we didn’t made any change. I have revert back the permissions as well!


[oracle@Testdb bin]$ ls -ll oracle
-rwxr-x--x 1 oracle dba 228395182 Sep 16 23:02 oracle

[oracle@Testdb bin]$ chmod 6751 oracle

[oracle@Testdb bin]$ ls -ll oracle
-rwsr-s--x 1 oracle dba 228395182 Sep 16 23:02 oracle
 

And it worked, no errors this time and I was able to connect with the database using SQL Plus.


SQL> select * from v$option where parameter like 'Real Application Testing';

PARAMETER                                                        VALUE
---------------------------------------------------------------- ----------------------------------------------------------------
Real Application Testing                                         TRUE

SQL> select name, open_mode from v$database;

NAME      OPEN_MODE
--------- --------------------
Testdb  READ WRITE

SQL> select name, open_mode from gv$database;

NAME      OPEN_MODE
--------- --------------------
Testdb  READ WRITE
Testdb  READ WRITE
 

Hope It Helps
Prashant Dixit

Posted in Advanced | Tagged: , | Leave a Comment »

RAT (Real Application Testing) Replay using Filters

Posted by FatDBA on February 18, 2020

Hi Everyone,

My fourth post in a row about one of Oracle’s most underutilized tool named Real Application Testing (RAT) which is no doubt an extremely cost-effective and easy-to-use proactive performance management solution that enables businesses to fully assess the outcome of a system changes in test or production.

Alright, today’s post is all about RAT Reply in circumstances when you want to filter something from your captured workload. I mean for example you have captured 1 hour of production workload which you want to play on your target database but not everything, I mean want to exclude few of the schemas.

Well, this can be easily done during the load capture time as well, but in case if you missed that then this can also be done during replay time. So, today’s post is all about that. Once again I would like to explain the method using step-wise approach.

Step 1:
Suppose you want to exclude user with name DIXIT
Create exclusion filter for username DIXIT.


BEGIN
DBMS_WORKLOAD_REPLAY.ADD_FILTER (fname => 'ignore_dixit30', fattribute => 'USER', fvalue => 'DIXIT');
END;
/
 

Step 2:
Next you need to create the filter set which will be used by the replay during execution. This is where you have to pass the replay directory details, Name of the filter set you want and the action to include or bind it with the replay.


exec DBMS_WORKLOAD_REPLAY.CREATE_FILTER_SET (replay_dir => 'RATOCT10', filter_set => 'MyReplayFilterdixit30', default_action => 'INCLUDE');
 

Step 3:
Next you need to initialize the replay.


execute DBMS_WORKLOAD_REPLAY.INITIALIZE_REPLAY('REPLAY_30OCT19', 'RATOCT10');
 

Step 4:
The next step is to use the filter which we have created at step 2 above.
Note: The replay MUST be initialized first before calling USER_FILTER_SET


exec DBMS_WORKLOAD_REPLAY.USE_FILTER_SET (filter_set => 'MyReplayFilterdixit30');
 

Step 5:
Next you can verify if the filter set and filters are created or not. You can do that using below provided dynamic views relevant to REPLAY or RAT.


select CAPTURE_ID, SET_NAME, FILTER_NAME, VALUE from DBA_WORKLOAD_REPLAY_FILTER_SET;
select * from DBA_WORKLOAD_FILTERS where value='DIXIT';
 

Step 6:
Next proceed with the prepare and start the Replay

execute DBMS_WORKLOAD_REPLAY.PREPARE_REPLAY(synchronization => 'SCN')
 

Step 7:
Start recommended number of workload clients on host/hosts.
Note: It’s not necessary to use the DEBUG & workdir parameters as we only used them to generate extra diagnostic logs or traces that we will use in case if replay fails. If not needed only mode, replaydir parameters are required.


RAC Node 1:
nohup wrc system/xxxxxx mode=replay replaydir=/exp_pd/ratreplaydiroct/ratoctober10th_main workdir=/exp/ratreplaydiroct/traces_forreplay_date10012019 debug=ON > wrc301.log 2>&1&

nohup wrc system/xxxxxx mode=replay replaydir=/exp_pd/ratreplaydiroct/ratoctober10th_main workdir=/exp/ratreplaydiroct/traces_forreplay_date10012019 debug=ON > wrc302.log 2>&1&


RAC Node 2:
nohup wrc system/xxxxxx mode=replay replaydir=/exp_pd/ratreplaydiroct/ratoctober10th_main workdir=/exp/ratreplaydiroct/traces_forreplay_date10012019 debug=ON > wrc303.log 2>&1&

nohup wrc system/xxxxxx mode=replay replaydir=/exp_pd/ratreplaydiroct/ratoctober10th_main workdir=/exp/ratreplaydiroct/traces_forreplay_date10012019 debug=ON > wrc304.log 2>&1&
 

Step 8:
With all above steps running fine and no errors reported, we can start the replay next which will use the created exclusion filters and play rest of the load on the target database.


execute DBMS_WORKLOAD_REPLAY.START_REPLAY();
 

Hope It Helps
Prashant Dixit

Posted in Advanced | Tagged: | Leave a Comment »

Oracle Real Application Testing (RAT) – Part 3 : What is Replay and how to do it ?

Posted by FatDBA on February 14, 2020

Hi Guys,

In the same continuation from where I left last time …
This is the Part 3 of the final part of this three post series on Oracle Real Application Testing or RAT. This part mainly deals with the replay side or the target end where you finally replays of triggers the captured workload.

Alright, so let’s get started!
I am starting immediately after step 6 (which we covered in Part 2).

Step 7:
Next move all files from capture directory to target system (12c POC VM box in this case). I have created the directory for REPLAY purposes there at the target to receive all these files and to play them later on.

Next transfer the files from source.

Match the count on target directory, should be same.

RAT Replay (General) Steps:

Step 1:
The first step in preparation is to process the CAPTURE in the replay directory.
Note: This will be a one-time activity and only do if you are doing it for the first time. If the load is already processed and you have replayed it earlier then there is not any use to follow this step.


BEGIN
DBMS_WORKLOAD_REPLAY.PROCESS_CAPTURE(capture_dir=>'RAT_TRIALRUN');
END;
/
 

Step 2:
RESTORE DB: At This point we need to restore the database prior to the point when the Capture was started Note: No need to perform this step if this was already performed using Import or GRPs.

Step 3:
Next is to put the DB in readiness state. We have to initialize the replay.

execute DBMS_WORKLOAD_REPLAY.INITIALIZE_REPLAY('REPLAY_TRIALRUN1', 'RAT_TRIALRUN'); 

Step 4:
Next we will PREPARE the replay. There are many arguments that you can pass with the ‘synchronization’ parameter & many other parameters to tailor made your replay. We have finalized and opted PREPARE_REPLAY step i.e. synchronization specially.


execute DBMS_WORKLOAD_REPLAY.PREPARE_REPLAY(synchronization => 'SCN'); 

Step 5:
Next to get the required numbers of workload clients to run and replay that load on target database.
For that we have to run wrc utility in calibrate mode.


wrc system/xxxx mode=calibrate replaydir=/nfs_exp/prodrattest/ratdir_02092019
 

Step 6:
Next is to fire the recommended numbers of wrc (workload) clients on the target database to replay the captured workload.
For example, if 8 is the recommended number of replay clients. Then we can
Ex:

nohup wrc system/oracle@ mode=replay replaydir=/home/replay/rat & 

On RAC Node 1:
wrc system/XXXX mode=replay replaydir=/nfs_exp/prodrattest/ratdir_02092019

On RAC Node 2:
wrc system/XXXX mode=replay replaydir=/nfs_exp/prodrattest/ratdir_02092019
 

Step 7:
Next when all above steps are completed, next we will be replaying the workload.

execute DBMS_WORKLOAD_REPLAY.START_REPLAY(); 

Step 8:
Monitoring the Replay
There are many ways to perform the monitoring of the replay process, I will be sharing few scripts and discuss few of the methods that can be used to check/verify the replay progress.

Way 1:
Monitor the progress of replay using one of the dynamic view named DBA_WORKLOAD_REPLAYS


alter session set nls_date_format = 'DD-MON-YYYY HH24:MI:SS';
SELECT ID, NAME,DBNAME,
PARALLEL,STATUS, to_char(START_TIME,'dd/mm/yyyy hh24:mi'),
to_char(END_TIME,'dd/mm/yyyy hh24:mi'),DURATION_SECS/60, NUM_CLIENTS, USER_CALLS, DBTIME, RAC_MODE
AWR_BEGIN_SNAP,AWR_END_SNAP,AWR_EXPORTED
FROM DBA_WORKLOAD_REPLAYS;
where id=2;


Way 2:
To check what’s all is happening in the database including the load pushed by WRC clients.
This is a join of gv$sqlarea, gv$session to get session and SQL details.


select x.inst_id,x.sid ,x.serial#,x.username,sqlarea.parsing_schema_name,x.sql_id
 ,sqlarea.plan_hash_value
 ,sqlarea.LAST_ACTIVE_TIME
 ,sqlarea.DISK_READS
 ,sqlarea.BUFFER_GETS
 ,sqlarea.ROWS_PROCESSED
 ,sqlarea.CPU_TIME
 ,sqlarea.LAST_LOAD_TIME
 ,x.event,x.osuser,x.status
 ,x.process,x.machine,x.program,x.module,x.action
 ,TO_CHAR(x.LOGON_TIME, 'MM-DD-YYYY HH24:MI:SS') logontime
 ,x.LAST_CALL_ET
 ,x.SECONDS_IN_WAIT,x.state,sql_text,
 ltrim(to_char(floor(x.LAST_CALL_ET/3600), '09')) || ':'
  || ltrim(to_char(floor(mod(x.LAST_CALL_ET, 3600)/60), '09')) || ':'
  || ltrim(to_char(mod(x.LAST_CALL_ET, 60), '09'))    RUNNING_SINCE
 from   gv$sqlarea sqlarea,gv$session x
 where  x.sql_hash_value = sqlarea.hash_value
 and    x.sql_address    = sqlarea.address
 and    sql_text not like '%select x.inst_id,x.sid ,x.serial# ,x.username ,x.sql_id ,x.event%'
 and    sql_text not like '%select x.inst_id,x.sid ,x.serial#,x.username,sqlarea.parsing_schema_name,x.sql_id ,sqlarea.plan_hash_value%'
 and    x.status='ACTIVE'
 and x.USERNAME is not null
 and x.SQL_ADDRESS    = sqlarea.ADDRESS
 and x.SQL_HASH_VALUE = sqlarea.HASH_VALUE
 order by RUNNING_SINCE desc;
 

Way 3:
Below is the method or a way to identify the replay progress in terms of percentage completed.
Code and text is pasted below.

replay_progress_percentage

Step 9:
Reporting
Next step is to generate some RAT specific reporting which will be helpful to replay performance and other statistics.


DECLARE
cap_id         NUMBER;
rep_id         NUMBER;
rep_rpt        CLOB;
rpt_len                 NUMBER;
BEGIN
rep_rpt :=DBMS_WORKLOAD_REPLAY.REPORT(replay_id => 1,format => DBMS_WORKLOAD_REPLAY.TYPE_HTML);
dbms_output.put_line(DBMS_LOB.SUBSTR(rep_rpt,32767,1));
END;
/
 

Below is the code to generate Capture Vs Replay reports.


var report_bind clob;
begin
DBMS_WORKLOAD_REPLAY.COMPARE_PERIOD_REPORT (replay_id1 => 1, replay_id2=> null, format => 'HTML', result => :report_bind);
end;
/
 

Hope It Helps
Prashant Dixit

Posted in Advanced | Tagged: | 14 Comments »

Oracle Real Application Testing (RAT) – Part 2: What is Capture & how to do it ?

Posted by FatDBA on February 10, 2020

Hi Folks,

Continuing the same subject/topic what I have started in my last post – Real Application Testing (RAT). This post is all about the ‘Capture‘ part what happens on the source database where we captures the workload which will later on replayed on the target database.

I have break it in to few easy steps to understand.

Step 1:
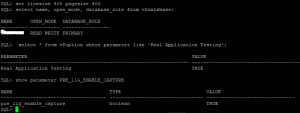
First we need to verify if the RAT option is installed and working fine. This you only need to verify upto 10Gr2 as all later versions comes with all features enabled by himself during the installation process, until you didn’t de-selected any specific feature during customized installation.
In case of 10g you need to check using v$option dynamic view for RAT parameter and there is a need to enable the parameter ‘pre_11g_enable_capture’.

Please see below the steps of verification!

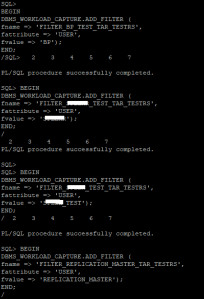
Step 2:
Creating exclusion FILTERS (If Required) for capture.
This is the step where we create filters to exclude few of the system usernames and few of other schemas like SYSMAN, SYS and all of such schemas where you don’t want to capture load.
Please see the screenshot use to do the same.

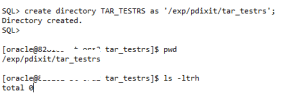
Step 3:
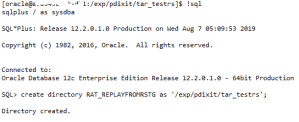
Creation of RAT specific OS based directory.
This is the place where all CAPTURE files will be saved and should be created like below.

Step 4:
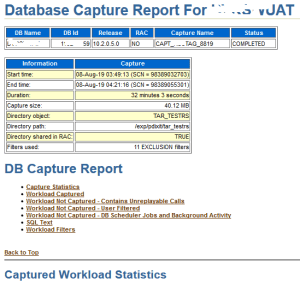
Next, we can now start the CAPTURE process, this should be done using the main RAT specific procedure DBMS_WORKLOAD_CAPTURE and its function START_CAPTURE. Here the main parameter to pass is name (Name of the capture you want to name), dir (directory which will hold all workload files, the same what I have created above).
There are few parameters which I have intentionally not used i.e. DURATION as there is a BUG in 10Gr2 database which causes the capture not to stop even after specific time and had to manually stop the process. So in below example I will be capturing XXXXX minutes of load from this database and will stop it explicitly.

This being a staging setup I am taking around 30 minutes of workload but in real time this could be anything between 10 or 15 minutes of peak hours.

You can monitor the progress using DBA_WORKLOAD_CAPTURES view. See below.

Next, you can get more details about this ongoing capture activity. See below.

Step 5:
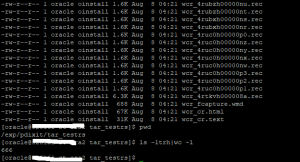
Next when we are done with the capturing of load for the specified time, we can go and stop it now. In my case on RS staging I left that running and capturing workload for ~ 32 Minutes.

Next, you can verify the contents by going to the RAT directory. There you will see .rec (recording) files, .wmd and a special report (TEXT/HTML format) will generate and is specific to CAPTURE process only.

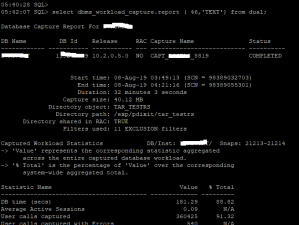
Now we have BEGIN SNAP Id and END SNAP (time duration for the capture runtime) we can generate the AWR report as well.
The same report can be fetched via text method as well.

Step 6:
Next we will export the AWR data. This will be later on used to generate the comparison report from REPLAY side. This will create two more files under the capture directory wcr_ca.log and wcr_ca.dmp

Next steps starts at the target end or the host and deserves a separate post.
I will soon be writing about Replay process in my next post. Till that time keep learning!

Hope It Helps
Prashant Dixit

Posted in Advanced | Tagged: , | Leave a Comment »

Oracle Real Application Testing (RAT) – Part 1: What it is ?

Posted by FatDBA on January 31, 2020

Hi Guys,

As committed I am back with the first edition or the post on Oracle RAT (Real Application Testing) and there be couple more follow up chapters on the same in next few days or weeks.

Alright, recently during one of our mission-critical production database migration we reached a point where we had to perform the Load Test before pushing the real-time workload on to this new system. I was asked to prepare the strategy and to pick the best possible tool to access the performance of the performance of this new system and how it will respond to the current traffic.

Received lot’s of suggestions from rest of the team, i.e. Swingbench, Loadrunner, Orion etc. but most of them are with a predefined set of Supplied Benchmarks though few are customized but are more related to the server performance and bechmarking but not at the Database or SQL level. And considering the notorious behavior of many of the custom code and legacy application modules I was more leaned towards picking a tool which covers both Database and SQL, and we finally agreed on Oracle RAT.

Oracle Real Application Testing, an option that comes with Oracle Enterprise Edition. Oracle Real Application Testing helps you to test the real-life workload after changes on the database such as database upgrades, OS upgrades, parameter changes, hardware replacement, etc. So, in short the Oracle RAT will be system stress test tool to simulate production load. Introduced in Oracle 11g Release 1. But yes, it’s not free and comes with additional cost and licenses.

There are two features “Database Replay” and “SQL Performance Analyzer” will help fine-tuning on the database before passing production.
I will cover more about the ‘Database Replay’ feature here and might cover the ‘SQL Performance Analyzer’ feature later.

When can you use RAT – “Database Replay” feature?
System Changes
– Hardware replacement such as CPU, RAM, etc.
– Database and OS upgrades
– Storage changes (OCFS2 – ASM)
– OS changes (Windows – Linux)
Configuration Changes
– Single Instance – RAC– Patch installation– Database parameter change

Which database versions are supported?
The workload capture process is supported on the Oracle Database 10g R2 (10.2.0.4) and above versions. The worload replay process is supported on the Oracle Database 11g R1 and above versions.

How to do it, where to start and all ?
Well there are two different ways you can perform the RAT (DB Replay) testing
– Using Oracle Enterprise Manager (OEM) : This option is entirely GUI based where you select your source and target systems and by doing all those clicks performs this stress/load testing on the system.
– Using command line way (My preferred way of doing this, yes I am ‘old school’) using DBMS_WORKLOAD_CAPTURE & DBMS_WORKLOAD_REPLAY procedures.

Some High Level Steps:
– Capture workload into capture files (In the form of .rec files, are flat files)
– Copy files to test system and preprocess them (to make them machine understandable)
– Replay files on test system (play the recorded files)
– Perform detailed analysis of workload capture and replay using reports generated by Database Replay. (Reporting for bench markings)

ON SOURCE System:
dbms_workload_capture.start_capture 
dbms_workload_capture.finish_capture; 

Copy the workload files to the client system. For example: – /home/oracle/rat/test1

On TARGET System:
1. dbms_workload_replay.process_capture 
2. dbms_workload_replay.initialize_replay 
3. dbms_workload_replay.prepare_replay 
4. Run the workload client to calibrate the replay. The calibration process (mode=CALIBRATE) recommends the number of client processes required to perform the replay
5. Replay the workload using below command.
dbms_workload_replay.start_replay; 

Components: The ARCHITECTURE (Simplified)

DB REPLAY “The Big Picture”

What is a Workload Client ?
The REPLAY uses wrc clients – Which are multi-threaded JAVA clients and can be started on the same machine/host or on separate hosts.
Will cover about them more in depth in future posts.


[oracle@PDIXIT:RAT]$ wrc system/XXXX mode=calibrate replaydir=/DBCapture/RAT/RAT_13DEC15_19_17
 Workload Replay Client: Release 11.2.0.4.0 - Production on Sat Dec 16 05:50:39 2015
Copyright (c) 1982, 2011, Oracle and/or its affiliates.  All rights reserved.
 
 
Report for Workload in: /DBCapture/RAT/RAT_13DEC16_19_17
-----------------------
Recommendation:
Consider using at least 13 clients divided among 4 CPU(s)
You will need at least 168 MB of memory per client process.
If your machine(s) cannot match that number, consider using more clients.
 
Workload Characteristics:
- max concurrency: 575 sessions
- total number of sessions: 1729
 
Assumptions:
- 1 client process per 50 concurrent sessions
- 4 client process per CPU
- 256 KB of memory cache per concurrent session
- think time scale = 100
- connect time scale = 100
- synchronization = TRUE
 

Now how to compare/benchmark ?
At the end of both CAPTURE & REPLAY methods you need to generate few process specific report.
Few of the important files that help in benchmarking are:
AWR Reports: Generate the AWR reports for the same time interval when we have any of the two process were in progress. The BEGIN AND END Snaps can be collected from DBA_WORKLOAD_CAPTURES & DBA_WORKLOAD_REPLAYS
CAPTURE/REPLAY Reports: These reports are specific to workload capture and playing on target.
Capture Vs Replay reports.

Hope It Helps
Prashant Dixit

Posted in Advanced, troubleshooting | Tagged: , | Leave a Comment »