Tales From A Lazy Fat DBA

Its all about Databases, their performance, troubleshooting & much more …. ¯\_(ツ)_/¯

Posts Tagged ‘performance’

Materialized Views Refresh slow ? This is what you can try …

Posted by FatDBA on November 22, 2021

Hi All,

Entire last week I was looking in to one system wide performance issue where customer reported slowness in their database since they’d moved into a new infrastructure, after data migration. Though this wasn’t the production system, but kind of equally important, and the issue was impacting their acceptance tests. I was updated that few of the Materialized Views are there and their refresh times are now extended by a great margin, since they moved to this new system.

As soon I got the access on their system, I did a quick check on the database and I found a huge list of MV refresh jobs are scheduled and almost all of them are running with a huge delay, the performance was not at all consistent, sometimes they gets refreshed within few minutes and another run goes for few hours. This initially sounded little bizarre to me, until I did a comparive stuy between the previous (fast) and the new (slow) databases. What I observed is that there is more than 500% of extra data there in the business tables in this new (slow) database and with such a huge data, all those complex MV refresh queries ultimately got slowed down here in the new system.

For an example, one of the critical MV taking ~ 200 mins to refresh an is created with COMPLETE REFRESH mode.

create MATERIALIZED VIEW MV_MYTEST_BIGREFRESH
BUILD DEFERRED
REFRESH ON DEMAND
COMPLETE
AS
select abc,xyz,cast(value as ajaaj) as test ....
............
.................


SELECT * 
FROM ( SELECT OWNER, 
              MVIEW_NAME, 
              CONTAINER_NAME, 
              REFRESH_MODE, 
              LAST_REFRESH_TYPE, 
              STALENESS, 
              round((LAST_REFRESH_END_TIME-LAST_REFRESH_DATE)*24*60,2) as REFRESH_TIME_MINS 
       FROM ALL_MVIEWS 
       WHERE LAST_REFRESH_TYPE IN ('FAST','COMPLETE')
     ) 
ORDER BY REFRESH_TIME_MINS DESC;
 
OWNER   MVIEW_NAME                       CONTAINER_NAME                   REFRESH_MODE LAST_REFRESH_TYPE STALENESS           REFRESH_TIME_MINS
------- -------------------------------- -------------------------------- ------------ ----------------- -------------------------------------
PRASH   MV_MYTEST_BIGREFRESH             MV_MYTEST_BIGREFRESH             DEMAND        COMPLETE      COMPLETE                196.75

Though I did multiple optimizations in order to stabilize performance, but would like to talk about few of the refresh tuning techniques that I have applied and finally worked for me.

Atomic_Refresh with value FALSE.
What caught my eye are all those long running DELETE statements running underneath those costly MV refresh jobs. This was the very first thing I tried with those complex and long running COMPLETE MV refresh, this is the optional parameter atomic_refresh of the procedure dbms_mview.refresh and is very useful. If the parameter is set to FALSE, the materialized view is deleted with a much faster TRUNCATE command. I immediately got the gain, as the runtime was dropped ~ 60% .. At the same time I have observed a great relax in redo generation as DELETE is replaced with TRUNCATE, and hence a great drop in ‘checkpoint incomplete‘ and ‘Log File Sync‘ waits.

The parameter atomic_refresh=FALSE works only with “complete” refresh, so “truncate” is only possible with “complete“. But there is one demerit too for this method, and is that no data is visible to the users during the refresh, so, choose wisely. If this is feasible in your environment, you can use the following command for a Complete Refresh:

BEGIN
dbms_mview.refresh(‘MV_MYTEST_BIGREFRESH_JOB’, method => ‘C’, atomic_refresh => FALSE);
END;


-- See below the REFRESH_TIME_MINS got dropped by ~ 60% after using setting atomic_refres = false
SELECT * 
FROM ( SELECT OWNER, 
              MVIEW_NAME, 
              CONTAINER_NAME, 
              REFRESH_MODE, 
              LAST_REFRESH_TYPE, 
              STALENESS, 
              round((LAST_REFRESH_END_TIME-LAST_REFRESH_DATE)*24*60,2) as REFRESH_TIME_MINS 
       FROM ALL_MVIEWS 
       WHERE LAST_REFRESH_TYPE IN ('FAST','COMPLETE')
     ) 
ORDER BY REFRESH_TIME_MINS DESC;
 
OWNER   MVIEW_NAME                       CONTAINER_NAME                   REFRESH_MODE LAST_REFRESH_TYPE STALENESS           REFRESH_TIME_MINS
------- -------------------------------- -------------------------------- ------------ ----------------- -------------------------------------
PRASH   MV_MYTEST_BIGREFRESH             MV_MYTEST_BIGREFRESH             DEMAND        COMPLETE      COMPLETE                79.12

Adding PX (Parallelism) to the base tables or to the refresh command itself.
Though with atomic_refrsh FALSE, I was able to cut down a great percentage of the overall elapsed time, but still customer asked for me, maybe some 30% more …
I decided to try PX to the base tables or to the refresh statement, among other parameters, this procedure takes one parameter PARALLELISM. At the outset, it appears that the PARALLELISM parameter should invoke a parallel refresh of the materialized view. However, it does not; it simply changes the requested degree of parallelism if it already executes in parallel. You can invoke this procedure as:

BEGIN
dbms_mview.refresh(‘MV_MYTEST_BIGREFRESH_JOB’, method => ‘C’, atomic_refresh => FALSE, PARALLELISM=>4); 
END;


-- See below the REFRESH_TIME_MINS got dropped by further ~30% after using PARALLELISM to the master/base MV tables.
SELECT * 
FROM ( SELECT OWNER, 
              MVIEW_NAME, 
              CONTAINER_NAME, 
              REFRESH_MODE, 
              LAST_REFRESH_TYPE, 
              STALENESS, 
              round((LAST_REFRESH_END_TIME-LAST_REFRESH_DATE)*24*60,2) as REFRESH_TIME_MINS 
       FROM ALL_MVIEWS 
       WHERE LAST_REFRESH_TYPE IN ('FAST','COMPLETE')
     ) 
ORDER BY REFRESH_TIME_MINS DESC;
 
OWNER   MVIEW_NAME                       CONTAINER_NAME                   REFRESH_MODE LAST_REFRESH_TYPE STALENESS           REFRESH_TIME_MINS
------- -------------------------------- -------------------------------- ------------ ----------------- -------------------------------------
PRASH   MV_MYTEST_BIGREFRESH             MV_MYTEST_BIGREFRESH             DEMAND        COMPLETE      COMPLETE                 55.08
  

You can also add PX to the base tables. When the master table of the materialized view has the PARALLEL attribute set to > 1, then the creation as well as the refresh processes will be parallelized. Whether or not you specify the PARALLELISM parameter in the REFRESH clause, doesn’t matter.

ALTER TABLE DIXIT_TEST_TABLE PARALLEL (DEGREE 4);

You can also add PX hint to the MV definition too! When the materialized view is created with a PARALLEL hint, then the creation as well as the refresh processes, will be parallelized. Whether or not you specify the PARALLELISM parameter in the REFRESH clause, doesn’t matter.
This is how you can ad a parallel hint in the materialized view definition!

CREATE MATERIALIZED VIEW TEST_MV
AS
SELECT /*+ PARALLEL(DIXIT_TEST_TABLE, 4) */ MONTHLY_ID, SALARY_DATE, SUM(ANNUAL_COUNTS)
FROM DIXIT_TEST_TABLE GROUP BY MONTHLY_ID, SALARY_DATE;

Stats Collection:
This is very vital that all of the tables, Indexes which your MV refresh references via the code, should be fresh and well collected. Look of for possibilities to add column level stats i.e Histograms wherever there is a scope, specially for low cardinality columns. You can also leave this to the optimizer to decide, by using METHOD_OPT=>’FOR ALL COLUMNS SIZE AUTO’

Other techniques:

  • Try for FAST/Incremental Refresh mode. With FAST refresh, only the changes since the last refresh are applied to the materialized view. Personally I have found the FAST refresh slower than the COMPLETE refresh mode, maybe because I used atomic_refresh parameter that replaced those costly DELETEs with fast TRUNCATE … Not sure why they called it FAST 🙂 To be sure that my materialized view can be fast refresh, we can also use explain_mview procedure and check the capability_name called “REFRESH_FAST”. The MV_CAPABILITIES TABLE is created in the owner’s schema by running the following script ..
SQL> @$ORACLE_HOME/rdbms/admin/utlxmv.sql

SQL> exec dbms_mview.explain_mview('MV_MYTEST_BIGREFRESH_JOB');
PL/SQL procedure successfully completed.
 
SQL> select capability_name,possible,related_text,msgtxt from mv_capabilities_table;

CAPABILITY_NAME                POSSIBLE             RELATED_TEXT            MSGTXT
------------------------------ -------------------- ----------------------- ----------------------------------------------------------------------------
PCT                            N
REFRESH_COMPLETE               Y
REFRESH_FAST                   Y <<<<<<<<---------------
REWRITE                        Y
PCT_TABLE                      N                    ID_ID_CANADA_HISTORY_T1 relation is not a partitioned table
PCT_TABLE                      N                    ID_ID_CANADA_HISTORY_TV relation is not a partitioned table
PCT_TABLE                      N                    DWH_SITE                relation is not a partitioned table
REFRESH_FAST_AFTER_INSERT      Y
REFRESH_FAST_AFTER_ONETAB_DML  Y
REFRESH_FAST_AFTER_ANY_DML     Y
REFRESH_FAST_PCT               N                                            PCT is not possible on any of the detail tables in the materialized view
REWRITE_FULL_TEXT_MATCH        Y
REWRITE_PARTIAL_TEXT_MATCH     Y
REWRITE_GENERAL                Y
REWRITE_PCT                    N                                            general rewrite is not possible or PCT is not possible on any of the detail tables
PCT_TABLE_REWRITE              N                    ID_ID_CANADA_HISTORY_T1 relation is not a partitioned table
PCT_TABLE_REWRITE              N                    ID_ID_CANADA_HISTORY_TV relation is not a partitioned table
PCT_TABLE_REWRITE              N                    DWH_SITE                relation is not a partitioned table
 
18 rows selected.
  • Out-of-place refresh is a new option on DBMS_MVIEW. REFRESH in Oracle 12c. The complete refresh process builds a new table which seamlessly becomes the materialized view, the old table is dropped. It only works in conjunction with non-atomic refresh.
  • DBMS_ADVISOR contains a procedure called TUNE_MVIEW that is used when working with the query rewrite mechanism. DBMS_MVIEW.EXPLAIN_MVIEW and DBMS_MVIEW.EXPLAIN_REWRITE that could be used to diagnose why a materialized view wasn’t being used for query rewrite. The DBMS_ADVISOR.TUNE_MVIEW procedure has the capability to add additional aggregate columns and materialized view logs to the view definition so that it becomes fast refreshable.

Well, all after I’ve performed above three methods, I was able to reduce the MV refresh downtimes by more than 92% … 🙂

Hope It Helped!
Prashant Dixit

Posted in Advanced, troubleshooting | Tagged: , , , | 2 Comments »

Confused about using PURGE_ALL to remove optimizer statistics from the SYSAUX ?

Posted by FatDBA on November 7, 2021

Hi All,

Recently while working in one for the project where SYSAUX was growing at an alarming rate, customer operations team decided to purge old stats from the SYSAUX as that was occupying around 50% of the total occupancies. Though MMON purges these stats regularly from the OPTSTAT tables, but due to a known bug (14373728) it failed to that. I mean ideally it should purge these statistics according to the default retention, which is 30 days in this case, but it seem it can not due to that bug. MMON performs these purge activities automatically, but it has a limit of 5 minutes to perform these activities. So if the purging takes more than 5 mins, then the activities are aborted and as a result the stats are not purged.

Due to some reasons they don’t want to apply the patch, but agreed to purge all stats from the OPTSTAT related tables within SYSAUX. But, the team was very perplexed to perform the PURGE_ALL as a big-bang (not using sysdate-x) approach, as they weren’t sure if PURGE_ALL will remove all the stats including current statistics on objects (Tables, Indexes etc.) or it only touches OPTSTAT tables and truncates them.

About optimizer stats tables (OPTSTAT in short), they contain backup information about stats collection and involves tables like WRI$_OPTSTAT_OPR, WRI$_OPTSTAT_AUX_HISTORY, WRI$_OPTSTAT_TAB_HISTORY, WRI$_OPTSTAT_IND_HISTORY, WRI$_OPTSTAT_HISTGRM_HISTORY, WRI$_OPTSTAT_HISTHEAD_HISTORY.

Even the comments from Oracle customer support has raised the confusion, as their explanation was too hazy and with lot of muddiness about using EXEC DBMS_STATS.PURGE_STATS(DBMS_STATS.PURGE_ALL). So, I decided to do a quick demo to clear all the doubts around this subject.

All below mentioned tests were performed on Oracle 21c database.

-- Here I first created a sample table and generated 10000 random rows. 
[oracle@fatdba ~]$ sqlplus / as sysdba

SQL*Plus: Release 21.0.0.0.0 - Production on Wed Nov 3 23:53:14 2021
Version 21.3.0.0.0


SQL> CREATE TABLE tab1 AS
SELECT level AS id,
       CASE
         WHEN MOD(level, 2) = 0 THEN 0
         ELSE TRUNC(DBMS_RANDOM.value(1,10))
       END AS record_type,
       'Description for ' || level AS description
FROM   dual
CONNECT BY level <= 10000;

Table created.


SQL> select count(*) from tab1;

  COUNT(*)
----------
     10000


SQL> ALTER TABLE tab1 ADD CONSTRAINT tab1_pk PRIMARY KEY (id);

Table altered.


SQL> CREATE INDEX tab1_record_type_idx ON tab1(record_type);

Index created.

SQL> EXEC DBMS_STATS.gather_table_stats(USER, 'TAB1');

PL/SQL procedure successfully completed.


SQL> EXEC DBMS_STATS.gather_index_stats(USER, 'TAB1_RECORD_TYPE_IDX');

PL/SQL procedure successfully completed.

Okay, so we have a table ready with 10000 random rows with a primary key constraint and have created one index on record_type column and have gathered stats on the table and the index. Next, I will purge all stats from OPTSTAT tables using PURGE_ALL function

23:13:05 SQL> EXEC DBMS_STATS.PURGE_STATS(DBMS_STATS.PURGE_ALL);

PL/SQL procedure successfully completed.

Elapsed: 00:00:01.13
23:13:09 SQL>


-- Now the same can be confirmed by querying OPTSTAT tables WRI$_OPTSTAT_IND_HISTORY and  WRI$_OPTSTAT_TAB_HISTORY for Tables and Indexes, 
-- And they all are gone, no more data is there in these tables after flush.

23:15:55 SQL> select OBJ#, flags, rowcnt, ANALYZETIME from WRI$_OPTSTAT_IND_HISTORY where obj#=77267;

no rows selected

23:16:01 SQL> select FLAGS,ROWCNT, OBJ#,ANALYZETIME from WRI$_OPTSTAT_TAB_HISTORY where obj#=77256;

no rows selected

Now, lets check if tables and index has the stats collection date coming or not, and yes they are there! means still the table has their current stats and didn’t got purged after we executed PURGE_ALL on OPTSTAT tables.

23:13:37 SQL> select index_name, index_type, last_analyzed from dba_indexes where index_name='TAB1_RECORD_TYPE_IDX';

INDEX_NAME                     INDEX_TYPE                  LAST_ANALYZED
------------------------------ --------------------------- --------------------
TAB1_RECORD_TYPE_IDX           NORMAL                      03-NOV-2021 23:12:07

Elapsed: 00:00:00.00

23:13:50 SQL> select table_name, last_analyzed from dba_tables where table_name='TAB1';

TABLE_NAME           LAST_ANALYZED
-------------------- --------------------
TAB1                 03-NOV-2021 23:08:32

Elapsed: 00:00:00.00

I am now going to recollect stats on both of them, Tables and its Index, and with that, the last_analyzed date/time is refreshed with the latest timestamp.

repeating same steps for TABLE. And one more time, I see that the TABLE HISTORY related OPTSTAT table has only previous/historical values not the latest timestamp from stats collection.
I mean it should should have ’03-NOV-2021 23:26:07′ as a latest entry in the table, but has only got ’03-NOV-2021 23:17:28′ when last stats were collected.

23:25:54 SQL> EXEC DBMS_STATS.gather_table_stats(USER, 'TAB1');

PL/SQL procedure successfully completed.


23:26:15 SQL> select table_name, last_analyzed from dba_tables where table_name='TAB1';

TABLE_NAME           LAST_ANALYZED
-------------------- --------------------
TAB1                 03-NOV-2021 23:26:07


23:26:08 SQL> select FLAGS,ROWCNT, OBJ#,ANALYZETIME from WRI$_OPTSTAT_TAB_HISTORY where obj#=77256;

     FLAGS     ROWCNT       OBJ# ANALYZETIME
---------- ---------- ---------- --------------------
        10      10000      77256 03-NOV-2021 23:08:32
        10      10000      77256 03-NOV-2021 23:17:28 ----> previous value, not the latest timestamp of 03-NOV-2021 23:26:07


-- One more time, for Table ....

23:29:05 SQL> EXEC DBMS_STATS.gather_table_stats(USER, 'TAB1');

PL/SQL procedure successfully completed.


23:29:11 SQL> 23:29:11 SQL>  select table_name, last_analyzed from dba_tables where table_name='TAB1';


TABLE_NAME           LAST_ANALYZED
-------------------- --------------------
TAB1                 03-NOV-2021 23:29:07


23:29:07 SQL> select FLAGS,ROWCNT, OBJ#,ANALYZETIME from WRI$_OPTSTAT_TAB_HISTORY where obj#=77256;


     FLAGS     ROWCNT       OBJ# ANALYZETIME
---------- ---------- ---------- --------------------
        10      10000      77256 03-NOV-2021 23:08:32
        10      10000      77256 03-NOV-2021 23:17:28
        10      10000      77256 03-NOV-2021 23:26:07 ----> previous value, not the latest timestamp of 03-NOV-2021 23:29:0

Let’s do this on Indexes!

23:32:26 SQL> EXEC DBMS_STATS.gather_index_stats(USER, 'TAB1_RECORD_TYPE_IDX');

PL/SQL procedure successfully completed.

23:32:34 SQL> select index_name, index_type, last_analyzed from dba_indexes where index_name='TAB1_RECORD_TYPE_IDX';

INDEX_NAME                     INDEX_TYPE                  LAST_ANALYZED
------------------------------ --------------------------- --------------------
TAB1_RECORD_TYPE_IDX           NORMAL                      03-NOV-2021 23:32:27


23:32:33 SQL> select OBJ#, flags, rowcnt, ANALYZETIME from WRI$_OPTSTAT_IND_HISTORY where obj#=77267;

      OBJ#      FLAGS     ROWCNT ANALYZETIME
---------- ---------- ---------- --------------------
     77267         10      10000 03-NOV-2021 23:12:07
     77267         10      10000 03-NOV-2021 23:31:37 ---> Has only got '03-NOV-2021 23:31:37' which is a previous timestamp/history, not the latest of 03-NOV-2021 23:32:27

So, from above tests it’s clear that the PURGE_ALL only touches and truncates WRI$_OPTSTAT_XXXX tables and as they always have the previous stats collection details, your present stats on objects will always be there, untouched and safe. So, this command is very safe to run and is best when you are thinking of doing an iterative purge using SYSDATE-X as it’s always very slow as compared to PURGE_ALL which truncates the table and doesn’t delete records from it, and the reason of its agility.

Hope It Helped!
Prashant Dixit

Posted in Advanced, troubleshooting | Tagged: , , | Leave a Comment »

Another 10053 trace viewer : Best of the Best …

Posted by FatDBA on October 21, 2021

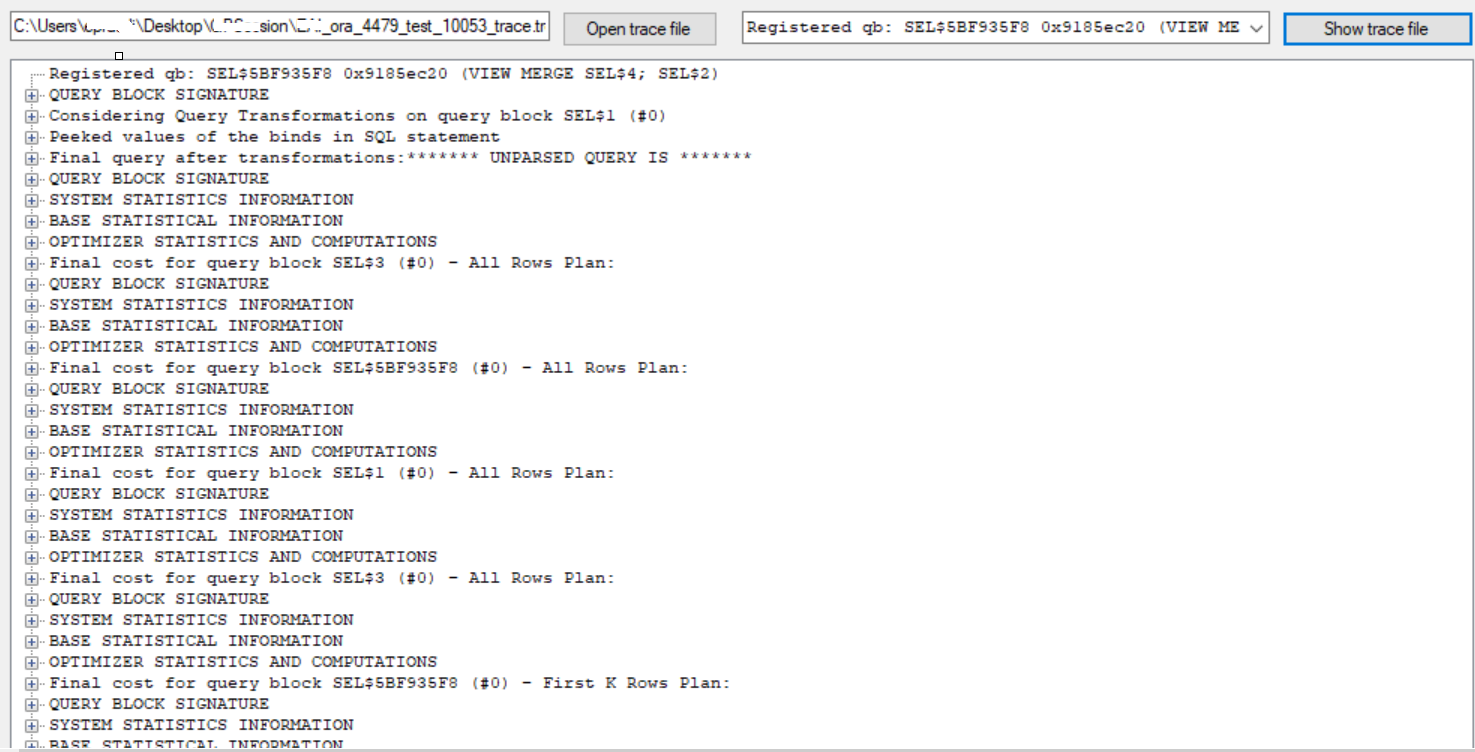
Finally, I’ve got a working copy of my favorite 10053 optimizer trace viewer from one of my connection. This one was written by Sergei Romanenko. I love it because it allows direct jumps to the most important parts of the trace and also uses highlighter to improve the readability of the trace and optionally formats the final query after transformations. It’s pretty easy to use, and you can directly search the keywords within these big thumping traces. And you can also wrap your text and can also format the final query.

Click here to download!

This is how the interface looks like.

Hope It Helped!
Prashant Dixit

Posted in Uncategorized | Tagged: , , , | 17 Comments »

10053 Trace Viewer : A life savior when handling colossal optimizer traces

Posted by FatDBA on October 18, 2021

Hi Everyone,

I am sure that my last post about 10053 debug traces has sparked some interest in optimizer cost calculations and estimations 🙂 As you guys are familiar that these traces aren’t that easy to digest and interpret, as they are pretty complicated, a humongous pile of internal cryptic information’s. One of the reader asked – If there are any tool that can help to at least format the trace and its sections ? Yes, there are few and one of my favorite is the 10053 viewer, and is what I am using from last few years now (lucky that I found that great blog post by Jonathan Lewis).

Click here if want to download it!

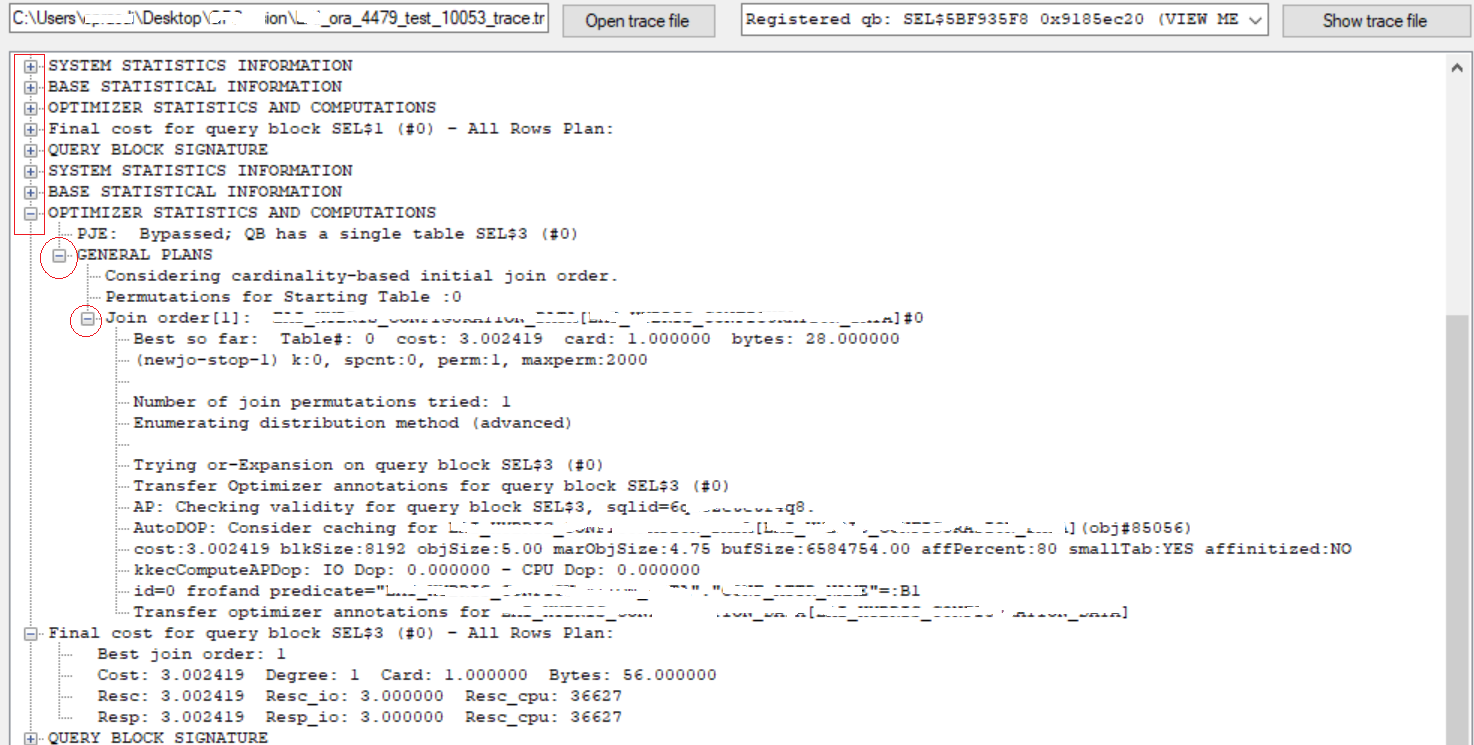
The tool is pretty easy to use! You have to click on ‘open trace file’ button and browse the 10053 trace from the system and click on ‘show trace file’ (next button).

Now load the trace file.

Now you’ll have a drop down view to select from. Once the trace is loaded, you can access sections by using ‘+’ to expand and ‘‘-‘ to minimize the section.

Expand to get more details about any particular section.

Hope It Helped!
Prashant Dixit

Posted in Uncategorized | Tagged: , , , | Leave a Comment »

Oracle event 10046 debug traces, they really aren’t that ‘complicated’ as we think – A 10046 trace break apart!

Posted by FatDBA on October 16, 2021

Hi Everyone,

Oracle has a long list of internal debug codes and this tracing is an art and a real craft. 10046 debug traces is one of the popular method for collecting extended SQL trace (like SQL_TRACE=TRUE) information for Oracle sessions. This we specially use to determine or distinguish the nature of a SQL Tuning problem. By setting this event, you can get detailed trace information of Oracle’s internal execution system analysis, call, wait, and bind variables, which plays a very important role in analyzing the performance of the system. This provides a great source and different levels of details about SQLs.

This post is all about breaking the parts of the trace and understand some of the critical sections to help understanding about SQL stats that it captures. I am not going to show how to generate them as the steps are pretty straight forward and are available on metalink.

Though there are multiple use cases of 10046, but I recently used them to understand a complicated and costly PL/SQL program which has got more than 1000 different SQL’s inside that it calls and I was interested to check on the costliest among them and why is that …. Though there are surely other ways to get the details of same level like using SQL Profiler, SQL Traces etc. but none of them provides the level of details what 10046 gives) and elapsed time parsing (prsela).

Above used snippet is from live 10046 sorted traces from a production system running on 10.2.0.5.0 (Yes, an old application). There isn’t much different that you will notice if you execute it on any new version of database too, there are very few changes that you will notice in case running on a latest oracle DB version. Okay let’s first understand few of the keywords or column names used in the result.

TKPROF: Release 10.2.0.5.0 - Production on Fri Sep 27 03:31:42 2021

Copyright (c) 1982, 2007, Oracle.  All rights reserved.

Trace file: dixitdb_ora_28282_10046_for_spdixitM.trc
Sort options: exeela  fchela  prsela  
********************************************************************************

SELECT COUNT(*) 
FROM
 CANONTALAB.DIXIT1_SAMPLE WHERE DIXIT1_SAMPLE_NO=:B1 


call     count       cpu    elapsed       disk      query    current        rows
------- ------  -------- ---------- ---------- ---------- ----------  ----------
Parse      134      0.00       0.00          0          0          0           0
Execute    862      0.03       0.03          0          0          0           0
Fetch      862     46.59      45.52          0    1235246          0         862
------- ------  -------- ---------- ---------- ---------- ----------  ----------
total     1858     46.63      45.55          0    1235246          0         862

Misses in library cache during parse: 1
Misses in library cache during execute: 1
Optimizer mode: ALL_ROWS
Parsing user id: 296  (CANONTALAB)   (recursive depth: 3)

Rows     Row Source Operation
-------  ---------------------------------------------------
      2  SORT AGGREGATE (cr=2866 pr=0 pw=0 time=114898 us)
      2   INDEX FAST FULL SCAN PK_DIXIT1_SAMPLE (cr=2866 pr=0 pw=0 time=114888 us)(object id 125001)


Rows     Execution Plan
-------  ---------------------------------------------------
      0  SELECT STATEMENT   MODE: ALL_ROWS
      2   SORT (AGGREGATE)
      2    INDEX   MODE: ANALYZED (UNIQUE SCAN) OF 'PK_DIXIT1_SAMPLE' 
               (INDEX (UNIQUE))

Elapsed times include waiting on following events:
  Event waited on                             Times   Max. Wait  Total Waited
  ----------------------------------------   Waited  ----------  ------------
  db file sequential read                        60       12.17         43.54
  
********************************************************************************

COUNT – Represents the umber of times a SQL statement was parsed, executed, or was fetched.
CPU – Total CPU time in seconds for all parse, execute, or fetch calls for the SQL.
ELAPSED – Total elapsed time in seconds for all parse, execute, or fetch calls for the SQL statement.
DISK – Total number of data blocks physically read from the datafiles on disk for all parse, execute, or fetch calls.
QUERY – Total number of buffers retrieved in consistent mode for all parse, execute, or fetch calls. Usually, buffers are retrieved in consistent mode for queries. A Consistent Get is where oracle returns a block from the block buffer cache but has to take into account checking to make sure it is the block current at the time the query started. Or is a normal reading of a block from the buffer cache. A check will be made if the data needs reconstructing from rollback info to give you a consistent view
CURRENT – Total number of buffers retrieved in current mode. Buffers are retrieved in current mode for statements such as INSERT, UPDATE, and DELETE. A DB block get (or current get in TKPROF) not only gets the block as it is right now, but it stops anyone else from getting that block (in current mode!) until we change it and release it. If someone else got there first, we wait.
ROWS – Total number of rows processed by the SQL statement. This total does not include rows processed by subqueries of the SQL statement. Also the rows gives statistics about 3 calls: Parse, Execute & Fetch
PARSE – Translates the SQL statement into an execution plan, including checks for proper security authorization and checks for the existence of tables, columns, and other referenced objects. This is where the physical and logical transformations and optimizations happens.
EXECUTE – Actual execution of the statement by Oracle. For INSERT, UPDATE, and DELETE statements, this modifies the data. For SELECT statements, this identifies the selected rows.
FETCH – Retrieves rows returned by a query. Fetches are only performed for SELECT statements.

Okay, now when all the column names and table entries are explained, let me try to explain what it represents in the form of those numbers.

It says 1235246 blocks were received in consistent mode during fetch operation. Since this is a SELECT statement, the blocks are shown during Fetch operation. If its a DML statement then blocks will be shown during Execute operation. Misses in library cache during each call. If there is no miss then it wont be mentioned. The 1 miss for the SQL is very much acceptable since when a SQL runs for the first time it need to be parsed and executed and execution plan will be stored. So parse and execute call will have 1 misses. If you see the statement parse call happened 134 times but the miss count is only 1, meaning that the statement was parsed only once and was stored in library cache. For next 133 parses the same parsed statement from library cache was used. So we have miss 1 and hit 133. Similarly execution plan was made only once and 861 times Oracle used same execution plan from library cache.

Now next jump to the row source operations and codes that it uses. cr = Consistent Reads, pr = Physical Reads, pw = Physical Writes, time = time taken by this step in microseconds. You might see some other codes used i.e. cost = cost incured by the step, size = represent the size of data in that step and card = cardinality.

So, the query was found doing an UNIQUE SCAN on it’s primary key index with name PK_DIXIT1_SAMPLE in ALL_ROWS mode and which is pretty understood as an equality predicate was used and the unique or primary key constraint was sufficient by itself to produce an index unique scan. And finally it shows wait event details and is pretty straight forward and says that it waits on ‘db file sequential read‘ with max wait time of 12.17

With the values above we need make a decision to whether to tune the SQL or not. Unless we have a locking problem or bad performing SQLs we shouldn’t worry about CPU time or the elapsed time. because timings come into consideration only when we have bad performing SQLs. The important factor is the number of block visits, both query (that is, subject to read consistency) and current (that is, not subject to read consistency). Segment headers and blocks that are going to be updated are acquired in current mode, but all query and subquery processing requests the data in query mode.

Hope It Helped
Prashant Dixit

Posted in Uncategorized | Tagged: , , , | 4 Comments »

A ‘simple’ dissection of an optimizer decision and cost using Oracle 10053 trace event … Yes, it’s simple!

Posted by FatDBA on October 10, 2021

Hi Guys,

In today’s post I will try to explain the cost, stats (system & object level), join order, cardinality & the selectivity calculations about execution plan entries and will take help of the infamous 10053 optimizer traces. Though 10053 is notoriously complicated, detailed and extensive even for simple SQL statements but always has the wealth of information about optimizer decisions like plan directives, peeked bind values, predicate move around, Join elimination stats, query transformations, fix controls, join eliminations, join orders (easily complicated) & other computations or calculations. So, I will try to keep it as simple as I can.

About ways of generating the report, you can access it via ALTER SESSION, ORADEBUG or even through DBMS_SQLDIAG.DUMP_TRACE (does not require diagnostic pack). There are multiple use cases of using 10053, but the most common is when you want to compare any best or worst plans and you want to see the difference in cost calculations.

Alright, so this is the complete SQL statement followed up by its execution plan and predicate details.

SELECT * FROM (SELECT n.object_inst_id, n.name, n.type, rownum idx
FROM testsch.PDI_FBI_HASHAH1 n join testsch.PDI_FBI_HASHAH1_b on  TESTID_name = :"SYS_B_00"  and owning_object_id = n.object_inst_id
and n.name = NVL(null, n.name) AND n.status = NVL(:"SYS_B_01", :"SYS_B_02")
AND n.type = NVL(:"SYS_B_03", n.type) AND NVL(n.test_allocation,:"SYS_B_04") = NVL(NVL(null, n.test_allocation),:"SYS_B_05")
AND  NVL(n.number_usage, :"SYS_B_06")=:"SYS_B_07" AND ( n.owner IS NULL OR instr(lower(n.owner), :"SYS_B_08") > :"SYS_B_09" )
AND n.assigned_csn_id IS NULL AND n.locked_on IS NULL AND n.lock_owner IS NULL
AND (n.lock_id IS NULL OR n.LOCK_DATE <= (sysdate - NVL(n.lock_period,
(SELECT dixi_trait_values FROM testsch.PDI_HASHIS_MERGEDINFO_DATA WHERE HASH_BATTR_SHA = :"SYS_B_10")) / :"SYS_B_11" / :"SYS_B_12"))
AND target_object_id = :"SYS_B_13" ORDER BY TO_NUMBER(n.name)) OUTPUTS WHERE OUTPUTS.idx between :"SYS_B_14" and :"SYS_B_15"


----------------------------------------------------------------------------------------------------------------
| Id  | Operation                      | Name                          | Rows  | Bytes | Cost (%CPU)| Time     |
----------------------------------------------------------------------------------------------------------------
|   0 | SELECT STATEMENT               |                               |     2 |   364 |   107   (0)| 00:00:01 |
|*  1 |  VIEW                          |                               |     2 |   364 |   107   (0)| 00:00:01 |
|   2 |   COUNT                        |                               |       |       |            |          |
|   3 |    NESTED LOOPS                |                               |     2 |   340 |   107   (0)| 00:00:01 |
|*  4 |     TABLE ACCESS BY INDEX ROWID| PDI_FBI_HASHAH1               |  6719 |   505K|   106   (0)| 00:00:01 |
|*  5 |      INDEX FULL SCAN           | PDI_FBI_NNAME_UTYPE_STA_NPFIX |  3065 |       |     7   (0)| 00:00:01 |
|*  6 |      TABLE ACCESS FULL         | PDI_HASHIS_MERGEDINFO_DATA    |     1 |    28 |     3   (0)| 00:00:01 | --> How the CBO decided cost 3 ? 
|*  7 |     INDEX RANGE SCAN           | IDX_TRNNUMBERB_SMOKE          |     1 |    93 |     1   (0)| 00:00:01 |
----------------------------------------------------------------------------------------------------------------


Predicate Information (identified by operation id):
---------------------------------------------------
   1 - filter("OUTPUTS"."IDX"<=10 AND "OUTPUTS"."IDX">=1)
   4 - filter("N"."TYPE"='MOBILE' AND ("N"."OWNER" IS NULL OR INSTR(LOWER("N"."OWNER"),'dna oyj')>0)
              AND NVL("N"."NUMBER_USAGE",'External')='Internal' AND "N"."ASSIGNED_CSN_ID" IS NULL AND
              NVL("N"."TEST_ALLOCATION",'EAI')=NVL(NVL(NULL,"N"."TEST_ALLOCATION"),'EAI') AND "N"."LOCKED_ON" IS NULL
              AND "N"."LOCK_OWNER" IS NULL AND ("N"."LOCK_ID" IS NULL OR
              "N"."LOCK_DATE"<=SYSDATE@!-NVL("N"."LOCK_PERIOD", (SELECT "DIXI_TRAIT_VALUES" FROM
              "TESTSCH"."PDI_HASHIS_MERGEDINFO_DATA" "PDI_HASHIS_MERGEDINFO_DATA" WHERE
              "HASH_BATTR_SHA"='MY_CALL_DURATION'))/60/24))
   5 - access("N"."STATUS"='Available')
       filter("N"."STATUS"='Available')
   6 - filter("HASH_BATTR_SHA"='MY_CALL_DURATION')
   7 - access("TESTID_NAME"='ind.fatdba.application.dss.more.production.BESTID.PDINumberBestSubClass'
               AND "OWNING_OBJECT_ID"="N"."OBJECT_INST_ID" AND "TARGET_OBJECT_ID"=21)

Let’s try to understand how optimizer come up with the cost numbers, how it derives these values, on what basis and what all it considers during the calculations. I will explaining about one of the access operation at Line ID 6 of the plan where it’s doing a TABLE ACCESS FULL on table PDI_HASHIS_MERGEDINFO_DATA and has a final cost of 3 associated with it.

So, what it is ? what all was happened under the hood by the optimizer to get this value of 3 for this operation ?

This is the subquery for which we will be checking the cost calculations within 10053 trace files.

(SELECT dixi_trait_values FROM testsch.PDI_HASHIS_MERGEDINFO_DATA WHERE HASH_BATTR_SHA = :"SYS_B_10")) / :"SYS_B_11" / :"SYS_B_12"))

Let me replace the sys generated values with their original values, for this I will be checking under “Peeked values of the binds in SQL statement” section. The same you can get from ‘predicate information’ section of the execution plan too, but let’s stick to 10053 for the moment.

*******************************************
Peeked values of the binds in SQL statement
*******************************************
----- Bind Info (kkscoacd) -----
 Bind#0
  oacdty=01 mxl=128(73) mxlc=00 mal=00 scl=00 pre=00
  oacflg=10 fl2=0100 frm=01 csi=873 siz=128 off=0
  kxsbbbfp=7f3791745ee0  bln=128  avl=73  flg=09
  value="ind.fatdba.application.dss.more.production.BESTID.PDINumberBestSubClass"
...
......
........

 Bind#10
  oacdty=01 mxl=32(19) mxlc=00 mal=00 scl=00 pre=00
  oacflg=10 fl2=0100 frm=01 csi=873 siz=32 off=0
  kxsbbbfp=7f3791745d48  bln=32  avl=19  flg=09
  value="MY_CALL_DURATION"
 Bind#11
  oacdty=02 mxl=22(02) mxlc=00 mal=00 scl=00 pre=00
  oacflg=10 fl2=0100 frm=00 csi=00 siz=24 off=0
  kxsbbbfp=7f3791745d20  bln=22  avl=02  flg=09
  value=60
 Bind#12
  oacdty=02 mxl=22(02) mxlc=00 mal=00 scl=00 pre=00
  oacflg=10 fl2=0100 frm=00 csi=00 siz=24 off=0
  kxsbbbfp=7f3791745cf8  bln=22  avl=02  flg=09
  value=24

Okay, let’s place them in the subquery.

SELECT dixi_trait_values FROM testsch.PDI_HASHIS_MERGEDINFO_DATA WHERE HASH_BATTR_SHA='MY_CALL_DURATION/60/24';

These are the contents of the column.

SQL> SELECT dixi_trait_values FROM testsch.PDI_HASHIS_MERGEDINFO_DATA;

DIXI_TRAIT_VALUES
-----------------
             60
            120
            200
             10
             60

Let’s check for access path analysis for this SQL.

***************************************
BASE STATISTICAL INFORMATION
***********************
Table Stats::
  Table: PDI_HASHIS_MERGEDINFO_DATA  Alias: PDI_HASHIS_MERGEDINFO_DATA
  #Rows: 5  SSZ: 0  LGR: 0  #Blks:  5  AvgRowLen:  31.00  NEB: 0  ChainCnt:  0.00  SPC: 0  RFL: 0  RNF: 0  CBK: 0  CHR: 0  KQDFLG: 1
  #IMCUs: 0  IMCRowCnt: 0  IMCJournalRowCnt: 0  #IMCBlocks: 0  IMCQuotient: 0.000000
try to generate single-table filter predicates from ORs for query block SEL$3 (#0)
finally: "PDI_HASHIS_MERGEDINFO_DATA"."DIXI_TRAIT_VALUES"=:B1

=======================================
SPD: BEGIN context at query block level
=======================================
Query Block SEL$3 (#0)
Applicable DS directives:
Return code in qosdSetupDirCtx4QB: NODIR
=====================================
SPD: END context at query block level
=====================================
Access path analysis for PDI_HASHIS_MERGEDINFO_DATA
***************************************
SINGLE TABLE ACCESS PATH 
  Single Table Cardinality Estimation for PDI_HASHIS_MERGEDINFO_DATA[PDI_HASHIS_MERGEDINFO_DATA] 
  SPD: Return code in qosdDSDirSetup: NOQBCTX, estType = TABLE
  Column (#1): CONF_ATTR_NAME(VARCHAR2)
    AvgLen: 24 NDV: 5 Nulls: 0 Density: 0.200000
  Table: PDI_HASHIS_MERGEDINFO_DATA  Alias: PDI_HASHIS_MERGEDINFO_DATA
    Card: Original: 5.000000  Rounded: 1  Computed: 1.000000  Non Adjusted: 1.000000
  Scan IO  Cost (Disk) =   3.000000
  Scan CPU Cost (Disk) =   36377.200000
  Total Scan IO  Cost  =   3.000000 (scan (Disk))
                         + 0.000000 (io filter eval) (= 0.000000 (per row) * 5.000000 (#rows))
                       =   3.000000
  Total Scan CPU  Cost =   36377.200000 (scan (Disk))
                         + 250.000000 (cpu filter eval) (= 50.000000 (per row) * 5.000000 (#rows))
                       =   36627.200000
  Access Path: TableScan
    Cost:  3.002419  Resp: 3.002419  Degree: 0
      Cost_io: 3.000000  Cost_cpu: 36627
      Resp_io: 3.000000  Resp_cpu: 36627
  Best:: AccessPath: TableScan
         Cost: 3.002419  Degree: 1  Resp: 3.002419  Card: 1.000000  Bytes: 0.000000

.....
.......

OPTIMIZER STATISTICS AND COMPUTATIONS
PJE:  Bypassed; QB has a single table SEL$3 (#0)
***************************************
GENERAL PLANS
***************************************
Considering cardinality-based initial join order.
Permutations for Starting Table :0
Join order[1]:  PDI_HASHIS_MERGEDINFO_DATA[PDI_HASHIS_MERGEDINFO_DATA]#0
***********************
Best so far:  Table#: 0  cost: 3.002419  card: 1.000000  bytes: 28.000000
***********************

If you check above you will see it considers the CPU & IO to generate the final cost values and that’s what we already know. Cost is the amount of work the optimizer estimates to run your query via a specific plan. The optimizer generally prefers lower cost plans. The optimizer’s cost model accounts for the IO, CPU, and network resources that will be used by the query.
IO_COST: I/O cost of the operation as estimated by the query optimizer’s approach. The value of this column is proportional to the number of data blocks read by the operation. For statements that use the rule-based approach, this column is null.
CPU_COST: CPU cost of the operation as estimated by the query optimizer’s approach. The value of this column is proportional to the number of machine cycles required for the operation. For statements that use the rule-based approach, this column is null.

At the same time it checks for dictionary stats to get table level information i.e. average row lenght, blocks, total rows and takes help of metrics NDV (nuber of distinct values), nulls, density of rows etc. to calculate the original cardinality of 5 (number of distinct entries) and the rounded cardinality of 1 – this SQL has resulted only into 1 row as an output, hence 1 is the rounded cardinality.

So, the main elements are ‘Scan IO Cost (Disk)’, ‘Scan CPU Cost (Disk)’ which finally derives the ‘Total Scan IO Cost’ value of 3.

That’s how the optimizer has calculated this value of 3 for this specific access operation, similarly you understand any of the other access entries in plan, and their associated costs.

If you want to read more on 10053 traces, I recommend you a great article by Wolfgang Breitling, Jonathan Lewis (his book cost-based Oracle fundamentals) & few posts from Maria Colgan.

Hope It Helped
Prashant Dixit

Posted in Uncategorized | Tagged: , | 1 Comment »

Migrated to RAC and getting ‘row cache locks’ or ‘enq: SQ – contention’ ?

Posted by FatDBA on September 24, 2021

Hi Everyone,

Recently I was working on a performance issue where customer reported frequent slowness and hang issues with their newly migrated 12.2 2-Node RAC cluster. I was involved at the time when issue was already gone and now I had to dig out the data the history either from AWR or via DBA_HIST_XX views. I started glancing over AWR reports for the probe period (~ 2 hours). I saw especially node 1 was swamped with excessive ‘row cache lock’ wait events, and that’s too with very high average wait time of 7973.47 ms (~ 8 seconds per wait). Though similar waits were found happening on instance 2, but quite less as compared to node1 (take a look at the AWR snip below)

You can also see ‘enq: SQ – contention’ in place of ‘row cache locks’ as this got renamed.

Below is the snippet from AWR that states it spend ~ 99% of DB Time% on sequence loading.

While checking ‘enqueue stats’ I saw ‘SQ-Sequence Cache’ type enqueues with very high overall wait period of 545 seconds (~ 9 minutes).

Next target was to find out the source SQL or the statements waiting on these row cache lock waits. And as expected, it was a SQL that interacts with the sequence to generate the NEXTVAL and feed that information to another statements that inserts records to a frequently accessed application log table. You can think of that statement something like below …

-- Generating next available value from the sequence
SELECT TEST_SEQ.NEXTVAL FROM DUAL; 

And source being a sequence, I thought of generating the DDL to see all its options or properties. And as expected, this sequence has NOCACHE option because this was recently upgraded from a standalone 12.1 database to a new 12.2 2-Node RAC cluster. The main reason for specifying NOCACHE earlier was to avoid gaps in sequence number as the value is not lost when the instance abnormally terminates.

CREATE SEQUENCE  "DIXIT"."TEST_SEQ"  MINVALUE 1 MAXVALUE 9999999999999999999999999999 INCREMENT BY 1 START WITH 1673163 NOCACHE  NOORDER  NOCYCLE  NOKEEP  NOSCALE  GLOBAL ;

And we complety missed to modify sequences as per the best practice of having CACHE + NOORDER combination in case of RAC. With this combo, each instances caches a distinct set of numbers in the shared pool & Sequences will not be globally ordered.

When caching is used, then the dictionary cache (the row cache) is updated only once with the new high watermark, e.g. when a caching of 20 is used and a nextval is requested the first time, then the row cache value of the sequence is changed in the dictionary cache and increased by 20. The LAST_NUMBER of the DBA_SEQUENCES get increased with the cache value or 20. The extracted 20 values, stored in the shared pool, will be distributed to the sessions requesting the nextval of it.

When no caching is used, then the dictionary cache has to be updated for any nextval request. It means the row cache has to be locked and updated with a nextval request. Multiple sessions requesting a nextval will hence be blocked on a ‘row cache lock’ wait. Each instance allocates numbers by access to the database but cache fusion may delay sending current seq$ block to a requesting instance if the block is busy owing to many sequence number allocations from the instance owning the current block image.

But there is a caveat when you use CACHE option and that is that the gaps in the sequence numbering occur when the sequence cache is lost e.g. any shared pool flush or instance shutdown like an single instance databases. When the sequence caching is used and the cached values are flushed from the shared pool. The same happen in RAC as in single instance databases. Any flush on any shared pool is enough to invalidate the cache value on RAC systems. And I don’t see any problem having a gap in the sequence, if not using a banking application.

Let me explain it through an example ..

-- Will create a sequence, default is to cache 20 sequence values in memory.

SQL> create sequence mytest_seq start with 1 increment by 1;

Sequence created.

SQL> select mytest_seq.nextval from dual;

  NEXTVAL
----------

         1

SQL> select mytest_seq.nextval from dual;

  NEXTVAL
----------

         2


-- The database is terminated and after startup, the next value of the sequence is selected.


SQL> select mytest_seq.nextval from dual;

  NEXTVAL
----------

        21

-- The first 20 values were in the cache, but only the first two were actually used. 
-- When the instance got terminated, sequence values 3 through 20 were lost as they were in cache. 

So, we decided to use caching, considering the average modifications and sequence generation requests to the main table, we planned to go with 500 sequence to be cached that Oracle will pre-allocate and keep in the memory for faster access.

ALTER SEQUENCE TEST_SEQ cache 500; 

And yup, the issue got fixed as soon we made sufficient sequences numbers available in the cache and no more ‘row cache lock’ waits afterwards.

Hope It Helped!
Prashant Dixit

Posted in Uncategorized | Tagged: , , | 2 Comments »

Are you suffering from excessive ‘cursor: mutex X’ & ‘cursor: mutex S’ waits after the upgrade ?

Posted by FatDBA on September 15, 2021

Hi Everyone,

Recently, I was contacted by one of my friend who was battling with some performance issues, since they moved from 12c to 19c. He was mostly strained about a particular problem with the new 19c database where he was getting excessive concurrency classed waits of “cursor: mutex X” (> 92% of the DB Time) and some “cursor: mutex S” events in the database. This was leading to frequent database hang instances.

As per the above snippet from AWR report for the period, ‘cursor: mutex X’ was consuming more than 170 ms per wait or an average wait time and was responsible for more than 91% of the total DB Time consumption.

Initially I though it was a case of classic hard parsing issue, as Cursor: mutex S wait usually occurs when Oracle is serializing parsing of multiple SQL statements. I mean there must be SQLs which are going through excessive hard parsing and has too many child cursors in the library cache. So, I immediately checked section ‘SQL Ordered by Version Count’ and saw one individual statement was there with 7,201 versions or Childs within a period of 2 hours.

Same was confirmed through ASH report too (see below pasted snippet). This particular SELECT statement was waiting on both on these two concurrency classed events specific to library cache.

I further drilled down on this issue to identify the cause behind this problem by querying V$SQL_SHARED_CURSOR (for reasons) to know why a particular child cursor was not shared with existing child cursors, and I was getting BIND_EQUIV_FAILURE as a reason. The database has the ACS(Adaptive Cursor Sharing) and CFB(Cardinality Feedback) enabled and seemed a ‘cursor leak’ issue.

I also noted huge sleeps for CP type mutexes on functions kkscsAddChildNode & kkscsPruneChild, below is the snippet from AWR, take a look at the first two in red.

And when I was about to prepare the strategy (i.e. specific plan purges etc.) to handle the situation, I thought to generate the hang analyze to identify if there are any known/familiar hang chains within stack traces. And I saw most of the chains running the same cursor from different processes waiting on ‘cursor: mutex X’ with below error stack … I mean there were multiple unique sessions waiting for a parent cursor mutex in exclusive mode on the same cursor under the following stack.

<-kgxExclusive<-kkscsAddChildNode<-kxscod<-kkscsCompareBinds<-kkscscid_bnd_eval<-kkscsCheckCriteria<-kkscsCheckCursor<-kkscsSearchChildList<-kksfbc<-

So, we had an error stack showing wait chains running the same cursor from different processes waiting on ‘cursor: mutex X’ and with BIND_EQUIV_FAILURE=Y in V$SQL_SHARED_CURSOR and CFB & ACS enabled, it was appearing that this was happening due to some bug.

Oracle support confirmed my doubt. They affirmed that this was happening all due to two unpublished bugs 28889389 and 28794230. For first one we need to apply patch 28889389, which has the optimized code for cursor mutex while searching the parent cursor for the match, for second one 28794230, they recommended few alternatives .given below …

_optimizer_use_feedback=false
_optimizer_adaptive_cursor_sharing=false
_optimizer_extended_cursor_sharing_rel=none

But even after setting above three undocumented parameters, which is to disable cardinality feedback and adaptive & extended cursor sharing, we only saw ~30% reduction in total waits. Later on they recommended us to apply the optimizer related bug fix control

_fix_control='23596611:OFF

and that completely resolved the issue.

Hope It Helped!
Prashant Dixit

Posted in Uncategorized | Tagged: , , , | Leave a Comment »

How to simulate the deadly, infamous, misunderstood & complex ‘Transaction Wraparound Problem’ in PostgreSQL …

Posted by FatDBA on July 20, 2021

Hi Guys,

Last week one of my good friend asked me an interesting question – ‘How to replicate the transaction wraparound problem’ in PostgreSQL ?

He has a demo/POC that he needs to do for one of his customer who is interested to see how it looks like in reality and how ‘deadly’ is the problem and how to fix this. He scanned almost everything on the Google, but unfortunately found nothing available or pre-cooked …

So, this might be the only post available on the internet explaining how to exactly simulate the transaction wraparound in the PostgreSQL Database. This one was really interesting and I have never tried this before as I thought I will never see transaction ID wraparound error 🙂 . So, before I jump in to the demo, we need to take care of few things. Use a system with good resources, I have performed this demo on an EDB PostgreSQL 11.11.20 database with 8 CPUs, 31 GB RAM, and it took me around 9 hours to exhaust all transactionIDs and reach the limit of 2,000,000,000.

Would like to thank Nikolay Samokhvalov for his help! 🙂

Before I start, let’s do this one more time – What is a transaction ID and why it wrapsaround ?
The PostgreSQL transaction control mechanism assigns a transaction ID to every row that is modified in the database; these IDs control the visibility of that row to other concurrent transactions. Txid wraparound is a problem due to MVCC. MVCC relies on being able to take the txids of two transactions and determine which of the transactions came first.
A PostgreSQL database can have two billion ‘in-flight’ unvacuumed transactions before PostgreSQL takes dramatic action to avoid data loss. If the number of unvacuumed transactions reaches (2^31 – 10,000,000), the log starts warning that vacuuming is needed. If the number of unvacuumed transactions reaches 2,000,000,000, PostgreSQL sets the database to read-only mode and requires an offline, single-user, standalone vacuum.

Note: You have to carefully monitor your database pg_log, archiving locations as this activity will generate huge WALs. At the same time, keep an eye on the size of your log directory, specially if you are capturing all statements.

We will open multiple parallel sessions to simulate the workload and monitor the progress.

SESSION 1:

In the first session, we will first connect with the database and set idle_in_transaction_session_timeout to value 0 and start a BEGIN block and execute select txid_current(); this is to block autovacuum, as simply turning it off wouldn’t help because emegency mode kick in even with `autovacuum = off.

The idle_in_transaction_session_timeout parameter terminate any session with an open transaction that has been idle for longer than the specified duration in milliseconds. This allows any locks held by that session to be released and the connection slot to be reused; it also allows tuples visible only to this transaction to be vacuumed. So, we will have to set it to value 0 that will disable this feature.

-bash-4.2$ psql -p 5444
psql.bin (11.11.20)
Type "help" for help.

enterprisedb=# SET idle_in_transaction_session_timeout = 0;
SET
enterprisedb=#  BEGIN;
BEGIN
enterprisedb=# select txid_current();
 txid_current
--------------
         1266

enterprisedb=#
enterprisedb=#

SESSION 2:

Now, I will create a file with current transaction ID written in to it and will call the pgbench. I am doing something like below to call pgbench, below are the explanations on flags used and why I used them ..

pgbench -U enterprisedb enterprisedb -f wl.sql -c8 -j8 -T100000 -rn -P60

-f: to read from a file
-c8: 8 clients
-j8: 8 threads/jobs (adjust it as per your CPU count)
-T100000: seconds to run the test for this many seconds, rather than a fixed number of transactions per client
-rn: where r is to report the average per-statement latency (execution time from the perspective of the client) of each command after the benchmark finishes. Whereas n is to perform no vacuuming before running the test. This option is necessary if you are running a custom test scenario that does not include the standard tables pgbench_accounts, pgbench_branches, pgbench_history, and pgbench_tellers.
-P60: is to show progress report every sec seconds

-bash-4.2$ 
-bash-4.2$ echo 'select txid_current();' > wl.sql
-bash-4.2$ 
-bash-4.2$
-bash-4.2$ /usr/edb/as11/bin/pgbench -U enterprisedb enterprisedb -f wl.sql -c8 -j8 -T100000 -rn -P60
progress: 60.0 s, 51097.6 tps, lat 0.157 ms stddev 0.262
progress: 120.0 s, 51171.1 tps, lat 0.156 ms stddev 0.252
progress: 180.0 s, 51622.8 tps, lat 0.155 ms stddev 0.250
progress: 240.0 s, 51328.9 tps, lat 0.156 ms stddev 0.260
progress: 300.0 s, 50976.6 tps, lat 0.157 ms stddev 0.256
progress: 360.0 s, 51130.3 tps, lat 0.156 ms stddev 0.265
progress: 420.0 s, 50792.6 tps, lat 0.158 ms stddev 0.254
progress: 480.0 s, 51207.2 tps, lat 0.156 ms stddev 0.250
progress: 540.0 s, 51162.6 tps, lat 0.156 ms stddev 0.251
progress: 600.0 s, 51246.0 tps, lat 0.156 ms stddev 0.256
progress: 660.0 s, 51047.3 tps, lat 0.157 ms stddev 0.253
progress: 720.0 s, 51197.3 tps, lat 0.156 ms stddev 0.252
progress: 780.0 s, 51119.2 tps, lat 0.156 ms stddev 0.281
progress: 840.0 s, 50938.8 tps, lat 0.157 ms stddev 0.252
progress: 900.0 s, 51252.8 tps, lat 0.156 ms stddev 0.251
progress: 960.0 s, 51054.0 tps, lat 0.157 ms stddev 0.253
progress: 1020.0 s, 51159.5 tps, lat 0.156 ms stddev 0.254
progress: 1080.0 s, 51116.0 tps, lat 0.157 ms stddev 0.253
progress: 1140.0 s, 50947.6 tps, lat 0.157 ms stddev 0.251
progress: 1200.0 s, 51289.7 tps, lat 0.156 ms stddev 0.254
progress: 1260.0 s, 50338.7 tps, lat 0.159 ms stddev 0.254
progress: 1320.0 s, 50121.1 tps, lat 0.160 ms stddev 0.260
progress: 1380.0 s, 49936.6 tps, lat 0.160 ms stddev 0.291
progress: 1440.0 s, 50451.1 tps, lat 0.159 ms stddev 0.251
progress: 1500.0 s, 51107.4 tps, lat 0.157 ms stddev 0.248
progress: 1560.0 s, 50907.8 tps, lat 0.157 ms stddev 0.321
progress: 1620.0 s, 51033.7 tps, lat 0.157 ms stddev 0.251
progress: 1680.0 s, 51013.6 tps, lat 0.157 ms stddev 0.254
progress: 1740.0 s, 51119.4 tps, lat 0.156 ms stddev 0.252
progress: 1800.0 s, 51411.9 tps, lat 0.156 ms stddev 0.249
progress: 1860.0 s, 51099.1 tps, lat 0.157 ms stddev 0.249
progress: 1920.0 s, 51527.5 tps, lat 0.155 ms stddev 0.256
progress: 1980.0 s, 51204.3 tps, lat 0.156 ms stddev 0.267
progress: 2040.0 s, 51363.8 tps, lat 0.156 ms stddev 0.249
progress: 2100.0 s, 51563.1 tps, lat 0.155 ms stddev 0.250
progress: 2160.0 s, 51329.3 tps, lat 0.156 ms stddev 0.246
progress: 2220.0 s, 51073.4 tps, lat 0.157 ms stddev 0.276
progress: 2280.0 s, 51402.0 tps, lat 0.156 ms stddev 0.248
progress: 2340.0 s, 51364.4 tps, lat 0.156 ms stddev 0.253
progress: 2400.0 s, 50890.0 tps, lat 0.157 ms stddev 0.251
progress: 2460.0 s, 50239.6 tps, lat 0.159 ms stddev 0.296
progress: 2520.0 s, 50684.8 tps, lat 0.158 ms stddev 0.283
progress: 2580.0 s, 49826.2 tps, lat 0.161 ms stddev 0.271
progress: 2640.0 s, 51076.7 tps, lat 0.157 ms stddev 0.250
progress: 2700.0 s, 51349.6 tps, lat 0.156 ms stddev 0.252
progress: 2760.0 s, 51076.6 tps, lat 0.157 ms stddev 0.253
progress: 2820.0 s, 50854.5 tps, lat 0.157 ms stddev 0.256
progress: 2880.0 s, 49864.8 tps, lat 0.160 ms stddev 0.260
progress: 2940.0 s, 50450.1 tps, lat 0.159 ms stddev 0.264
progress: 3000.0 s, 50334.7 tps, lat 0.159 ms stddev 0.264
progress: 3060.0 s, 50514.3 tps, lat 0.158 ms stddev 0.299
progress: 3120.0 s, 50508.7 tps, lat 0.158 ms stddev 0.284
progress: 3180.0 s, 50691.3 tps, lat 0.158 ms stddev 0.288
progress: 3240.0 s, 50601.6 tps, lat 0.158 ms stddev 0.256
progress: 3300.0 s, 50280.2 tps, lat 0.159 ms stddev 0.264
progress: 3360.0 s, 50457.6 tps, lat 0.159 ms stddev 0.265
progress: 3420.0 s, 50178.3 tps, lat 0.159 ms stddev 0.390
progress: 3480.0 s, 50353.3 tps, lat 0.159 ms stddev 0.264
progress: 3540.0 s, 50133.0 tps, lat 0.160 ms stddev 0.259
progress: 3600.0 s, 50217.6 tps, lat 0.159 ms stddev 0.282
progress: 3660.0 s, 50147.8 tps, lat 0.160 ms stddev 0.279
progress: 3720.0 s, 50578.0 tps, lat 0.158 ms stddev 0.261
progress: 3780.0 s, 50523.9 tps, lat 0.158 ms stddev 0.261
progress: 3840.0 s, 50349.7 tps, lat 0.159 ms stddev 0.269
progress: 3900.0 s, 50437.5 tps, lat 0.159 ms stddev 0.287
progress: 3960.0 s, 49569.1 tps, lat 0.161 ms stddev 0.311
progress: 4020.0 s, 50337.3 tps, lat 0.159 ms stddev 0.286
progress: 4080.0 s, 50065.2 tps, lat 0.160 ms stddev 0.260
progress: 4140.0 s, 49791.4 tps, lat 0.161 ms stddev 0.264
progress: 4200.0 s, 49681.3 tps, lat 0.161 ms stddev 0.326
progress: 4260.0 s, 48034.2 tps, lat 0.167 ms stddev 0.340
progress: 4320.0 s, 50460.9 tps, lat 0.159 ms stddev 0.290
progress: 4380.0 s, 49731.0 tps, lat 0.161 ms stddev 0.300
progress: 4440.0 s, 50441.1 tps, lat 0.159 ms stddev 0.266
progress: 4500.0 s, 50259.1 tps, lat 0.159 ms stddev 0.267
progress: 4560.0 s, 50197.0 tps, lat 0.159 ms stddev 0.259
progress: 4620.0 s, 49832.1 tps, lat 0.161 ms stddev 0.271
progress: 4680.0 s, 50160.3 tps, lat 0.159 ms stddev 0.268
progress: 4740.0 s, 50578.5 tps, lat 0.158 ms stddev 0.262
progress: 4800.0 s, 50260.5 tps, lat 0.159 ms stddev 0.270
progress: 4860.0 s, 50545.1 tps, lat 0.158 ms stddev 0.256
progress: 4920.0 s, 49961.8 tps, lat 0.160 ms stddev 0.285
progress: 4980.0 s, 50450.7 tps, lat 0.159 ms stddev 0.267
progress: 5040.0 s, 50008.7 tps, lat 0.160 ms stddev 0.257
progress: 5100.0 s, 49723.2 tps, lat 0.161 ms stddev 0.428
progress: 5160.0 s, 50211.1 tps, lat 0.159 ms stddev 0.378
progress: 5220.0 s, 49791.0 tps, lat 0.161 ms stddev 0.262
progress: 5280.0 s, 50091.5 tps, lat 0.160 ms stddev 0.265
progress: 5340.0 s, 50280.3 tps, lat 0.159 ms stddev 0.266
progress: 5400.0 s, 49957.1 tps, lat 0.160 ms stddev 0.402
progress: 5460.0 s, 50101.7 tps, lat 0.160 ms stddev 0.293
progress: 5520.0 s, 50387.3 tps, lat 0.159 ms stddev 0.261
progress: 5580.0 s, 50173.2 tps, lat 0.159 ms stddev 0.278
progress: 5640.0 s, 50225.1 tps, lat 0.159 ms stddev 0.266
progress: 5700.0 s, 50186.7 tps, lat 0.159 ms stddev 0.264
progress: 5760.0 s, 49120.1 tps, lat 0.163 ms stddev 0.264
progress: 5820.0 s, 49445.3 tps, lat 0.162 ms stddev 0.262
progress: 5880.0 s, 49547.2 tps, lat 0.161 ms stddev 0.260
progress: 5940.0 s, 49730.2 tps, lat 0.161 ms stddev 0.267
progress: 6000.0 s, 50543.3 tps, lat 0.158 ms stddev 0.258
progress: 6060.0 s, 50569.1 tps, lat 0.158 ms stddev 0.258
progress: 6120.0 s, 50560.4 tps, lat 0.158 ms stddev 0.250
progress: 6180.0 s, 50572.1 tps, lat 0.158 ms stddev 0.255
progress: 6240.0 s, 50551.6 tps, lat 0.158 ms stddev 0.253
progress: 6300.0 s, 50993.8 tps, lat 0.157 ms stddev 0.254
progress: 6360.0 s, 51114.6 tps, lat 0.157 ms stddev 0.257
progress: 6420.0 s, 50762.6 tps, lat 0.158 ms stddev 0.261
progress: 6480.0 s, 50814.2 tps, lat 0.157 ms stddev 0.250
progress: 6540.0 s, 50735.7 tps, lat 0.158 ms stddev 0.257
progress: 6600.0 s, 50521.9 tps, lat 0.158 ms stddev 0.263
progress: 6660.0 s, 50829.8 tps, lat 0.157 ms stddev 0.252
progress: 6720.0 s, 50933.7 tps, lat 0.157 ms stddev 0.255
progress: 6780.0 s, 51152.9 tps, lat 0.156 ms stddev 0.252
progress: 6840.0 s, 50457.1 tps, lat 0.159 ms stddev 0.255
progress: 6900.0 s, 50542.5 tps, lat 0.158 ms stddev 0.251
progress: 6960.0 s, 50802.5 tps, lat 0.157 ms stddev 0.282
progress: 7020.0 s, 51066.1 tps, lat 0.157 ms stddev 0.270
progress: 7080.0 s, 50729.0 tps, lat 0.158 ms stddev 0.258
progress: 7140.0 s, 51242.7 tps, lat 0.156 ms stddev 0.255
progress: 7200.0 s, 50714.2 tps, lat 0.158 ms stddev 0.253
progress: 7260.0 s, 50704.7 tps, lat 0.158 ms stddev 0.323
progress: 7320.0 s, 50951.4 tps, lat 0.157 ms stddev 0.250
progress: 7380.0 s, 50604.8 tps, lat 0.158 ms stddev 0.340
progress: 7440.0 s, 51217.0 tps, lat 0.156 ms stddev 0.251
progress: 7500.0 s, 50832.4 tps, lat 0.157 ms stddev 0.251
progress: 7560.0 s, 50815.7 tps, lat 0.157 ms stddev 0.256
progress: 7620.0 s, 49936.3 tps, lat 0.160 ms stddev 0.463
progress: 7680.0 s, 50556.4 tps, lat 0.158 ms stddev 0.251
progress: 7740.0 s, 50699.8 tps, lat 0.158 ms stddev 0.255
progress: 7800.0 s, 50474.0 tps, lat 0.158 ms stddev 0.256
progress: 7860.0 s, 50401.9 tps, lat 0.159 ms stddev 0.321
progress: 7920.0 s, 51385.5 tps, lat 0.156 ms stddev 0.251
progress: 7980.0 s, 50671.9 tps, lat 0.158 ms stddev 0.248
progress: 8040.0 s, 50631.3 tps, lat 0.158 ms stddev 0.252
progress: 8100.0 s, 50741.3 tps, lat 0.158 ms stddev 0.255
progress: 8160.0 s, 50465.5 tps, lat 0.159 ms stddev 0.257
progress: 8220.0 s, 51384.9 tps, lat 0.156 ms stddev 0.212
progress: 8280.0 s, 51676.8 tps, lat 0.155 ms stddev 0.233
progress: 8340.0 s, 52049.3 tps, lat 0.154 ms stddev 0.179
progress: 8400.0 s, 52394.6 tps, lat 0.153 ms stddev 0.178
progress: 8460.0 s, 51872.3 tps, lat 0.154 ms stddev 0.192
progress: 8520.0 s, 51896.9 tps, lat 0.154 ms stddev 0.178
progress: 8580.0 s, 52187.5 tps, lat 0.153 ms stddev 0.178
progress: 8640.0 s, 51773.8 tps, lat 0.155 ms stddev 0.185
progress: 8700.0 s, 51862.7 tps, lat 0.154 ms stddev 0.184
progress: 8760.0 s, 51906.7 tps, lat 0.154 ms stddev 0.189
progress: 8820.0 s, 52038.6 tps, lat 0.154 ms stddev 0.189
progress: 8880.0 s, 52370.9 tps, lat 0.153 ms stddev 0.180
progress: 8940.0 s, 52155.2 tps, lat 0.153 ms stddev 0.185
progress: 9000.0 s, 52162.2 tps, lat 0.153 ms stddev 0.219
progress: 9060.0 s, 51900.7 tps, lat 0.154 ms stddev 0.189
progress: 9120.0 s, 51794.5 tps, lat 0.154 ms stddev 0.178
progress: 9180.0 s, 51885.1 tps, lat 0.154 ms stddev 0.180
progress: 9240.0 s, 52007.4 tps, lat 0.154 ms stddev 0.177
progress: 9300.0 s, 52168.3 tps, lat 0.153 ms stddev 0.189
progress: 9360.0 s, 51801.3 tps, lat 0.154 ms stddev 0.182
progress: 9420.0 s, 51899.8 tps, lat 0.154 ms stddev 0.173
progress: 9480.0 s, 52215.3 tps, lat 0.153 ms stddev 0.177
progress: 9540.0 s, 52129.9 tps, lat 0.153 ms stddev 0.227
progress: 9600.0 s, 51929.9 tps, lat 0.154 ms stddev 0.176
progress: 9660.0 s, 51776.6 tps, lat 0.155 ms stddev 0.181
progress: 9720.0 s, 51542.8 tps, lat 0.155 ms stddev 0.268
progress: 9780.0 s, 51352.5 tps, lat 0.156 ms stddev 0.310
progress: 9840.0 s, 51661.0 tps, lat 0.155 ms stddev 0.177
progress: 9900.0 s, 51219.8 tps, lat 0.156 ms stddev 0.260
progress: 9960.0 s, 52235.8 tps, lat 0.153 ms stddev 0.184
progress: 10020.0 s, 51904.5 tps, lat 0.154 ms stddev 0.186
progress: 10080.0 s, 52066.8 tps, lat 0.154 ms stddev 0.183
progress: 10140.0 s, 52212.5 tps, lat 0.153 ms stddev 0.209
progress: 10200.0 s, 52402.8 tps, lat 0.153 ms stddev 0.186
progress: 10260.0 s, 52194.8 tps, lat 0.153 ms stddev 0.178
progress: 10320.0 s, 52117.3 tps, lat 0.153 ms stddev 0.179
progress: 10380.0 s, 52060.5 tps, lat 0.154 ms stddev 0.181
progress: 10440.0 s, 52043.1 tps, lat 0.154 ms stddev 0.183
progress: 10500.0 s, 52358.5 tps, lat 0.153 ms stddev 0.178
progress: 10560.0 s, 51361.2 tps, lat 0.156 ms stddev 0.179
progress: 10620.0 s, 51655.7 tps, lat 0.155 ms stddev 0.184
progress: 10680.0 s, 51501.1 tps, lat 0.155 ms stddev 0.176
progress: 10740.0 s, 51315.4 tps, lat 0.156 ms stddev 0.182
progress: 10800.0 s, 52344.5 tps, lat 0.153 ms stddev 0.181
progress: 10860.0 s, 51687.0 tps, lat 0.155 ms stddev 0.182
progress: 10920.0 s, 51150.2 tps, lat 0.156 ms stddev 0.179
progress: 10980.0 s, 51341.9 tps, lat 0.156 ms stddev 0.181
progress: 11040.0 s, 51074.0 tps, lat 0.157 ms stddev 0.184
progress: 11100.0 s, 51645.4 tps, lat 0.155 ms stddev 0.277
progress: 11160.0 s, 51984.6 tps, lat 0.154 ms stddev 0.182
progress: 11220.0 s, 51993.4 tps, lat 0.154 ms stddev 0.181
progress: 11280.0 s, 51894.9 tps, lat 0.154 ms stddev 0.183
progress: 11340.0 s, 52007.2 tps, lat 0.154 ms stddev 0.186
progress: 11400.0 s, 52255.9 tps, lat 0.153 ms stddev 0.188
progress: 11460.0 s, 52221.2 tps, lat 0.153 ms stddev 0.183
progress: 11520.0 s, 51990.5 tps, lat 0.154 ms stddev 0.181
progress: 11580.0 s, 52138.3 tps, lat 0.153 ms stddev 0.178
progress: 11640.0 s, 51258.2 tps, lat 0.156 ms stddev 0.178
progress: 11700.0 s, 52268.0 tps, lat 0.153 ms stddev 0.179
progress: 11760.0 s, 51838.4 tps, lat 0.154 ms stddev 0.180
progress: 11820.0 s, 52079.2 tps, lat 0.154 ms stddev 0.185
progress: 11880.0 s, 52531.4 tps, lat 0.152 ms stddev 0.175
progress: 11940.0 s, 51711.7 tps, lat 0.155 ms stddev 0.260
progress: 12000.0 s, 52020.7 tps, lat 0.154 ms stddev 0.180
progress: 12060.0 s, 51990.1 tps, lat 0.154 ms stddev 0.241
progress: 12120.0 s, 51367.6 tps, lat 0.156 ms stddev 0.193
progress: 12180.0 s, 51316.0 tps, lat 0.156 ms stddev 0.187
progress: 12240.0 s, 50819.0 tps, lat 0.157 ms stddev 0.190
progress: 12300.0 s, 51614.6 tps, lat 0.155 ms stddev 0.182
progress: 12360.0 s, 51500.6 tps, lat 0.155 ms stddev 0.187
progress: 12420.0 s, 51715.8 tps, lat 0.155 ms stddev 0.259
progress: 12480.0 s, 51805.0 tps, lat 0.154 ms stddev 0.183
progress: 12540.0 s, 51846.2 tps, lat 0.154 ms stddev 0.183
progress: 12600.0 s, 51829.6 tps, lat 0.154 ms stddev 0.179
progress: 12660.0 s, 51411.1 tps, lat 0.156 ms stddev 0.221
progress: 12720.0 s, 51728.5 tps, lat 0.155 ms stddev 0.187
progress: 12780.0 s, 52170.5 tps, lat 0.153 ms stddev 0.181
progress: 12840.0 s, 51985.8 tps, lat 0.154 ms stddev 0.182
progress: 12900.0 s, 51723.3 tps, lat 0.155 ms stddev 0.181
progress: 12960.0 s, 52324.2 tps, lat 0.153 ms stddev 0.184
progress: 13020.0 s, 51795.5 tps, lat 0.154 ms stddev 0.189
progress: 13080.0 s, 51547.3 tps, lat 0.155 ms stddev 0.373
progress: 13140.0 s, 51592.4 tps, lat 0.155 ms stddev 0.231
progress: 13200.0 s, 52004.8 tps, lat 0.154 ms stddev 0.223
progress: 13260.0 s, 52118.3 tps, lat 0.153 ms stddev 0.184
progress: 13320.0 s, 51781.1 tps, lat 0.154 ms stddev 0.183
progress: 13380.0 s, 50621.8 tps, lat 0.158 ms stddev 0.196
progress: 13440.0 s, 50671.8 tps, lat 0.158 ms stddev 0.321
progress: 13500.0 s, 51389.4 tps, lat 0.156 ms stddev 0.181
progress: 13560.0 s, 51653.2 tps, lat 0.155 ms stddev 0.186
progress: 13620.0 s, 51491.7 tps, lat 0.155 ms stddev 0.181
progress: 13680.0 s, 51639.4 tps, lat 0.155 ms stddev 0.183
progress: 13740.0 s, 51385.3 tps, lat 0.156 ms stddev 0.188
progress: 13800.0 s, 51640.2 tps, lat 0.155 ms stddev 0.177
progress: 13860.0 s, 51820.7 tps, lat 0.154 ms stddev 0.176
progress: 13920.0 s, 52041.9 tps, lat 0.154 ms stddev 0.179
progress: 13980.0 s, 52001.0 tps, lat 0.154 ms stddev 0.178
progress: 14040.0 s, 52189.3 tps, lat 0.153 ms stddev 0.176
progress: 14100.0 s, 51897.9 tps, lat 0.154 ms stddev 0.179
progress: 14160.0 s, 52066.4 tps, lat 0.154 ms stddev 0.180
progress: 14220.0 s, 52257.9 tps, lat 0.153 ms stddev 0.178
progress: 14280.0 s, 51850.1 tps, lat 0.154 ms stddev 0.210
......
.........
...........

SESSION 3:

Now in this third session we will monitor the database to see what’s going on. You can do something like below to check where we are going.

Below SQL will show you the ‘datfrozenxid‘ which is a value for all transaction IDs before this one have been replaced with a permanent (“frozen”) transaction ID in this database. This is used to track whether the database needs to be vacuumed in order to prevent transaction ID wraparound. And to see ‘autovacuum_freeze_max_age‘ that is age at which to autovacuum a table to prevent transaction ID wraparound.

Do a watch (\watch 10) on the command to see the progress and the play live 🙂

SELECT datname
    , age(datfrozenxid)
    , current_setting('autovacuum_freeze_max_age') 
FROM pg_database 
ORDER BY 2 DESC;


   datname    |   age   | current_setting
--------------+---------+-----------------
 postgres     | 3058531 | 200000000
 edb          | 3058531 | 200000000
 template1    | 3058531 | 200000000
 template0    | 3058531 | 200000000
 immortal     | 3058531 | 200000000
 darkthrone   | 3058531 | 200000000
 immortal1    | 3058531 | 200000000
 mayhem       | 3058531 | 200000000
 marduk       | 3058531 | 200000000
 burzum       | 3058531 | 200000000
 gorgoroth    | 3058531 | 200000000
 repmgr       | 3058531 | 200000000
 enterprisedb | 3058531 | 200000000
(13 rows)

I have used below query to check where we are going, current XIDs, how close we are to our target of wraparound ..

enterprisedb=# WITH max_age AS ( 
    SELECT 2000000000 as max_old_xid
        , setting AS autovacuum_freeze_max_age 
        FROM pg_catalog.pg_settings 
        WHERE name = 'autovacuum_freeze_max_age' )
, per_database_stats AS ( 
    SELECT datname
        , m.max_old_xid::int
        , m.autovacuum_freeze_max_age::int
        , age(d.datfrozenxid) AS oldest_current_xid 
    FROM pg_catalog.pg_database d 
    JOIN max_age m ON (true) 
    WHERE d.datallowconn ) 
SELECT max(oldest_current_xid) AS oldest_current_xid
    , max(ROUND(100*(oldest_current_xid/max_old_xid::float))) AS percent_towards_wraparound
    , max(ROUND(100*(oldest_current_xid/autovacuum_freeze_max_age::float))) AS percent_towards_emergency_autovac 
FROM per_database_stats


\watch 10

 oldest_current_xid | percent_towards_wraparound | percent_towards_emergency_autovac
--------------------+----------------------------+-----------------------------------
          289007513 |                         14 |                               145
(1 row)


 oldest_current_xid | percent_towards_wraparound | percent_towards_emergency_autovac
--------------------+----------------------------+-----------------------------------
          290077770 |                         15 |                               145
(1 row)


 oldest_current_xid | percent_towards_wraparound | percent_towards_emergency_autovac
--------------------+----------------------------+-----------------------------------
          292467983 |                         15 |                               146
(1 row)


                     Mon 19 Jul 2021 08:38:01 PM IST (every 10s)

 oldest_current_xid | percent_towards_wraparound | percent_towards_emergency_autovac
--------------------+----------------------------+-----------------------------------
          342714029 |                         17 |                               171
(1 row)

                     Mon 19 Jul 2021 08:38:11 PM IST (every 10s)

 oldest_current_xid | percent_towards_wraparound | percent_towards_emergency_autovac
--------------------+----------------------------+-----------------------------------
          343223530 |                         17 |                               172
(1 row)


                     Mon 19 Jul 2021 09:17:45 PM IST (every 10s)

 oldest_current_xid | percent_towards_wraparound | percent_towards_emergency_autovac
--------------------+----------------------------+-----------------------------------
          406185619 |                         20 |                               203
(1 row)


 oldest_current_xid | percent_towards_wraparound | percent_towards_emergency_autovac
--------------------+----------------------------+-----------------------------------
          421779698 |                         21 |                               211
(1 row)

                     Mon 19 Jul 2021 09:28:10 PM IST (every 10s)

 oldest_current_xid | percent_towards_wraparound | percent_towards_emergency_autovac
--------------------+----------------------------+-----------------------------------
          438446236 |                         22 |                               219
(1 row)


                     Mon 19 Jul 2021 11:03:03 PM IST (every 10s)

 oldest_current_xid | percent_towards_wraparound | percent_towards_emergency_autovac
--------------------+----------------------------+-----------------------------------
          733479765 |                         37 |                               367
(1 row)


 oldest_current_xid | percent_towards_wraparound | percent_towards_emergency_autovac
--------------------+----------------------------+-----------------------------------
          763852636 |                         38 |                               382
(1 row)


                     Mon 19 Jul 2021 11:33:03 PM IST (every 10s)

 oldest_current_xid | percent_towards_wraparound | percent_towards_emergency_autovac
--------------------+----------------------------+-----------------------------------
          826485794 |                         41 |                               413
(1 row)


                     Tue 20 Jul 2021 12:18:07 AM IST (every 10s)

 oldest_current_xid | percent_towards_wraparound | percent_towards_emergency_autovac
--------------------+----------------------------+-----------------------------------
          966692697 |                         48 |                               483
(1 row)


 oldest_current_xid | percent_towards_wraparound | percent_towards_emergency_autovac
--------------------+----------------------------+-----------------------------------
         1107823196 |                         55 |                               554
 

                     Tue 20 Jul 2021 01:09:18 AM IST (every 10s)

 oldest_current_xid | percent_towards_wraparound | percent_towards_emergency_autovac
--------------------+----------------------------+-----------------------------------
         1125393734 |                         56 |                               563
(1 row)


                     Tue 20 Jul 2021 01:43:11 AM IST (every 10s)

 oldest_current_xid | percent_towards_wraparound | percent_towards_emergency_autovac
--------------------+----------------------------+-----------------------------------
         1230984982 |                         62 |                               615
(1 row)


-- LETS SEE WHAT'S HAPPENING ON THE DATABASE 
enterprisedb=# \x
Expanded display is on.
enterprisedb=#
enterprisedb=# select * from pg_stat_activity;


-[ RECORD 4 ]----+---------------------------------
datid            | 16384
datname          | enterprisedb
pid              | 24056
usesysid         | 10
usename          | enterprisedb
application_name | psql.bin
client_addr      |
client_hostname  |
client_port      | -1
backend_start    | 20-JUL-21 09:45:44.833016 +05:30
xact_start       | 20-JUL-21 09:45:57.749892 +05:30
query_start      | 20-JUL-21 09:46:01.042977 +05:30
state_change     | 20-JUL-21 09:46:01.047161 +05:30
wait_event_type  | Client
wait_event       | ClientRead
state            | idle in transaction
backend_xid      | 1195
backend_xmin     |
query            | select txid_current();
backend_type     | client backend
-[ RECORD 5 ]----+---------------------------------
datid            | 16384
datname          | enterprisedb
pid              | 25884
usesysid         | 10
usename          | enterprisedb
application_name | psql.bin
client_addr      |
client_hostname  |
client_port      | -1
backend_start    | 20-JUL-21 09:47:36.766729 +05:30
xact_start       | 20-JUL-21 09:52:18.941776 +05:30
query_start      | 20-JUL-21 09:52:18.941776 +05:30
state_change     | 20-JUL-21 09:52:18.941778 +05:30
wait_event_type  |
wait_event       |
state            | active
backend_xid      |
backend_xmin     | 1195
query            | select * from pg_stat_activity;
backend_type     | client backend
-[ RECORD 6 ]----+---------------------------------
datid            | 16384
datname          | enterprisedb
pid              | 27150
usesysid         | 10
usename          | enterprisedb
application_name | pgbench
client_addr      |
client_hostname  |
client_port      | -1
backend_start    | 20-JUL-21 09:49:56.70284 +05:30
xact_start       | 20-JUL-21 09:52:18.941429 +05:30
query_start      | 20-JUL-21 09:52:18.941429 +05:30
state_change     | 20-JUL-21 09:52:18.94143 +05:30
wait_event_type  | IPC
wait_event       | ClogGroupUpdate
state            | active
backend_xid      | 4526420
backend_xmin     |
query            | select txid_current();
backend_type     | client backend
-[ RECORD 7 ]----+---------------------------------
datid            | 16384
datname          | enterprisedb
pid              | 27151
usesysid         | 10
usename          | enterprisedb
application_name | pgbench
client_addr      |
client_hostname  |
client_port      | -1
backend_start    | 20-JUL-21 09:49:56.704062 +05:30
xact_start       |
query_start      | 20-JUL-21 09:52:18.943293 +05:30
state_change     | 20-JUL-21 09:52:18.943411 +05:30
wait_event_type  | Client
wait_event       | ClientRead
state            | idle
backend_xid      |
backend_xmin     |
query            | select txid_current();
backend_type     | client backend
-[ RECORD 8 ]----+---------------------------------
datid            | 16384
datname          | enterprisedb
pid              | 27153
usesysid         | 10
usename          | enterprisedb
application_name | pgbench
client_addr      |
client_hostname  |
client_port      | -1
backend_start    | 20-JUL-21 09:49:56.7067 +05:30
xact_start       |
query_start      | 20-JUL-21 09:52:18.943218 +05:30
state_change     | 20-JUL-21 09:52:18.943334 +05:30
wait_event_type  |
wait_event       |
state            | idle
backend_xid      |
backend_xmin     |
query            | select txid_current();
backend_type     | client backend
-[ RECORD 9 ]----+---------------------------------
datid            | 16384
datname          | enterprisedb
pid              | 27154
usesysid         | 10
usename          | enterprisedb
application_name | pgbench
client_addr      |
client_hostname  |
client_port      | -1
backend_start    | 20-JUL-21 09:49:56.707948 +05:30
xact_start       | 20-JUL-21 09:52:18.941116 +05:30
query_start      | 20-JUL-21 09:52:18.941116 +05:30
state_change     | 20-JUL-21 09:52:18.941117 +05:30
wait_event_type  | IPC
wait_event       | ClogGroupUpdate
state            | active
backend_xid      | 4526414
backend_xmin     |
query            | select txid_current();
backend_type     | client backend
-[ RECORD 10 ]---+---------------------------------
datid            | 16384
datname          | enterprisedb
pid              | 27152
usesysid         | 10
usename          | enterprisedb
application_name | pgbench
client_addr      |
client_hostname  |
client_port      | -1
backend_start    | 20-JUL-21 09:49:56.710155 +05:30
xact_start       | 20-JUL-21 09:52:18.943403 +05:30
query_start      | 20-JUL-21 09:52:18.943403 +05:30
state_change     | 20-JUL-21 09:52:18.943405 +05:30
wait_event_type  |
wait_event       |
state            | active
backend_xid      |
backend_xmin     |
query            | select txid_current();
backend_type     | client backend
-[ RECORD 11 ]---+---------------------------------
datid            | 16384
datname          | enterprisedb
pid              | 27155
usesysid         | 10
usename          | enterprisedb
application_name | pgbench
client_addr      |
client_hostname  |
client_port      | -1
backend_start    | 20-JUL-21 09:49:56.710785 +05:30
xact_start       | 20-JUL-21 09:52:18.941493 +05:30
query_start      | 20-JUL-21 09:52:18.941493 +05:30
state_change     | 20-JUL-21 09:52:18.941494 +05:30
wait_event_type  | IPC
wait_event       | ClogGroupUpdate
state            | active
backend_xid      | 4526421
backend_xmin     |
query            | select txid_current();
backend_type     | client backend
-[ RECORD 12 ]---+---------------------------------
datid            | 16384
datname          | enterprisedb
pid              | 27156
usesysid         | 10
usename          | enterprisedb
application_name | pgbench
client_addr      |
client_hostname  |
client_port      | -1
backend_start    | 20-JUL-21 09:49:56.711762 +05:30
xact_start       |
query_start      | 20-JUL-21 09:52:18.942582 +05:30
state_change     | 20-JUL-21 09:52:18.942704 +05:30
wait_event_type  | Client
wait_event       | ClientRead
state            | idle
backend_xid      |
backend_xmin     |
query            | select txid_current();
backend_type     | client backend
-[ RECORD 13 ]---+---------------------------------
datid            | 16384
datname          | enterprisedb
pid              | 27157
usesysid         | 10
usename          | enterprisedb
application_name | pgbench
client_addr      |
client_hostname  |
client_port      | -1
backend_start    | 20-JUL-21 09:49:56.711944 +05:30
xact_start       | 20-JUL-21 09:52:18.943345 +05:30
query_start      | 20-JUL-21 09:52:18.943345 +05:30
state_change     | 20-JUL-21 09:52:18.943346 +05:30
wait_event_type  | Client
wait_event       | ClientRead
state            | active
backend_xid      | 4526447
backend_xmin     | 1195
query            | select txid_current();
backend_type     | client backend
-[ RECORD 14 ]---+---------------------------------


SESSION 4:

Open another session to check log files, if they are reporting any hints, warnings or errors
After ~1 hour of test run, I have started seeing below warnings in the log files.

2021-07-19 20:15:26 IST LOG:  statement: select txid_current();
2021-07-19 20:15:26 IST WARNING:  oldest xmin is far in the past
2021-07-19 20:15:26 IST HINT:  Close open transactions soon to avoid wraparound problems.
        You might also need to commit or roll back old prepared transactions, or drop stale replication slots.
2021-07-19 20:15:26 IST LOG:  statement: select txid_current();
2021-07-19 20:15:26 IST WARNING:  oldest xmin is far in the past
2021-07-19 20:15:26 IST HINT:  Close open transactions soon to avoid wraparound problems.
        You might also need to commit or roll back old prepared transactions, or drop stale replication slots.
2021-07-19 20:15:26 IST LOG:  statement: select txid_current();

After ~ 3 hours of test run, the warnings becoming more prominent.

-bash-4.2$ grep -Rinw /var/lib/edb/as11/data/log/ -e 'wraparound'
/var/lib/edb/as11/data/log/edb-2021-07-19_195300.log:17711:2021-07-19 19:53:01 IST HINT:  Close open transactions soon to avoid wraparound problems.
/var/lib/edb/as11/data/log/edb-2021-07-19_195300.log:20705:2021-07-19 19:53:01 IST HINT:  Close open transactions soon to avoid wraparound problems.
/var/lib/edb/as11/data/log/edb-2021-07-19_195300.log:21160:2021-07-19 19:53:01 IST HINT:  Close open transactions soon to avoid wraparound problems.
/var/lib/edb/as11/data/log/edb-2021-07-19_195300.log:21650:2021-07-19 19:53:01 IST HINT:  Close open transactions soon to avoid wraparound problems.
/var/lib/edb/as11/data/log/edb-2021-07-19_195300.log:22179:2021-07-19 19:53:01 IST HINT:  Close open transactions soon to avoid wraparound problems.
/var/lib/edb/as11/data/log/edb-2021-07-19_195300.log:22694:2021-07-19 19:53:01 IST HINT:  Close open transactions soon to avoid wraparound problems.
/var/lib/edb/as11/data/log/edb-2021-07-19_195300.log:23229:2021-07-19 19:53:01 IST HINT:  Close open transactions soon to avoid wraparound problems.
/var/lib/edb/as11/data/log/edb-2021-07-19_195300.log:23776:2021-07-19 19:53:01 IST HINT:  Close open transactions soon to avoid wraparound problems.
/var/lib/edb/as11/data/log/edb-2021-07-19_195300.log:24316:2021-07-19 19:53:01 IST HINT:  Close open transactions soon to avoid wraparound problems.
/var/lib/edb/as11/data/log/edb-2021-07-19_195300.log:24840:2021-07-19 19:53:01 IST HINT:  Close open transactions soon to avoid wraparound problems.
/var/lib/edb/as11/data/log/edb-2021-07-19_195300.log:25391:2021-07-19 19:53:01 IST HINT:  Close open transactions soon to avoid wraparound problems.
/var/lib/edb/as11/data/log/edb-2021-07-19_195300.log:25927:2021-07-19 19:53:01 IST HINT:  Close open transactions soon to avoid wraparound problems.
/var/lib/edb/as11/data/log/edb-2021-07-19_195300.log:27533:2021-07-19 19:53:01 IST HINT:  Close open transactions soon to avoid wraparound problems.
/var/lib/edb/as11/data/log/edb-2021-07-19_195300.log:28135:2021-07-19 19:53:01 IST HINT:  Close open transactions soon to avoid wraparound problems.
/var/lib/edb/as11/data/log/edb-2021-07-19_195300.log:32986:2021-07-19 19:53:01 IST HINT:  Close open transactions soon to avoid wraparound problems.
/var/lib/edb/as11/data/log/edb-2021-07-19_195300.log:33581:2021-07-19 19:53:01 IST HINT:  Close open transactions soon to avoid wraparound problems.
/var/lib/edb/as11/data/log/edb-2021-07-19_195300.log:17711:2021-07-19 19:53:01 IST HINT:  Close open transactions soon to avoid wraparound problems.
/var/lib/edb/as11/data/log/edb-2021-07-19_195300.log:20705:2021-07-19 19:53:01 IST HINT:  Close open transactions soon to avoid wraparound problems.
/var/lib/edb/as11/data/log/edb-2021-07-19_195300.log:21160:2021-07-19 19:53:01 IST HINT:  Close open transactions soon to avoid wraparound problems.
/var/lib/edb/as11/data/log/edb-2021-07-19_195300.log:21650:2021-07-19 19:53:01 IST HINT:  Close open transactions soon to avoid wraparound problems.
/var/lib/edb/as11/data/log/edb-2021-07-19_195300.log:22179:2021-07-19 19:53:01 IST HINT:  Close open transactions soon to avoid wraparound problems.
/var/lib/edb/as11/data/log/edb-2021-07-19_195300.log:22694:2021-07-19 19:53:01 IST HINT:  Close open transactions soon to avoid wraparound problems.
/var/lib/edb/as11/data/log/edb-2021-07-19_195300.log:23229:2021-07-19 19:53:01 IST HINT:  Close open transactions soon to avoid wraparound problems.
/var/lib/edb/as11/data/log/edb-2021-07-19_195300.log:23776:2021-07-19 19:53:01 IST HINT:  Close open transactions soon to avoid wraparound problems.
/var/lib/edb/as11/data/log/edb-2021-07-19_195300.log:24316:2021-07-19 19:53:01 IST HINT:  Close open transactions soon to avoid wraparound problems.
/var/lib/edb/as11/data/log/edb-2021-07-19_195300.log:24840:2021-07-19 19:53:01 IST HINT:  Close open transactions soon to avoid wraparound problems.
/var/lib/edb/as11/data/log/edb-2021-07-19_195300.log:25391:2021-07-19 19:53:01 IST HINT:  Close open transactions soon to avoid wraparound problems.
/var/lib/edb/as11/data/log/edb-2021-07-19_195300.log:25927:2021-07-19 19:53:01 IST HINT:  Close open transactions soon to avoid wraparound problems.
/var/lib/edb/as11/data/log/edb-2021-07-19_195300.log:27533:2021-07-19 19:53:01 IST HINT:  Close open transactions soon to avoid wraparound problems.
/var/lib/edb/as11/data/log/edb-2021-07-19_195300.log:28135:2021-07-19 19:53:01 IST HINT:  Close open transactions soon to avoid wraparound problems.
/var/lib/edb/as11/data/log/edb-2021-07-19_195300.log:32986:2021-07-19 19:53:01 IST HINT:  Close open transactions soon to avoid wraparound problems.
/var/lib/edb/as11/data/log/edb-2021-07-19_195300.log:33581:2021-07-19 19:53:01 IST HINT:  Close open transactions soon to avoid wraparound problems.

Now, let’s monitor system stats too to see overall load, processes their commands etc.

top - 00:19:39 up 159 days,  7:11,  6 users,  load average: 10.31, 9.97, 9.95
Tasks: 399 total,   9 running, 390 sleeping,   0 stopped,   0 zombie
%Cpu(s): 60.0 us, 38.4 sy,  0.0 ni,  1.6 id,  0.1 wa,  0.0 hi,  0.0 si,  0.0 st
KiB Mem : 32780168 total, 14568928 free,  1259976 used, 16951264 buff/cache
KiB Swap: 16777212 total, 16685044 free,    92168 used. 23083820 avail Mem

  PID USER      PR  NI    VIRT    RES    SHR S %CPU %MEM     TIME+ COMMAND
21831 enterpr+  20   0  591764   5228   2152 S 16.8  0.0 417:57.53 /usr/edb/as11/bin/pgbench -U enterprisedb enterprisedb -f wl.sql -c8 -j8 -T100000 -rn -P+
21845 enterpr+  20   0 8667644  24604  22256 R  9.7  0.1 209:53.07 postgres: enterprisedb enterprisedb [local] SELECT
21840 enterpr+  20   0 8667644  24584  22244 R  9.4  0.1 210:36.23 postgres: enterprisedb enterprisedb [local] idle
21844 enterpr+  20   0 8667644  24876  22528 R  9.4  0.1 209:38.54 postgres: enterprisedb enterprisedb [local] idle
21841 enterpr+  20   0 8667644  24836  22496 R  8.8  0.1 209:15.88 postgres: enterprisedb enterprisedb [local] SELECT
21847 enterpr+  20   0 8667644  24600  22252 S  8.8  0.1 206:16.87 postgres: enterprisedb enterprisedb [local] idle
21846 enterpr+  20   0 8667644  24604  22256 S  8.5  0.1 210:41.59 postgres: enterprisedb enterprisedb [local] idle
20421 enterpr+  20   0  259688   2124    632 R  7.1  0.0 146:27.66 postgres: logger
21843 enterpr+  20   0 8667644  24588  22248 R  6.6  0.1 210:05.38 postgres: enterprisedb enterprisedb [local] idle
21842 enterpr+  20   0 8667644  24600  22260 R  6.6  0.1 209:48.66 postgres: enterprisedb enterprisedb [local] idle
20426 enterpr+  20   0 8666684  18736  17208 R  4.0  0.1 102:43.53 postgres: walwriter
 6858 polkitd   20   0  620236  18044   4428 S  0.9  0.1  15940:23 /usr/lib/polkit-1/polkitd --no-debug

SESSION 2:

To my surprise, after ~8 hours of test run, the session screen where I have pgbench running, started throwing some WARNINGs to perform vacuum within specified number of transactions to avoid database shutdown. It kept on throwing those direct warnings for almost an hour before it stopped processing pgbench requests and started aborting workers with a message ‘ERROR: database is not accepting commands to avoid wraparound data loss in database “postgres”.

In the end it will present you the overall pgbench stats where it fired 2146483646 statements in total.

WARNING:  database "postgres" must be vacuumed within 5092920 transactions
HINT:  To avoid a database shutdown, execute a database-wide VACUUM in that database.
You might also need to commit or roll back old prepared transactions, or drop stale replication slots.
WARNING:  database "postgres" must be vacuumed within 5092920 transactions
HINT:  To avoid a database shutdown, execute a database-wide VACUUM in that database.
You might also need to commit or roll back old prepared transactions, or drop stale replication slots.
WARNING:  database "postgres" must be vacuumed within 5092917 transactions
HINT:  To avoid a database shutdown, execute a database-wide VACUUM in that database.
....
......
HINT:  To avoid a database shutdown, execute a database-wide VACUUM in that database.
You might also need to commit or roll back old prepared transactions, or drop stale replication slots.
WARNING:  database "postgres" must be vacuumed within 3178805 transactions
HINT:  To avoid a database shutdown, execute a database-wide VACUUM in that database.
You might also need to commit or roll back old prepared transactions, or drop stale replication slots.
WARNING:  database "postgres" must be vacuumed within 3178808 transactions
HINT:  To avoid a database shutdown, execute a database-wide VACUUM in that database.
You might also need to commit or roll back old prepared transactions, or drop stale replication slots.
WARNING:  database "postgres" must be vacuumed within 3178804 transactions
HINT:  To avoid a database shutdown, execute a database-wide VACUUM in that database.
You might also need to commit or roll back old prepared transactions, or drop stale replication slots.
WARNING:  database "postgres" must be vacuumed within 3178803 transactions
HINT:  To avoid a database shutdown, execute a database-wide VACUUM in that database.
You might also need to commit or roll back old prepared transactions, or drop stale replication slots.
WARNING:  database "postgres" must be vacuumed within 3178801 transactions
HINT:  To avoid a database shutdown, execute a database-wide VACUUM in that database.
You might also need to commit or roll back old prepared transactions, or drop stale replication slots.
WARNING:  database "postgres" must be vacuumed within 3178799 transactions
HINT:  To avoid a database shutdown, execute a database-wide VACUUM in that database.
......
........
You might also need to commit or roll back old prepared transactions, or drop stale replication slots.
WARNING:  database "postgres" must be vacuumed within 1000002 transactions
HINT:  To avoid a database shutdown, execute a database-wide VACUUM in that database.
You might also need to commit or roll back old prepared transactions, or drop stale replication slots.
WARNING:  database "postgres" must be vacuumed within 1000002 transactions
HINT:  To avoid a database shutdown, execute a database-wide VACUUM in that database.
You might also need to commit or roll back old prepared transactions, or drop stale replication slots.
client 0 aborted in command 0 (SQL) of script 0; ERROR:  database is not accepting commands to avoid wraparound data loss in database "postgres"
HINT:  Stop the postmaster and vacuum that database in single-user mode.
You might also need to commit or roll back old prepared transactions, or drop stale replication slots.

client 1 aborted in command 0 (SQL) of script 0; ERROR:  database is not accepting commands to avoid wraparound data loss in database "postgres"
HINT:  Stop the postmaster and vacuum that database in single-user mode.
You might also need to commit or roll back old prepared transactions, or drop stale replication slots.

client 7 aborted in command 0 (SQL) of script 0; ERROR:  database is not accepting commands to avoid wraparound data loss in database "postgres"
HINT:  Stop the postmaster and vacuum that database in single-user mode.
You might also need to commit or roll back old prepared transactions, or drop stale replication slots.

client 6 aborted in command 0 (SQL) of script 0; ERROR:  database is not accepting commands to avoid wraparound data loss in database "postgres"
HINT:  Stop the postmaster and vacuum that database in single-user mode.
You might also need to commit or roll back old prepared transactions, or drop stale replication slots.

client 2 aborted in command 0 (SQL) of script 0; ERROR:  database is not accepting commands to avoid wraparound data loss in database "postgres"
HINT:  Stop the postmaster and vacuum that database in single-user mode.
You might also need to commit or roll back old prepared transactions, or drop stale replication slots.

client 4 aborted in command 0 (SQL) of script 0; ERROR:  database is not accepting commands to avoid wraparound data loss in database "postgres"
HINT:  Stop the postmaster and vacuum that database in single-user mode.
You might also need to commit or roll back old prepared transactions, or drop stale replication slots.

WARNING:  database "postgres" must be vacuumed within 1000005 transactions
HINT:  To avoid a database shutdown, execute a database-wide VACUUM in that database.
You might also need to commit or roll back old prepared transactions, or drop stale replication slots.
client 3 aborted in command 0 (SQL) of script 0; ERROR:  database is not accepting commands to avoid wraparound data loss in database "postgres"
HINT:  Stop the postmaster and vacuum that database in single-user mode.
You might also need to commit or roll back old prepared transactions, or drop stale replication slots.

client 5 aborted in command 0 (SQL) of script 0; ERROR:  database is not accepting commands to avoid wraparound data loss in database "postgres"
HINT:  Stop the postmaster and vacuum that database in single-user mode.
You might also need to commit or roll back old prepared transactions, or drop stale replication slots.

transaction type: wl.sql
scaling factor: 1
query mode: simple
number of clients: 8
number of threads: 8
duration: 100000 s
number of transactions actually processed: 2146483646
latency average = 0.159 ms
latency stddev = 1.102 ms
tps = 50437.366776 (including connections establishing)
tps = 50437.386645 (excluding connections establishing)
statement latencies in milliseconds:
         0.171  select txid_current();
You have new mail in /var/spool/mail/enterprisedb
-bash-4.2$

SESSION 3:

Lets check our screen 3 to see where we are in terms on oldest current XID and percent towards wraparound, and I see XID numbers are not increasing and we have reached 107% towards wraparound (strange, why it goes beyond 100%).

enterprisedb=# WITH max_age AS ( 
    SELECT 2000000000 as max_old_xid
        , setting AS autovacuum_freeze_max_age 
        FROM pg_catalog.pg_settings 
        WHERE name = 'autovacuum_freeze_max_age' )
, per_database_stats AS ( 
    SELECT datname
        , m.max_old_xid::int
        , m.autovacuum_freeze_max_age::int
        , age(d.datfrozenxid) AS oldest_current_xid 
    FROM pg_catalog.pg_database d 
    JOIN max_age m ON (true) 
    WHERE d.datallowconn ) 
SELECT max(oldest_current_xid) AS oldest_current_xid
    , max(ROUND(100*(oldest_current_xid/max_old_xid::float))) AS percent_towards_wraparound
    , max(ROUND(100*(oldest_current_xid/autovacuum_freeze_max_age::float))) AS percent_towards_emergency_autovac 
FROM per_database_stats;

(1 row)
                     Tue 20 Jul 2021 06:57:51 AM IST (every 10s)

 oldest_current_xid | percent_towards_wraparound | percent_towards_emergency_autovac
--------------------+----------------------------+-----------------------------------
         2146483647 |                        107 |                              1073
(1 row)


                     Tue 20 Jul 2021 06:58:01 AM IST (every 10s)

 oldest_current_xid | percent_towards_wraparound | percent_towards_emergency_autovac
--------------------+----------------------------+-----------------------------------
         2146483647 |                        107 |                              1073
(1 row)


enterprisedb=# SELECT datname
, age(datfrozenxid)
, current_setting('autovacuum_freeze_max_age')
FROM pg_database
 ORDER BY 2 DESC;

   datname    |    age     | current_setting
--------------+------------+-----------------
 postgres     | 2146483647 | 200000000
 edb          | 2146483647 | 200000000
 template1    | 2146483647 | 200000000
 template0    | 2146483647 | 200000000
 immortal     | 2146483647 | 200000000
 darkthrone   | 2146483647 | 200000000
 immortal1    | 2146483647 | 200000000
 mayhem       | 2146483647 | 200000000
 murduk       | 2146483647 | 200000000
 burzum       | 2146483647 | 200000000
 gorgoroth    | 2146483647 | 200000000
 repmgr       | 2146483647 | 200000000
 enterprisedb | 2146483647 | 200000000
(13 rows)

Let’s connect with the database and see what happens when we try to do both SELECT & UPDATE statements …

enterprisedb=# \dt+
                            List of relations
 Schema |       Name       | Type  |    Owner     |  Size   | Description
--------+------------------+-------+--------------+---------+-------------
 public | pgbench_accounts | table | enterprisedb | 13 MB   |
 public | pgbench_branches | table | enterprisedb | 40 kB   |
 public | pgbench_history  | table | enterprisedb | 40 kB   |
 public | pgbench_tellers  | table | enterprisedb | 40 kB   |
 public | scale_data       | table | enterprisedb | 6720 MB |
(5 rows)

enterprisedb=# select * from pgbench_history;
 tid | bid |  aid  | delta |           mtime           | filler
-----+-----+-------+-------+---------------------------+--------
   2 |   1 | 64444 | -1096 | 19-JUL-21 18:41:15.655738 |
   3 |   1 | 18460 | -4688 | 19-JUL-21 18:41:15.668699 |
   2 |   1 | 92762 | -4669 | 19-JUL-21 18:41:15.670741 |
   2 |   1 | 55081 |  1817 | 19-JUL-21 18:41:15.672719 |
   5 |   1 | 47743 |   803 | 19-JUL-21 18:41:15.674666 |
   5 |   1 | 23899 | -3910 | 19-JUL-21 18:41:15.67664  |
  10 |   1 | 33384 |  4005 | 19-JUL-21 18:41:15.678631 |
   6 |   1 | 88383 | -4257 | 19-JUL-21 18:41:15.680629 |
   8 |   1 | 87562 |   200 | 19-JUL-21 18:41:15.682612 |
   5 |   1 |  3957 | -2407 | 19-JUL-21 18:41:15.684595 |
(10 rows)

enterprisedb=#
enterprisedb=# update pgbench_history set aid=65555 where aid=64444;
ERROR:  database is not accepting commands to avoid wraparound data loss in database "postgres"
HINT:  Stop the postmaster and vacuum that database in single-user mode.
You might also need to commit or roll back old prepared transactions, or drop stale replication slots.
enterprisedb=#
enterprisedb=#
enterprisedb=#

Alright, so with transaction wraparound is already there, we only be able to run SELECT queries, but DMLS will fail with a message printed to stop the database and vacuum it in single-user mode.

So, what we have learned

  • Database will keep on running and accepting READ ONLY (SELECT) requests, error will be thrown in case if DMLs tried.
  • 2,000,000,000 seems a huge number, but in case of busy transactional database, it’s just a matter of few hours.
  • AUTOVACUUMING is good thing, at least for this scenario, let’s not discuss about its bugs and other problems.
  • Add VACUUMING a routine activity else you will soon find yourself in a big mess.

The easiest way to get the highest TXID age value back down is to force a vacuum on the entire database cluster. And the best way to do this cluster-wide vacuum is the vacuumdb binary utility that comes with PostgreSQL. I will cover it in my next post as this post is all about simulating wraparounds.

Hope It Helped!
Prashant Dixit
Posted in Advanced, troubleshooting | Tagged: , , | 7 Comments »

pgCenter, a TOP like utility to monitor PostgreSQL databases

Posted by FatDBA on July 12, 2021

Hi All,

I was recently asked by one of my team mate to recommend any performance monitoring tool which is free, text based, light weight and is quick to run to check what all is running on the PostgreSQL database. He wanted to use it for one of the performance drive he was leading for one production database setup. The guy was coming from Oracle background, and was looking something like Linux TOP utility or like oratop (like top for oracle database) …

After carefully understanding his requirements, I recommended him to use pgCenter. This is an open source project by Lesovsky Alexey (the man behind pgstats.dev and Weaponry) and is a command-line admin tool for observing and troubleshooting Postgres database. I would have recommended pg_top to him, but pgCenter is one step ahead and better as it provide more details as compared to the later.

pgCenter’s main goal is to help Postgres DBA working with statistics and provide a convenient way to observe Postgres in runtime. Tool is capable to provide replication, table level, Index, activity, table size, database (overall), and function statistics. It also shows details on VACCUM, NIC & Disk stats along with OS level stats of CPU, Memory, load averages, connection and server details.

It’s pretty easy to call or install, please refer below project GitHub link to download and follow install actions. https://github.com/lesovsky/pgcenter

So, let’s see what all it monitors and catches.

[enterprisedb@fatdba ~]$
[enterprisedb@fatdba ~]$ pgcenter top -d perf -h 10.0.0.130 -U enterprisedb  -p 5444

A GIF (from project page on github) to show it in real-time, what all you can do with the tool.

Stats it supports …

PostgreSQL Stats it supports:

  • summary activity – a compilation/selection of metrics from different sources – postgres uptime, version, recovery status, number of clients grouped by their states, number of (auto)vacuums, statements per second, age of the longest transaction and the longest vacuum;
  • pg_stat_activity – activity of connected clients and background processes.
  • pg_stat_database – database-wide and sessions statistics, such as number of commits/rollbacks, processed tuples, deadlocks, temporary files, etc.
  • pg_stat_replication – replication statistics, like connected standbys, their activity and replication lag.
  • pg_stat_user_tables, pg_statio_user_tables – statistics on accesses (including IO) to tables.
  • pg_stat_user_indexes, pg_statio_user_indexes – statistics on accesses (including IO) to indexes.
  • pg_stat_user_functions – statistics on execution of functions.
  • pg_stat_wal – WAL usage statistics.
  • pg_stat_statements – statistics on SQL statements executed including time and resources usage.
  • statistics on tables sizes based on pg_relation_size() and pg_total_relation_size() functions;
  • pg_stat_progress_vacuum – progress of (auto)vacuums operations.
  • pg_stat_progress_cluster – progress of CLUSTER and VACUUM FULL operations.
  • pg_stat_progress_create_index – progress of CREATE INDEX and REINDEX operations.
  • pg_stat_progress_analyze – progress of ANALYZE operations.
  • pg_stat_progress_basebackup – progress of basebackup operations.
  • pg_stat_progress_copy – progress of COPY operations.

System Statistics it supports :

pgCenter top also provides system usage information based on statistics from procfs filesystem:

  • load average and CPU usage time (user, system, nice, idle, iowait, software, and hardware interrupts, steal);
  • memory and swap usage, amount of cached and dirty memory, writeback activity;
  • storage devices statistics: IOPS, throughput, latencies, average queue and requests size, devices utilization;
  • network interfaces statistics: throughput in bytes and packets, different kind of errors, saturation and utilization.
  • mounted filesystems’ usage statistics: total size, amount of free/used/reserved space and inodes.

Hope It Helps!
Prashant Dixit

Posted in troubleshooting | Tagged: , , , | Leave a Comment »