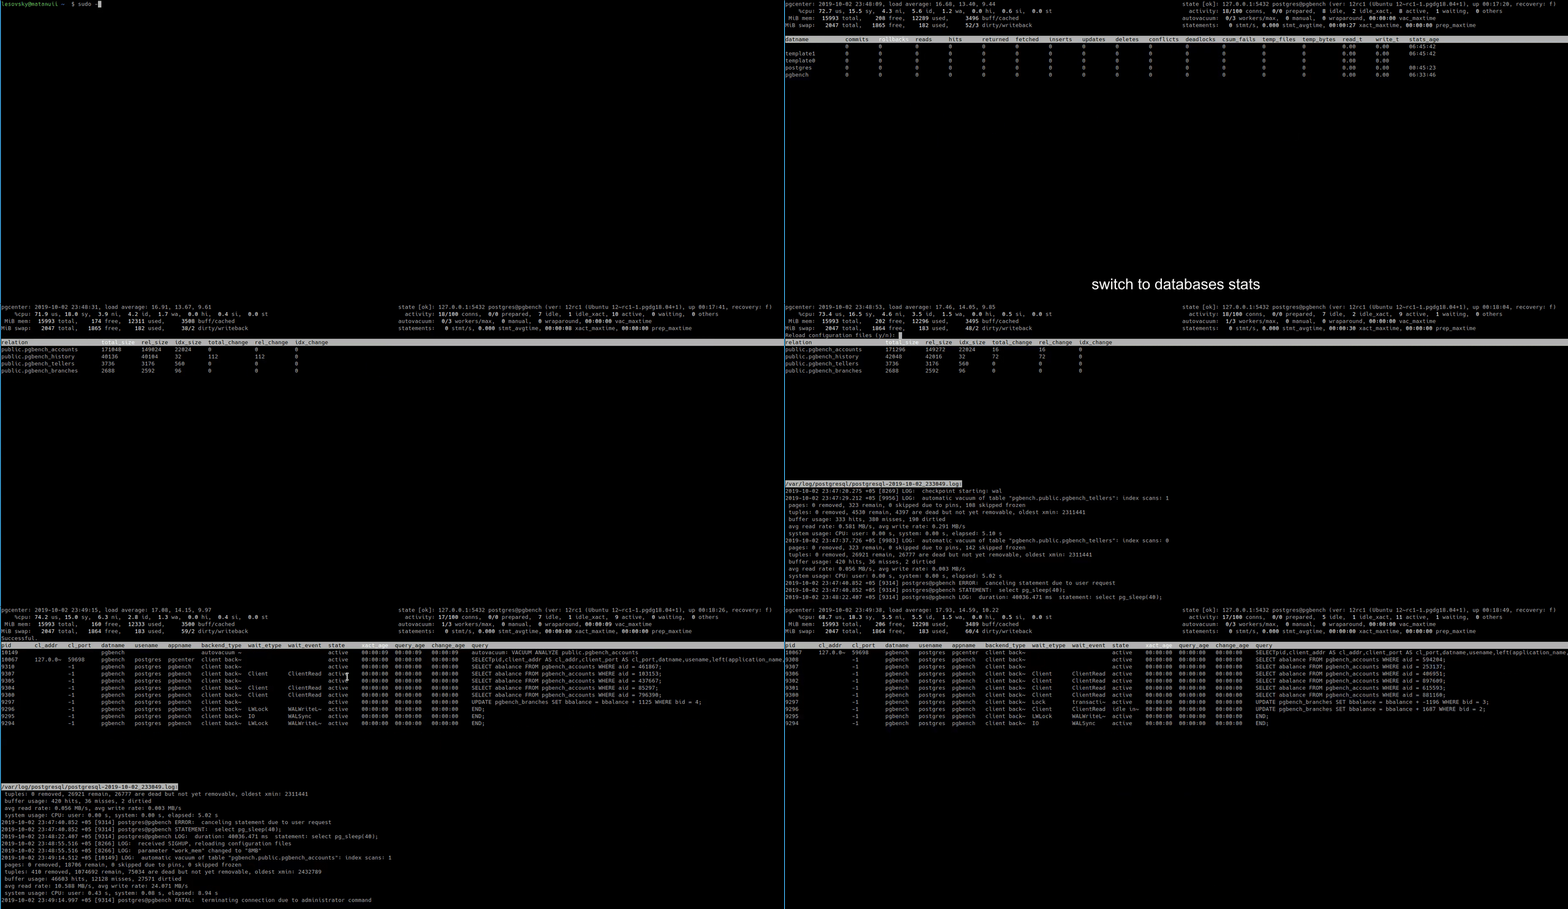
I was recently asked by one of my team mate to recommend any performance monitoring tool which is free, text based, light weight and is quick to run to check what all is running on the PostgreSQL database. He wanted to use it for one of the performance drive he was leading for one production database setup. The guy was coming from Oracle background, and was looking something like Linux TOP utility or like oratop (like top for oracle database) …
After carefully understanding his requirements, I recommended him to use pgCenter. This is an open source project by Lesovsky Alexey (the man behind pgstats.dev and Weaponry) and is a command-line admin tool for observing and troubleshooting Postgres database. I would have recommended pg_top to him, but pgCenter is one step ahead and better as it provide more details as compared to the later.
pgCenter’s main goal is to help Postgres DBA working with statistics and provide a convenient way to observe Postgres in runtime. Tool is capable to provide replication, table level, Index, activity, table size, database (overall), and function statistics. It also shows details on VACCUM, NIC & Disk stats along with OS level stats of CPU, Memory, load averages, connection and server details.
It’s pretty easy to call or install, please refer below project GitHub link to download and follow install actions. https://github.com/lesovsky/pgcenter
A GIF (from project page on github) to show it in real-time, what all you can do with the tool.
Stats it supports …
PostgreSQL Stats it supports:
summary activity – a compilation/selection of metrics from different sources – postgres uptime, version, recovery status, number of clients grouped by their states, number of (auto)vacuums, statements per second, age of the longest transaction and the longest vacuum;
pg_stat_activity – activity of connected clients and background processes.
pg_stat_database – database-wide and sessions statistics, such as number of commits/rollbacks, processed tuples, deadlocks, temporary files, etc.
pg_stat_replication – replication statistics, like connected standbys, their activity and replication lag.
pg_stat_user_tables, pg_statio_user_tables – statistics on accesses (including IO) to tables.
pg_stat_user_indexes, pg_statio_user_indexes – statistics on accesses (including IO) to indexes.
pg_stat_user_functions – statistics on execution of functions.
pg_stat_wal – WAL usage statistics.
pg_stat_statements – statistics on SQL statements executed including time and resources usage.
statistics on tables sizes based on pg_relation_size() and pg_total_relation_size() functions;
pg_stat_progress_vacuum – progress of (auto)vacuums operations.
pg_stat_progress_cluster – progress of CLUSTER and VACUUM FULL operations.
pg_stat_progress_create_index – progress of CREATE INDEX and REINDEX operations.
pg_stat_progress_analyze – progress of ANALYZE operations.
pg_stat_progress_basebackup – progress of basebackup operations.
pg_stat_progress_copy – progress of COPY operations.
System Statistics it supports :
pgCenter top also provides system usage information based on statistics from procfs filesystem:
load average and CPU usage time (user, system, nice, idle, iowait, software, and hardware interrupts, steal);
memory and swap usage, amount of cached and dirty memory, writeback activity;
storage devices statistics: IOPS, throughput, latencies, average queue and requests size, devices utilization;
network interfaces statistics: throughput in bytes and packets, different kind of errors, saturation and utilization.
mounted filesystems’ usage statistics: total size, amount of free/used/reserved space and inodes.
Last week I was asked to take a look in to one performance problem where customer DBA reported excessive ‘SQL*Net message from dblink’ in the system. As I don’t have direct access to the box, I asked him to share both AWR and ASH performance reports for the time when they observe the problem. And yes, he was right, there were few waits on this event but with very high average elapsed times or single execution times. Next I verified the ASH data for the period and I was able to identify this SQL (SELECT) which is frequently waiting on this wait tvent.
About this event, as you guys know SQL Net messages are classified as Network classed events and happens when some part of the final dataset is coming from a remote database which is accessed via DBLink. Alright, so we know the problem and we have the problematic SQL, let’s simulate the problem and the solution.
I will first create the DBLink that I will be using to access the remote data which is present in a different database on a different server/host and next I will create the sample table with some test data both on Site A and Site B.
Reference used: BIGTAB: Table on Site 1, local site. BIGTAB2: Table on site 2, remote location
SQL>
SQL> CREATE DATABASE LINK dixitdlink1
  2     CONNECT TO dixit IDENTIFIED BY oracle90
   USING '(DESCRIPTION=
            (ADDRESS = (PROTOCOL = TCP)(HOST = canttowinsec.quebecdomain)(PORT = 1521))
            (CONNECT_DATA=(SERVICE_NAME=dhavaldb.quebecdomain))
          )';

Database link created.

SQL>


-- On source database, on local host.
CREATE TABLE BIGTAB (
   id         NUMBER,
   weight     NUMBER,
   adate      DATE
);

Table created.

INSERT INTO BIGTAB (id, weight, adate)
SELECT MOD(ROWNUM,1000),
       DBMS_RANDOM.RANDOM,
       SYSDATE-1000+DBMS_RANDOM.VALUE(0,1000)
 FROM all_objects
/

67447 rows created.


SQL> delete from prashant.BIGTAB where rownum < 60000;

59999 rows deleted.


-- This I have created on target database, on a remote host.
CREATE TABLE BIGTAB2 (
   id         NUMBER,
   weight     NUMBER,
   adate      DATE
);

Table created.


INSERT INTO BIGTAB2 (id, weight, adate)
SELECT MOD(ROWNUM,1000),
       DBMS_RANDOM.RANDOM,
       SYSDATE-1000+DBMS_RANDOM.VALUE(0,1000)
 FROM all_objects
/

67447 rows created.
Alright, the test data is created on both the sites, and in order to mimic the exact case that I’d faced, I have intentionally deleted 59999 table from table that exists in site 1. So now we have table BIGTAB with 7735 records and on remote database we have a table with name BIGTAB2 with 67447 rows. Let’s execute few queries and do a Inner Join on both the tables.
Test 1:With no hint or tuning/tweaking of any kind. Asking to bring all data from remote site here to local site and then perform the join operation or this can also be done if we put the hint and mention name of the local table, or table that is small i.e. /*+ DRIVING_SITE(BIGTAB) */
So, this was happening there on that day, on that system with that query waiting on ‘SQL*Net message from dblink‘, now this is the right time I should introduce the DRIVING_SITE hint, I have been trying and experimenting with this hint for a long time now, maybe since my 9i days.
This hint is useful for distributed queries to force optimizer to use a particular site as a driving site, or it instructs the optimizer to execute the query at a different site than that selected by the database. Like in previous test case all rows from remote host which matches the condition are sent to the local site and the join is finally executed on the local site.
Now, I am going to use the DRIVING_SITE (will mention name of the remote table) and force the optimizer to perform all join operations at the remote site, hence the query will be executed there and the result set is returned to the local site.
So, you should try with the DRIVING_SITE hint on the site where the huge table resides!
Test 2: With DRIVING_HINT on remote table BIGTAB2 which is big and has 67447 records.
Look at the cost, rows processed and bytes (data processed), all of them are reduced by a great extent. Of course not much elapsed time difference you see here in this example as the dataset is small and is a less complex query, you can try it yourself and see the magic!
Today’s post will be all about monitoring your PostgreSQL database clusters using EDB PostgreSQL Enterprise Manager (PEM). Postgres Enterprise Manager is a comprehensive, customizable solution providing an interface to control and optimize your PostgreSQL deployment.
I will be doing the installation, configuration, adding servers to the console and will perform a live monitoring of the database while I will be generating some synthetic load on the database host. I am doing this on a standalone RHEL 7 64 Bit server which I will be using it both as a PEM server and local instance. Alright, so without further ado, lets start. So, first you need to download EDB’s official repository and install following package.
Below is a complete list of packages available with name ‘edb-pem’, you need to install version: edb-pem-8.0.1-1.rhel7.x86_64
=================================================================== N/S matched: edb-pem ====================================================================
edb-pem-debuginfo.x86_64 : Debug information for package edb-pem
edb-pem.x86_64 : PostgreSQL Enterprise Manager
edb-pem-agent.x86_64 : Postgres Enterprise Manager Agent
edb-pem-docs.x86_64 : Documentation for Postgres Enterprise Manager
edb-pem-server.x86_64 : PEM Server Components
Once installation is completed, go to the default installation directory, it’s /usr/edb in my case, and go to pem/bin folder.
[root@canttowin ~]# cd /usr/edb/
[root@canttowin edb]# ls
as12 bart efm-4.1 jdbc migrationtoolkit pem pgbouncer1.15 pgpool4.2
[root@canttowin ~]# cd /usr/edb/pem/bin/
[root@canttowin bin]# ls
configure-pem-server.sh configure-selinux.sh
We see two configuration shell scripts are present, we will be using the configuration script – configure-pem-server.sh Here I will be choosing option 1 which means I will be installing web services and databases all on one host, next you need to input installation path (/usr/edb/as12 in my case), followed by super user name, port numbers and IP Address of the server.
Before I call the config script, let me quickly reset the default superuser’s password.
postgres=# alter user postgres with password 'dixit';
ALTER ROLE
Now, let’s call the configuration scipt and pass all discussed values.
[root@canttowin bin]# ./configure-pem-server.sh
-----------------------------------------------------
EDB Postgres Enterprise Manager
-----------------------------------------------------
Install type: 1:Web Services and Database, 2:Web Services 3: Database [ ] :1
Enter local database server installation path (i.e. /usr/edb/as12 , or /usr/pgsql-12, etc.) [ ] :/usr/edb/as12
Enter database super user name [ ] :enterprisedb
Enter database server port number [ ] :5444
Enter database super user password [ ] :
Please enter CIDR formatted network address range that agents will connect to the server from, to be added to the server's pg_hba.conf file. For example, 192.168.1.0/24 [ 0.0.0.0/0 ] :10.0.0.153/32
Enter database systemd unit file or init script name (i.e. edb-as-12 or postgresql-12, etc.) [ ] :edb-as-12Please specify agent certificate path (Script will attempt to create this directory, if it does not exists) [ ~/.pem/ ] :
CREATE EXTENSION
[Info] Configuring database server.
CREATE DATABASE
CREATE ROLE
CREATE ...
..
..
..
CREATE EXTENSION
--> [Info] --> [Info] Configuring database server.
--> [Info] --> [Info] creating role pem
--> [Info] --> [Info] Generating certificates
--> [Info] --> [Info] Executing systemctl stop edb-as-12
--> [Info] --> [Info] Skipping - configurations for /var/lib/edb/as12/data/pg_hba.conf and /var/lib/edb/as12/data/postgresql.conf file
--> [Info] --> [Info] Executing systemctl start edb-as-12
--> [Info] --> [Info] Enable pemagent service.
--> [Info] --> [Info] Executing systemctl enable pemagent
--> [Info] --> [Info] Stop pemagent service
--> [Info] --> [Info] Executing systemctl stop pemagent
--> [Info] --> [Info] Start pemagent service.
--> [Info] --> [Info] Executing systemctl start pemagent
--> [Info] --> [Info] Configuring httpd server
--> [Info] --> [Info] Executing systemctl stop httpd
--> [Info] --> [Info] Taking backup of /usr/edb/pem/web/pem.wsgi
--> [Info] --> [Info] Creating /usr/edb/pem/web/pem.wsgi
--> [Info] --> [Info] Taking backup of /usr/edb/pem/web/config_local.py.
--> [Info] --> [Info] Generating PEM Cookie Name.--> [Info] --> [Info] Creating /usr/edb/pem/web/config_local.py
--> [Info] --> [Info] Taking backup of /etc/httpd/conf.d/edb-pem.conf
--> [Info] --> [Info] Creating /etc/httpd/conf.d/edb-pem.conf
--> [Info] --> [Info] Configuring httpd server sslconf
--> [Info] --> [Info] Taking backup of /etc/httpd/conf.d/edb-ssl-pem.conf
--> [Info] --> [Info] Taking backup of /etc/httpd/conf.d/edb-ssl-pem.conf
--> [Info] --> [Info] Executing /usr/edb/pem/web/setup.py
Postgres Enterprise Manager - Application Initialisation
========================================================
--> [Info] --> [Info] Check and Configure SELinux security policy for PEM
getenforce found, now executing 'getenforce' command
Configure the httpd to work with the SELinux
Allow the httpd to connect the database (httpd_can_network_connect_db = on)
Allow the httpd to connect the network (httpd_can_network_connect = on)
Allow the httpd to work with cgi (httpd_enable_cgi = on)
Allow to read & write permission on the 'pem' user home directory
SELinux policy is configured for PEM
--> [Info] --> [Info] Executing systemctl start httpd
--> [Info] --> [Info] Configured the webservice for EDB Postgres Enterprise Manager (PEM) Server on port '8443'.
--> [Info] --> [Info] PEM server can be accessed at https://127.0.0.1:8443/pem at your browser
It’s completed, and at the very end it has provided URL to access the PEM GUI.
Now next step is to install PEM Agents to the server, you need to install it on all servers which you want to monitor, I am leaving the PEMAgents configuration that you do in agent.cfg file.
[root@canttowin bin]# yum install edb-pem-agent
Let’s check the PEM GUI now.
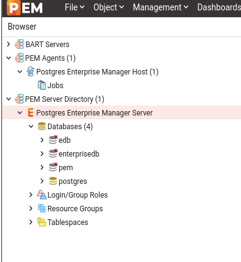
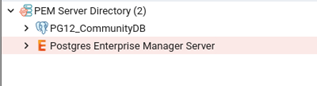
Here on the left panel you will notice there’s already one database present under ‘PEM Server Directory’ folder, this is the same database which we have configured/used PEM server, hence it will be automatically added to the server list. We will manually add one more database cluster to explain how to do it explicitly.
Let’s check the dashboard for the same (PEM Server) database for session, TPS, IO related details.
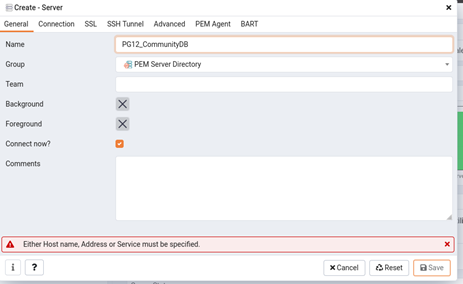
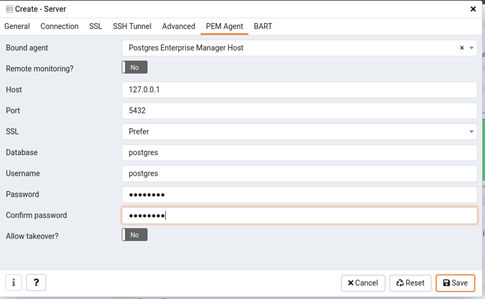
Now, let’s add another database to the monitoring console. I will be adding a community PostgreSQL 12 database to it. Go to ‘PEM Server Directory’ folder right click on it, choose option create-> server.
Next, fill connection wizard with all details i.e, username, password, IP, port and security related details for the new database and click save at the end.
And you are done!
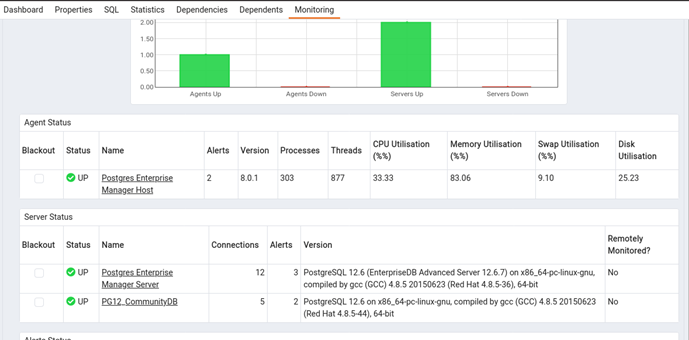
Now, let’s see the default landing page of PEM GUI and here you see details of all added hosts and agents with their status.
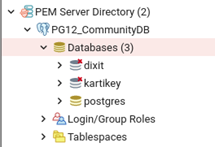
Next I will create some new databases to see how that data reflects in PEM GUI. postgres=# postgres=# create database dixit; CREATE DATABASE postgres=# create database kartikey; CREATE DATABASE
All good! now let’s do some performance test to see how useful PEM can be in case of performance issues. In order to mimic or simulate the situation, I will generating some synthetic load using PostgreSQL’s default utility Pgbench.
Reference: -c number of clients -j 2 number of threads -t amount of transactions
These values are 10000 transactions per client. So : 10 x 10000 = 100,000 transactions
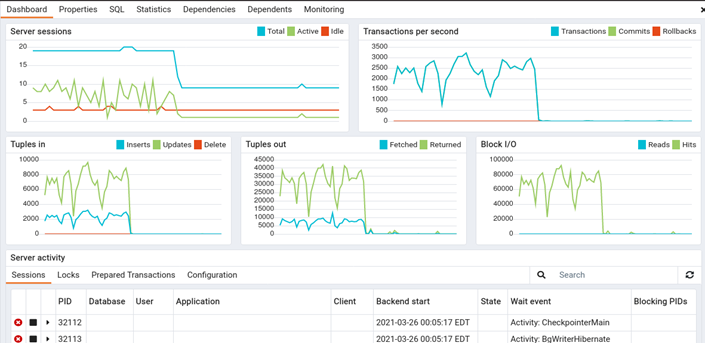
Let’s see how the changes are captured and presented in PEM.
Okay, we can see the peaks are recorded and presented.
The load is still running and we can clearly see that from the below graph.
[postgres@canttowin bin]$ ./pgbench -U postgres -p 5432 -c 10 -j 2 -t 10000 postgres starting vacuum…end.transaction type: scaling factor: 1 query mode: simple number of clients: 10 number of threads: 2 number of transactions per client: 10000 number of transactions actually processed: 100000/100000 latency average = 18.217 ms tps = 548.940142 (including connections establishing) tps = 548.970173 (excluding connections establishing)
Alright, so the load run has ended, let see how the graph now looks like.
So to conclude, PEM is a great tool which can fulfil all your monitoring needs, it has got some cool features too i.e. performance dashboards, tuning wizards, advisories and other graphs.
I am back with the another post, this time it’s for monitoring PostgreSQL database using one of the popular interactive visualization platform Grafana. I have recently implemented Grafana + Prometheus and created few really cool performance charts and database metric dashboards using one of the popular PostgreSQL metric exporter ‘postgres_exporter‘ to monitor a EDB 12 PostgreSQL database cluster.
I have divided everything in to three parts – Grafana Installation & configuration, Prometheus Installation and Configuration and final postgres_exporter installation and configuration.
let’s first start with Grafana installation and configuration on Linux server (this is EL 7).
Grafana Installation:
1. Disable SELinux
Change SELINUX=enforcing to SELINUX=disabled and Reboot.
This will install all binaries to location /usr/sbin/grafana-server, copies init.d file to /etc/init.d/grafana-server and default log location would be /var/log/grafana/grafana.log.
Enable Grafana service on system boot systemctl enable grafana-server.service
Start it using the following command: systemctl start grafana-server
6. Check Grafana web interface
http://IPADDRESSorHOSTNAME:3000/
Note: Default username and password is ‘admin‘, and once you login, it will prompt you to set a new password.
Add PostgreSQL as Data Source:
Next we now going to add PostgreSQL as a data source in Grafana.
1. Login to Grafana and go to ‘configuration‘ tab on the left of the console.
2. Add PostgreSQL as a data source, populate all details like hostname, port number, database name, DB user and password, PostgreSQL version and some optional entries like connection limits, SSL details etc. Once done, click on button with name save and test to see if all details are fine.
3. Now you will start seeing PostgreSQL as a data source under data source tab.
Prometheus Installation & Config
All good, now next is to install and configure ‘Prometheus’, this is a time-series database that is optimized for storing and serving time series through associated pairs of time(s) and value(s). You can also use InfluxDB or Graphite as a time series database for Grafana.
1. Download and untar the Prometheus file for your respective OS. Example: curl -LO url -LO https://github.com/prometheus/prometheus/releases/download/v2.22.0/prometheus-2.22.0.linux-amd64.tar.gz tar -xvf prometheus-2.22.0.linux-amd64.tar.gz mv prometheus-2.22.0.linux-amd64 prometheus-files
2. Create prometheus user, directories and make that account owner for all the files and folders.
[root@canttowin edb]# systemctl status prometheus
● prometheus.service - Prometheus
   Loaded: loaded (/etc/systemd/system/prometheus.service; enabled; vendor preset: disabled)
   Active: active (running) since Wed 2021-03-24 05:55:53 EDT; 4s ago
 Main PID: 17641 (prometheus)
    Tasks: 7
   CGroup: /system.slice/prometheus.service
           └─17641 /usr/local/bin/prometheus --config.file /etc/prometheus/prometheus.yml --storage.tsdb.path /var/lib/prometheus/ --web.console.templates...

Mar 24 05:55:54 canttowin.ontadomain prometheus[17641]: level=info ts=2021-03-24T09:55:54.172Z caller=head.go:714 component=tsdb msg="WAL segment ...gment=10
Mar 24 05:55:54 canttowin.ontadomain prometheus[17641]: level=info ts=2021-03-24T09:55:54.358Z caller=head.go:714 component=tsdb msg="WAL segment ...gment=10
Mar 24 05:55:54 canttowin.ontadomain prometheus[17641]: level=info ts=2021-03-24T09:55:54.455Z caller=head.go:714 component=tsdb msg="WAL segment ...gment=10
Mar 24 05:55:54 canttowin.ontadomain prometheus[17641]: level=info ts=2021-03-24T09:55:54.456Z caller=head.go:714 component=tsdb msg="WAL segment ...gment=10
Mar 24 05:55:54 canttowin.ontadomain prometheus[17641]: level=info ts=2021-03-24T09:55:54.456Z caller=head.go:719 component=tsdb msg="WAL replay c...173255ms
Mar 24 05:55:54 canttowin.ontadomain prometheus[17641]: level=info ts=2021-03-24T09:55:54.478Z caller=main.go:732 fs_type=XFS_SUPER_MAGIC
Mar 24 05:55:54 canttowin.ontadomain prometheus[17641]: level=info ts=2021-03-24T09:55:54.478Z caller=main.go:735 msg="TSDB started"
Mar 24 05:55:54 canttowin.ontadomain prometheus[17641]: level=info ts=2021-03-24T09:55:54.478Z caller=main.go:861 msg="Loading configuration file"...heus.yml
Mar 24 05:55:54 canttowin.ontadomain prometheus[17641]: level=info ts=2021-03-24T09:55:54.481Z caller=main.go:892 msg="Completed loading of configuration …µs
Mar 24 05:55:54 canttowin.ontadomain prometheus[17641]: level=info ts=2021-03-24T09:55:54.481Z caller=main.go:684 msg="Server is ready to receive ...quests."
Hint: Some lines were ellipsized, use -l to show in full.
9. If no issues till here, you are all good, time to check Prometheus WEB GUI, you can access its using below URL.
http://10.0.0.153:9090/graph
10. You can check other stats and other available metrics via GUI console.
11. Now you will start seeing ‘Prometheus’ in the list of data sources along with PostgreSQL which we have added at the first step.
Postgres_Exporter Installation and configuration
Now, when Grafana and Prometheus is all set, time to install and configure postgres_exporter. Postgres_exporter is a popular PostgreSQL metric exporter for Prometheus.
1. Lets create few required directories first.
mkdir /opt/postgres_exporter
cd /opt/postgres_exporter
2. Download and untar the file.
wget https://github.com/wrouesnel/postgres_exporter/releases/download/v0.5.1/postgres_exporter_v0.5.1_linux-amd64.tar.gz
tar -xzvf postgres_exporter_v0.5.1_linux-amd64.tar.gz
cd postgres_exporter_v0.5.1_linux-amd64
3. Copy core file ‘postgres_exporter’ file to /usr/local/bin directory
cp postgres_exporter /usr/local/bin
4. Next, lets create the configuration file for postres_exporter
cd /opt/postgres_exporter
sudo vi postgres_exporter.env
I want to visualize my EDB 12 PostgreSQL stats, so will use below data source details. This is for all database, you can also monitor any specific database.
[root@canttowin edb]# more /opt/postgres_exporter/postgres_exporter.env
DATA_SOURCE_NAME="postgresql://enterprisedb:oracle@10.0.0.153:5444/?sslmode=disable"
[root@canttowin edb]# systemctl status postgres_exporter
● postgres_exporter.service - Prometheus exporter for Postgresql
   Loaded: loaded (/etc/systemd/system/postgres_exporter.service; enabled; vendor preset: disabled)
   Active: active (running) since Wed 2021-03-24 05:52:17 EDT; 2s ago
 Main PID: 16984 (postgres_export)
    Tasks: 3
   CGroup: /system.slice/postgres_exporter.service
           └─16984 /usr/local/bin/postgres_exporter --web.listen-address=:9187 --web.telemetry-path=/metrics

Mar 24 05:52:17 canttowin.ontadomain systemd[1]: Started Prometheus exporter for Postgresql.
Mar 24 05:52:17 canttowin.ontadomain postgres_exporter[16984]: time="2021-03-24T05:52:17-04:00" level=info msg="Established new database connection...go:777"
Mar 24 05:52:17 canttowin.ontadomain postgres_exporter[16984]: time="2021-03-24T05:52:17-04:00" level=info msg="Semantic Version Changed on \"10.0....o:1229"
Mar 24 05:52:18 canttowin.ontadomain postgres_exporter[16984]: time="2021-03-24T05:52:18-04:00" level=info msg="Starting Server: :9187" source="pos...o:1437"
Hint: Some lines were ellipsized, use -l to show in full.
7. Now we can check status if postgres_exporter (as a target) state information and other details. This we can check it through Prometheus web GUI.
As we have configured postgres_exporter and mapped it with Prometheus, we can also look for many of the expressions that it has created. This you can access on ‘graph’ page under Prometheus GUI console.
You can check it’s immediate results in both graphical or in console itself.
Alright, we have installed and configured Grafana and have added PostgreSQL and Prometheus as a data source and have configured postgres_exporter metric collector too. Time to generate some graphs. Well, you can do it by creating manual queries under new dashboards or else you can use any of prebuild Grafana dashboard templates for PostgreSQL i.e. 6742 or even 9628 (there are many more on Grafana labs repo).
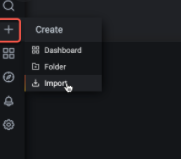
1. Lets Import dashboard with ID 6742. Go to option with + sign on the left panel and choose last option ‘import’.
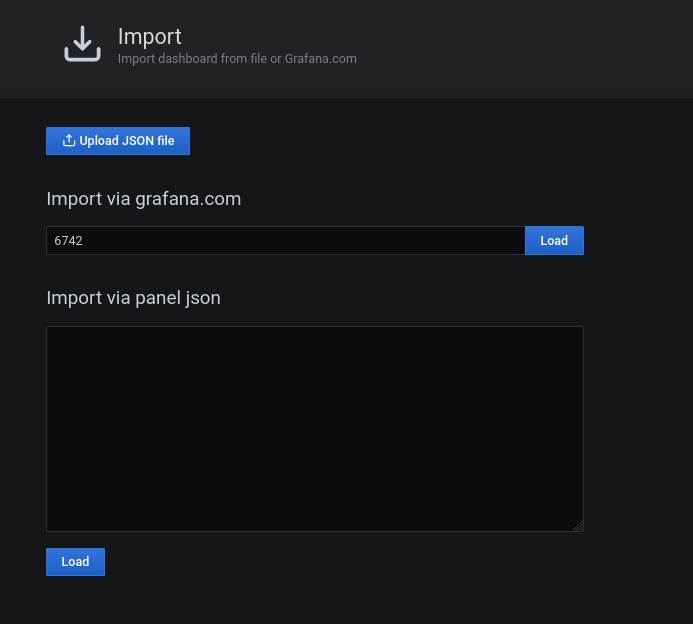
2. In next screen, pass dashboard ID 6742 and press button Load. You can also use JSON file entries instead of ID, I will use ID here in this sample configuration. Here select ‘Prometheus’ from the drop down list and click ‘Import’ and it’s all set!
3. Now this will bring the final dashboard showing lot’s of PostgreSQL metrics and their current values.
For one of our customer we recently moved from on-prem to AWS cloud and we moved our entire infrastructure along with our MySQL & PostgreSQL Clusters. The very next question that started bothering us is to look out for any solid, stable and reliable monitoring and performance management tool, and then we learned about Percona’s Monitoring & Management Server (PMM).
After trying the setup we are pretty satisfied with it’s performance as it fulfils all our expectations from any monitoring tool to monitor our applications and databases. We found the product best in terms of Cost (comes with an hourly price of only $ 0.10/hr), highly secure (with SSL encryption) and offers some really cool and smart features.
There are many features what it offers, but being a long time Performance Consultant (DBA) I personally found the ‘Query Analytics’ section more useful and impressive. It has got everything what you need to know for your real-time workload, it provides an in-depth analysis of your queries i.e. execution plan, latency information, query fingerprints etc. This can provide very useful at the time when you have any problem in hand and want to deep dive in and want to know what all is going on with your system at the statement level.
It has got great integration with Grafana platform too, great data visualizations in the form of dashboards etc.
I will recommend this tool for people who are looking for any good stable monitoring platform along with performance administration tool. Not only for PostgreSQL & MySQL but it’s available for other platforms too like Amazon RDS MySQL, Amazon Aurora MySQL, MongoDB, Percona XtraDB Cluster and ProxySQL.
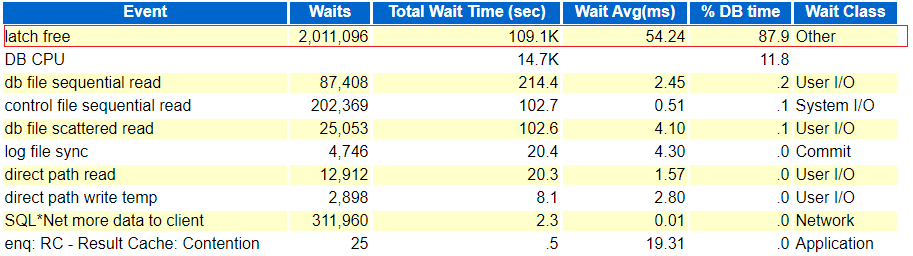
This is one of the latest issue that I will be discussing next where in one of the 12c (12.1.0.2.0) Non-RAC production box we suddenly started seeing a huge spike in database workload (or AAS). As usual I started with some live monitoring using scripts, OEM Performance page and tools and saw huge numbers of sessions waiting on ‘Latch Free’ (Others classed event) waits. Next I saw the event wait were contributing more than 87% of the total DBTime % with exceptionally high latch wait times of 54 ms (Yes, that’s too much for latch gets) and what else caught my eye was ‘enq: RC – Result Cache: Contention’ with average wait times of 19.31 ms.
But lets not jump directly to the conclusion, next I checked SQLs with excessive buffer scans (SQL Ordered by Gets) and saw the source statement that caused the mess with exceptionally high number of buffer scan requests and as you must be aware that each scan that you do in memory buffers (db buffer cache) you will have to acquire a latch for your scan. This one SQL was responsible for around 85% of total buffer reads or gets and interestingly within three hours of AWR report not even a single execution was completed.
Alright now next task was to identify the type of latch which was causing ‘latch free’ or latch shortage in the database. And for that I checked ‘Latch Statistics’ section and ‘Latch Sleep Breakdown’ subsection to see what latch was frequently missed to get and with more sleep requests, and I have got the culprit, ‘Result Cache: RC Latch’ was coming with huge Miss and sleep ratio. The latch was sleeping mainly for ‘Result Cache: Serialization12’ and little bit on ‘Result Cache: Serialization01’.
Next just to be double sure, I checked for P2 value for ‘Latch Free’ event which was coming as 559. So I queried V$Latchname to see if it’s matching the same what we identified so far. And yes, it was same RC Latch!
> SELECT latch#,name FROM gv$latchname WHERE latch#=559;

    LATCH# NAME
---------- ----------------------------------------------------------------
       559 Result Cache: RC Latch
You can do more deep down analysis and troubleshooting on such issues, Tanel Poder has written a great presentation for all who want to dig deep and want to pin point the addresses, code etc.
Download the copy of the document, click next –> Oracle_Latch_And_Mutex_Contention_Troubleshooting
Alright, now when the latch name, SQL is identified lets check more about the RESULT CACHE, and it’s set to MANUAL (parameter result_cache_mode) and this is strange. Next we saw that the SQL using the RC contains DS_SVC hints and are part of dynamic statistics activity.
Then I thought to look out for some official documentation on the same, and luckily found one official note from Oracle Doc ID 2002089.1 which is matching almost same with my problem.
And as per the document the workload we can apply is to disable the Adaptive Dynamic Statistics mechanism.
alter system set "_optimizer_ads_use_result_cache" = FALSE;
or else One-off Patch 26436717 can be requested and applied to fix the issue for a permanent fix.
Continuing the same subject/topic what I have started in my last post – Real Application Testing (RAT). This post is all about the ‘Capture‘ part what happens on the source database where we captures the workload which will later on replayed on the target database.
I have break it in to few easy steps to understand.
Step 1:
First we need to verify if the RAT option is installed and working fine. This you only need to verify upto 10Gr2 as all later versions comes with all features enabled by himself during the installation process, until you didn’t de-selected any specific feature during customized installation.
In case of 10g you need to check using v$option dynamic view for RAT parameter and there is a need to enable the parameter ‘pre_11g_enable_capture’.
Please see below the steps of verification!
Step 2:
Creating exclusion FILTERS (If Required) for capture.
This is the step where we create filters to exclude few of the system usernames and few of other schemas like SYSMAN, SYS and all of such schemas where you don’t want to capture load.
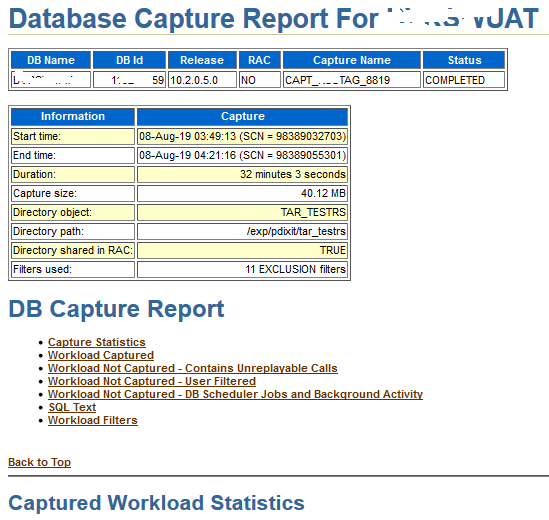
Please see the screenshot use to do the same.
Step 3:
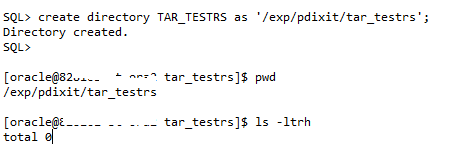
Creation of RAT specific OS based directory.
This is the place where all CAPTURE files will be saved and should be created like below.
Step 4:
Next, we can now start the CAPTURE process, this should be done using the main RAT specific procedure DBMS_WORKLOAD_CAPTURE and its function START_CAPTURE. Here the main parameter to pass is name (Name of the capture you want to name), dir (directory which will hold all workload files, the same what I have created above).
There are few parameters which I have intentionally not used i.e. DURATION as there is a BUG in 10Gr2 database which causes the capture not to stop even after specific time and had to manually stop the process. So in below example I will be capturing XXXXX minutes of load from this database and will stop it explicitly.
This being a staging setup I am taking around 30 minutes of workload but in real time this could be anything between 10 or 15 minutes of peak hours.
You can monitor the progress using DBA_WORKLOAD_CAPTURES view. See below.
Next, you can get more details about this ongoing capture activity. See below.
Step 5:
Next when we are done with the capturing of load for the specified time, we can go and stop it now. In my case on RS staging I left that running and capturing workload for ~ 32 Minutes.
Next, you can verify the contents by going to the RAT directory. There you will see .rec (recording) files, .wmd and a special report (TEXT/HTML format) will generate and is specific to CAPTURE process only.
Now we have BEGIN SNAP Id and END SNAP (time duration for the capture runtime) we can generate the AWR report as well.
The same report can be fetched via text method as well.
Step 6:
Next we will export the AWR data. This will be later on used to generate the comparison report from REPLAY side. This will create two more files under the capture directory wcr_ca.log and wcr_ca.dmp
Next steps starts at the target end or the host and deserves a separate post.
I will soon be writing about Replay process in my next post. Till that time keep learning!
As committed I am back with the first edition or the post on Oracle RAT (Real Application Testing) and there be couple more follow up chapters on the same in next few days or weeks.
Alright, recently during one of our mission-critical production database migration we reached a point where we had to perform the Load Test before pushing the real-time workload on to this new system. I was asked to prepare the strategy and to pick the best possible tool to access the performance of the performance of this new system and how it will respond to the current traffic.
Received lot’s of suggestions from rest of the team, i.e. Swingbench, Loadrunner, Orion etc. but most of them are with a predefined set of Supplied Benchmarks though few are customized but are more related to the server performance and bechmarking but not at the Database or SQL level. And considering the notorious behavior of many of the custom code and legacy application modules I was more leaned towards picking a tool which covers both Database and SQL, and we finally agreed on Oracle RAT.
Oracle Real Application Testing, an option that comes with Oracle Enterprise Edition. Oracle Real Application Testing helps you to test the real-life workload after changes on the database such as database upgrades, OS upgrades, parameter changes, hardware replacement, etc. So, in short the Oracle RAT will be system stress test tool to simulate production load. Introduced in Oracle 11g Release 1. But yes, it’s not free and comes with additional cost and licenses.
There are two features “Database Replay” and “SQL Performance Analyzer” will help fine-tuning on the database before passing production.
I will cover more about the ‘Database Replay’ feature here and might cover the ‘SQL Performance Analyzer’ feature later.
When can you use RAT – “Database Replay” feature?
System Changes
– Hardware replacement such as CPU, RAM, etc.
– Database and OS upgrades
– Storage changes (OCFS2 – ASM)
– OS changes (Windows – Linux)
Configuration Changes
– Single Instance – RAC– Patch installation– Database parameter change
Which database versions are supported?
The workload capture process is supported on the Oracle Database 10g R2 (10.2.0.4) and above versions. The worload replay process is supported on the Oracle Database 11g R1 and above versions.
How to do it, where to start and all ?
Well there are two different ways you can perform the RAT (DB Replay) testing
– Using Oracle Enterprise Manager (OEM) : This option is entirely GUI based where you select your source and target systems and by doing all those clicks performs this stress/load testing on the system.
– Using command line way (My preferred way of doing this, yes I am ‘old school’) using DBMS_WORKLOAD_CAPTURE & DBMS_WORKLOAD_REPLAY procedures.
Some High Level Steps:
– Capture workload into capture files (In the form of .rec files, are flat files)
– Copy files to test system and preprocess them (to make them machine understandable)
– Replay files on test system (play the recorded files)
– Perform detailed analysis of workload capture and replay using reports generated by Database Replay. (Reporting for bench markings)
ON SOURCE System:
dbms_workload_capture.start_capture
dbms_workload_capture.finish_capture;
Copy the workload files to the client system. For example: – /home/oracle/rat/test1
On TARGET System:
1. dbms_workload_replay.process_capture
2. dbms_workload_replay.initialize_replay
3. dbms_workload_replay.prepare_replay
4. Run the workload client to calibrate the replay. The calibration process (mode=CALIBRATE) recommends the number of client processes required to perform the replay
5. Replay the workload using below command.
dbms_workload_replay.start_replay;
Components: The ARCHITECTURE (Simplified)
DB REPLAY “The Big Picture”
What is a Workload Client ?
The REPLAY uses wrc clients – Which are multi-threaded JAVA clients and can be started on the same machine/host or on separate hosts.
Will cover about them more in depth in future posts.
[oracle@PDIXIT:RAT]$ wrc system/XXXX mode=calibrate replaydir=/DBCapture/RAT/RAT_13DEC15_19_17
 Workload Replay Client: Release 11.2.0.4.0 - Production on Sat Dec 16 05:50:39 2015
Copyright (c) 1982, 2011, Oracle and/or its affiliates.  All rights reserved.


Report for Workload in: /DBCapture/RAT/RAT_13DEC16_19_17
-----------------------
Recommendation:
Consider using at least 13 clients divided among 4 CPU(s)
You will need at least 168 MB of memory per client process.
If your machine(s) cannot match that number, consider using more clients.

Workload Characteristics:
- max concurrency: 575 sessions
- total number of sessions: 1729

Assumptions:
- 1 client process per 50 concurrent sessions
- 4 client process per CPU
- 256 KB of memory cache per concurrent session
- think time scale = 100
- connect time scale = 100
- synchronization = TRUE
Now how to compare/benchmark ?
At the end of both CAPTURE & REPLAY methods you need to generate few process specific report.
Few of the important files that help in benchmarking are:
AWR Reports: Generate the AWR reports for the same time interval when we have any of the two process were in progress. The BEGIN AND END Snaps can be collected from DBA_WORKLOAD_CAPTURES & DBA_WORKLOAD_REPLAYS
CAPTURE/REPLAY Reports: These reports are specific to workload capture and playing on target.
Capture Vs Replay reports.
Today’s topic of discussion is to handle/fix one of the issues that I’d faced while generating RAT (real application testing) reports on 10gR2 database. I know many of us are not yet aware about the tool, it’s purpose and functionality. Very soon I will be writing about this great product from Oracle for database load testing using real/genuine workload and is quite helpful to forecast your DB performance before you migrate.
Alright, coming back to the point – I was trying to generate the RAT Capture report (on target of course) to see what all was there in the capture, its observations, highlights and rest and that’s when we’ve encountered an error (pasted below)
DECLARE
l_report CLOB;
BEGIN
l_report := DBMS_WORKLOAD_CAPTURE.report(capture_id => 81,
format => DBMS_WORKLOAD_CAPTURE.TYPE_HTML);
END;
/ 2 3 4 5 6 7
DECLARE
*
ERROR at line 1:
ORA-06502: PL/SQL: numeric or value error: character string buffer too small
ORA-06512: at "SYS.DBMS_SWRF_REPORT_INTERNAL", line 7446
ORA-06512: at "SYS.DBMS_SWRF_REPORT_INTERNAL", line 8591
ORA-06512: at "SYS.DBMS_SWRF_REPORT_INTERNAL", line 8521
ORA-06512: at "SYS.DBMS_WORKLOAD_CAPTURE", line 486
ORA-06512: at "SYS.DBMS_WORKLOAD_CAPTURE", line 1214
ORA-06512: at line 4
There are two solutions to this problem:
1. First to drop the common (shared by capture and replay) schemas and their infrastructure tables using below two scripts.
That firstscript below drop schema tables shared by capture and replay and second drops the Capture infrastructure tables.
catwrr.sql – Catalog script for Workload Capture and Replay — this script then rebuilds all the capture and replay related tables.
@@?/rdbms/admin/catnowrr.sql
@@?/rdbms/admin/catwrr.sql
exec prvt_report_registry.register_clients(TRUE); --- This one registers clients
Note: In that case you might loss all of your previous capture ID details from the system as it simply washes or wipes everything there related with RAT tables. Hence this is kind of a crude and a raw method to fix this issue. And I recommend to always connect with Oracle Support before going to run these scripts on your database!
2. I tried of another approach to avoid this error and generate the RAT capture report from the target instead of Source where we were getting the error.
Is that possible ?? — Yes, you can. After further analysis I found the issue is with the 10gR2 capture reporting code which sometimes throws this error.
So, the second way turned ut to be a better approach here as we have all of our previous stats and data untouched and nothing has been wiped out in this case, as we simply ran the reporting procedure from the target (12c R2 in our case) and that’s how avoided the issue.
Last week we finished migration for one of the customer who recently purchased the Oracle Exadata Machines (X6-2), after that complex data movement is successfully completed we observed some great performance improvements without actually making any changes and exadata features in action.
But its not that the Exa machines are ‘In-frangible’ Or Unbreakable. There are many of the times when you actually have to understand the Cell/Computer Nodes or system wide performance and output from tools like Sundiag, Exawatcher, Exachk, TFA, SOS report etc. were not sufficient.
For the purpose of ‘Cell Performance DIAG info’ Oracle has provided a script to collect Exadata Cell Performance statistics which you can use to interpret the issues.
Output of the script is distributed into several sections
1. Cell specific parameters
2. Top CELL waits with wait times (Worst Times)
3. Cell Configuration details
Script to Collect Exadata Cell Performance Information (cellperfdiag.sql) (Doc ID 2038493.1)
Below is the output from one of the Cell Node of a lower environment.