Tales From A Lazy Fat DBA

Its all about Databases, their performance, troubleshooting & much more …. ¯\_(ツ)_/¯

Posts Tagged ‘optimization’

When Linux Swaps Away My Sleep – MySQL, RHEL8, and the Curious Case of High Swap Usage

Posted by FatDBA on December 12, 2025

I remember an old instance where I’d got an alert that one of production MySQL servers had suddenly gone sluggish after moved to RHEL 8 from RHEL7. On checking, I found something odd … the system was consuming swap heavily, even though there was plenty of physical memory free.

Someone who did the first time deployment years before, left THP as enabled and with default swapiness … but this setting that had worked perfectly for years on RHEL 7, but now, after the upgrade to RHEL 8.10, the behavior was completely different.

This post is about how that small OS level change turned into a real performance headache, and what we found after some deep digging.

The server in question was a MySQL 8.0.43 instance running on a VMware VM with 16 CPUs and 64 GB RAM. When the issue began, users complained that the database was freezing randomly, and monitoring tools were throwing high load average and slow query alerts.

Let’s take a quick look at the environment … It was a pretty decent VM, nothing under sized.

$ cat /etc/redhat-release
Red Hat Enterprise Linux release 8.10 (Ootpa)

$ uname -r
4.18.0-553.82.1.el8_10.x86_64

$ uptime
11:20:24 up 3 days, 10:57,  2 users,  load average: 4.34, 3.15, 3.63

$ grep ^CPU\(s\) sos_commands/processor/lscpu
CPU(s): 16

When I pulled the SAR data for that morning, the pattern was clear ..There were long stretches on CPU where %iowait spiked above 20-25%, and load averages crossed 400+ during peak time! The 09:50 slot looked particularly suspicious .. load average jumped to 464 and remained high for several minutes.

09:00:01 %usr=26.08  %iowait=22.78  %idle=46.67
09:40:01 %usr=29.04  %iowait=24.43  %idle=40.11
09:50:01 %usr=7.55   %iowait=10.07  %idle=80.26
10:00:01 %usr=38.53  %iowait=19.54  %idle=35.32

Here’s what the memory and swap stats looked like:

# Memory Utilization
%memused ≈ 99.3%
Free memory ≈ 400 MB (on a 64 GB box)
Swap usage ≈ 85% average, hit 100% at 09:50 AM

That was confusing.. MySQL was not leaking memory, and there was still >10 GB available for cache and buffers. The system was clearly pushing pages to swap even though it didn’t need to. That was the turning point in the investigation.

At the same time, the reporting agent started reporting MySQL timeouts:

 09:44:09 [mysql] read tcp xxx.xx.xx.xx:xxx->xxx.xxx.xx.xx:xxxx: i/o timeout
 09:44:14 [mysql] read tcp xx.xx.xx.xxxx:xxx->xx.xx.xx.xx.xx:xxx: i/o timeout

And the system kernel logs showed the familiar horror lines for every DBA .. MySQL threads were being stalled by the OS. This aligned perfectly with the time when swap usage peaked.

 09:45:34 kernel: INFO: task mysqld:5352 blocked for more than 120 seconds.
 09:45:34 kernel: INFO: task ib_pg_flush_co:9435 blocked for more than 120 seconds.
 09:45:34 kernel: INFO: task connection:10137 blocked for more than 120 seconds.

I double-checked the swappiness configuration:

$ cat /proc/sys/vm/swappiness
1

So theoretically, swap usage should have been minimal. But the system was still paging aggressively. Then I checked the cgroup configuration (a trick I learned from a Red Hat note) .. And there it was more than 115 cgroups still using the default value of 60! … In RHEL 8, memory management moved more toward cgroup v2, which isolates memory parameters by control group.

So even if /proc/sys/vm/swappiness is set to 1, processes inside those cgroups can still follow their own default value (60) and this explained why the system was behaving like swappiness=60 even though the global value was 1.

$ find /sys/fs/cgroup/memory/ -name *swappiness -exec cat {} \; | uniq -c
      1 1
    115 60

In RHEL 8, memory management moved more toward cgroup v2, which isolates memory parameters by control group. So even if /proc/sys/vm/swappiness is set to 1, processes inside those cgroups can still follow their own default value (60). This explained why the system was behaving like swappiness=60 even though the global value was 1.

Once the root cause was identified, the fix was straightforward — Enforced global swapiness across CGroups

Add this to /etc/sysctl.conf:

vm.force_cgroup_v2_swappiness = 1

Then reload:
sysctl -p

This forces the kernel to apply the global swappiness value to all cgroups, ensuring consistent behavior. Next, we handled THP that is always expected to cause intermittent fragmentation and stalls in memory intensive workloads like MySQL, Oracle, PostgreSQL and even in non RDBMSs like Cassandra etc., we disabled the transparent huge pages and rebooted the host.

In short what happened and was the root cause.

  • RHEL8 introduced a change in how swappiness interacts with cgroups.
  • The old /proc/sys/vm/swappiness setting no longer applies universally.
  • Unless explicitly forced, MySQL’s cgroup keeps the default swappiness (60).
  • Combined with THP and background I/O, this created severe page cache churn.

So the OS upgrade, not MySQL, was the real root cause.

Note: https://access.redhat.com/solutions/6785021

Hope It Helped!
Prashant Dixit

Posted in Uncategorized | Tagged: , , , , , , , | Leave a Comment »

Oracle AWR Scripts Decoded .. No More Guessing!

Posted by FatDBA on July 29, 2025

Recently, someone asked me why there are so many AWR-like files in the directory and whether they are as useful as the well-known awrrpt.sql. I took the opportunity to explain what I knew about them and their purpose. Since I thought it could be helpful, I decided to share this insight with my readers as well.

If you’re into performance tuning in Oracle, very likey you’ve already used AWR reports. But then you open this directory: $ORACLE_HOME/rdbms/admin …. …and boom – you’re hit with a list of cryptic scripts: awrrpt.sql, awrgdrpi.sql, awrsqrpt.sql, awrextr.sql

What do they all do?
When should you use which one?
Why are they named like 90s DOS files 🙂 ?

Let’s keep it short and sharp. Here’s your point-to-point breakdown of the most important AWR scripts.

Before you go running any of these scripts – make sure you have the Oracle Diagnostic Pack license.
AWR stuff is not free.

I grouped them into logical chunks – reports, comparisons, SQLs, data movement, etc.

Performance Reports

These are the most common AWR reports you run to analyze performance between 2 snapshots.

ScriptWhat it does
awrrpt.sqlGenerates AWR report for the current instance (for single instance DBs)
awrrpti.sqlSame as above, but lets you select another DBID or instance (useful for RAC)
awrgrpt.sqlAWR Global Report – gives a full RAC-wide view
awrgrpti.sqlSame as above, but lets you pick another DBID/instance

Example:
You’re troubleshooting high CPU on node 2 of your RAC? Use awrrpti.sql.

Comparison Reports

These help you compare two different time ranges – maybe before and after a patch, or different load periods.

ScriptWhat it does
awrddrpt.sqlCompares two AWR snapshots (date diff) – for a single instance
awrddrpi.sqlSame as above, for another dbid/instance
awrgdrpt.sqlGlobal RAC diff report (current RAC)
awrgdrpi.sqlGlobal RAC diff report (another dbid/instance)

Use these when you wanna say, “Hey, this new code made the DB slower… prove it!”

Want to see what a particular SQL is doing? These are your tools.

ScriptWhat it does
awrsqrpt.sqlSQL report for a specific SQL_ID in the current instance
awrsqrpi.sqlSame thing but lets you pick another dbid/instance

You’ll be surprised how useful this is when hunting bad queries.

Sometimes, you need to take AWR data from one system and analyze it somewhere else (like test or dev).

ScriptWhat it does
awrextr.sqlExport AWR data using datapump
awrload.sqlImport AWR data using datapump

This is actually gold when working on performance issues across environments.

Helper / Utility Scripts

These are mostly helper scripts to define input or make reports more automated or interactive.

ScriptWhat it does
perfhubrpt.sqlGenerates a fancy interactive Performance Hub report
awrinpnm.sqlInput name helper for AWR
awrinput.sqlGet inputs before running AWR reports
awrddinp.sqlInput helper for diff reports
awrgdinp.sqlInput helper for RAC diff reports

What’s with these weird script names?

Yeah, all these awrsqrpi.sql, awrgdrpt.sql, etc. – they look like random garbage at first.
But there’s actually some logic.

Here’s how to decode them:

AbbreviationMeans
awrAutomatic Workload Repository
rpt or rpReport
iLets you select specific instance or DBID
gGlobal report for RAC
d or ddDiff reports (comparing two snapshots)
sqSQL
inpInput helper

So awrsqrpi.sql = AWR SQL Report for a different instance
And awrgdrpi.sql = AWR Global Diff Report for another DBID/instance

So Which Script Should I Use?

Here’s a quick cheat sheet:

TaskScript
Normal AWR report (single instance)awrrpt.sql
AWR report for RAC (global view)awrgrpt.sql
SQL performance reportawrsqrpt.sql
Compare two AWR reportsawrddrpt.sql
Export/import AWR dataawrextr.sql and awrload.sql

If you’re doing anything with RAC – prefer the ones with g in them.
If you’re automating – use the *inp*.sql files.

Final Thoughts

Yes, the names are ugly.
Yes, the syntax is old-school.
But honestly? These AWR scripts are still some of the best tools you have for DB performance analysis.

Just remember:

  • Don’t use them without a valid license
  • Learn the naming pattern once – and it gets way easier
  • Practice running different ones on test systems

And next time someone complains, “The database is slow” … you know exactly which script to run.

Hope It Helped!
Prashant Dixit
Database Architect @RENAPS
Reach us at : https://renaps.com/

Posted in Uncategorized | Tagged: , , , , , , , | Leave a Comment »

No Hint, No Degree, No Auto-DOP, Why my query is going for the parallelism ?

Posted by FatDBA on December 16, 2022

Recently I was working on a performance problem where customer reported few of their SQL statements going for parallelism even when they are not forcing DOP via any HINT, and all of the referenced table and underlying Indexes were with degree=1

I was asked to take a look, and I immediately checked if Auto DOP was the reason forcing unwanted parallelism, but parallel_degree_policy was set to MANUAL which means the auto DOP, statement queuing and in-memory parallel execution all were disabled.

SQL> show parameter parallel_degree_policy

NAME                                 TYPE        VALUE
------------------------------------ ----------- ------------------------------
parallel_degree_policy               string      MANUAL

Next, I thought to verify Table and Indexes general stats or details and I queried DBA_TABLES & DBA_INDEXES for Instances column, and found one of the table was set to value ‘DEFAULT’. If we have a value of DEFAULT set for INSTANCES, it will always force the query use DEFAULT degree of parallelism.

Let me explain the impact of having DEFAULT value for Instances, and how it forces SQL to spawn parallelism. For demo purpose, I am going to create a test table and an index with INSTANCES value set to DEFAULT.

[oracle@oracleontario ~]$ sqlplus / as sysdba

SQL*Plus: Release 19.0.0.0.0 - Production on Mon Dec 19 08:23:12 2022
Version 19.15.0.0.0

Copyright (c) 1982, 2022, Oracle.  All rights reserved.


SQL> create table fatdba_table as select * from dba_objects;

Table created.

SQL>
SQL> select count(*) from fatdba_table;

  COUNT(*)
----------
     74932

SQL>

SQL> create index fatdba_table_idx on fatdba_table(OBJECT_TYPE,object_name) parallel(DEGREE 1 INSTANCES DEFAULT);

Index created.

SQL>
SQL> select index_name,degree,instances from dba_indexes where index_name='FATDBA_TABLE_IDX';

INDEX_NAME                     DEGREE                                   INSTANCES
------------------------------ ---------------------------------------- ----------------------------------------
FATDBA_TABLE_IDX               1                                        DEFAULT

SQL>

Alright the stage is set, lets run a SQL statement and force it to use that Index and see its impact on the execution.

SQL> explain plan for select /*+ index_ffs(fatdba_table,fatdba_table_idx) */ count(distinct object_name) from fatdba_table 
where OBJECT_TYPE='TABLE';

Explained.

SQL> set linesize 400 pagesize 400
SQL> select * from table(dbms_xplan.display) ;

PLAN_TABLE_OUTPUT
--------------------------------------------------------------------------------------------------------------------------------
Plan hash value: 1154043599

-------------------------------------------------------------------------------------------------------------------------------
| Id  | Operation                     | Name             | Rows  | Bytes | Cost (%CPU)| Time     |    TQ  |IN-OUT| PQ Distrib |
-------------------------------------------------------------------------------------------------------------------------------
|   0 | SELECT STATEMENT              |                  |     1 |    66 |   157   (1)| 00:00:01 |        |      |            |
|   1 |  SORT AGGREGATE               |                  |     1 |    66 |            |          |        |      |            |
|   2 |   PX COORDINATOR              |                  |       |       |            |          |        |      |            |
|   3 |    PX SEND QC (RANDOM)        | :TQ10001         |     1 |    66 |            |          |  Q1,01 | P->S | QC (RAND)  |
|   4 |     SORT AGGREGATE            |                  |     1 |    66 |            |          |  Q1,01 | PCWP |            |
|   5 |      VIEW                     | VW_DAG_0         |  1558 |   100K|   157   (1)| 00:00:01 |  Q1,01 | PCWP |            |
|   6 |       HASH GROUP BY           |                  |  1558 | 68552 |   157   (1)| 00:00:01 |  Q1,01 | PCWP |            |
|   7 |        PX RECEIVE             |                  |  1561 | 68684 |   156   (0)| 00:00:01 |  Q1,01 | PCWP |            |
|   8 |         PX SEND HASH          | :TQ10000         |  1561 | 68684 |   156   (0)| 00:00:01 |  Q1,00 | P->P | HASH       |
|   9 |          PX BLOCK ITERATOR    |                  |  1561 | 68684 |   156   (0)| 00:00:01 |  Q1,00 | PCWC |            |
|* 10 |           INDEX FAST FULL SCAN| FATDBA_TABLE_IDX |  1561 | 68684 |   156   (0)| 00:00:01 |  Q1,00 | PCWP |            |
-------------------------------------------------------------------------------------------------------------------------------

Predicate Information (identified by operation id):
---------------------------------------------------

  10 - filter("OBJECT_TYPE"='TABLE')

22 rows selected.

SQL>

As expected, it forced SQL to go with parallelism. Let me set INSTANCE value of the Index to 1 and see what happens next.

SQL> alter index FATDBA_TABLE_IDX noparallel;

Index altered.

SQL> select index_name,degree,instances from dba_indexes where index_name='FATDBA_TABLE_IDX';


INDEX_NAME                     DEGREE                                   INSTANCES
------------------------------ ---------------------------------------- ----------------------------------------
FATDBA_TABLE_IDX               1                                        1

SQL> SQL>


SQL> select index_name,degree,instances from dba_indexes where index_name='FATDBA_TABLE_IDX';


INDEX_NAME                     DEGREE                                   INSTANCES
------------------------------ ---------------------------------------- ----------------------------------------
FATDBA_TABLE_IDX               1                                        1

SQL> SQL> explain plan for select /*+ index_ffs(fatdba_table,fatdba_table_idx) */ count(distinct object_name) 
from fatdba_table where OBJECT_TYPE='TABLE';

Explained.

SQL> select * from table(dbms_xplan.display) ;

PLAN_TABLE_OUTPUT
------------------------------------------------------------------------------------------------------
Plan hash value: 3184007477

--------------------------------------------------------------------------------------------
| Id  | Operation               | Name             | Rows  | Bytes | Cost (%CPU)| Time     |
--------------------------------------------------------------------------------------------
|   0 | SELECT STATEMENT        |                  |     1 |    66 |   157   (1)| 00:00:01 |
|   1 |  SORT AGGREGATE         |                  |     1 |    66 |            |          |
|   2 |   VIEW                  | VW_DAG_0         |  1558 |   100K|   157   (1)| 00:00:01 |
|   3 |    HASH GROUP BY        |                  |  1558 | 68552 |   157   (1)| 00:00:01 |
|*  4 |     INDEX FAST FULL SCAN| FATDBA_TABLE_IDX |  1561 | 68684 |   156   (0)| 00:00:01 |
--------------------------------------------------------------------------------------------

Predicate Information (identified by operation id):
---------------------------------------------------

   4 - filter("OBJECT_TYPE"='TABLE')

16 rows selected.

And no parallelism was used after set the value of INSTANCES to 1.

Hope It Helped!
Prashant Dixit

Posted in Advanced, troubleshooting | Tagged: , , , | Leave a Comment »

Differences I have noticed in the Query Block Registry section of an execution plan between Oracle 19c and 21c

Posted by FatDBA on October 10, 2022

Hi Guys,

Todays post is a quick one about the difference that I have noticed in one of the extended execution plan section ‘Query block registry‘ between Oracle 19c (19.8) and Oracle 21c (21.3). I am not going to explain about query blocks etc. here as I’ve already made few blog posts on those topics in the past, this one is about the difference that you will observe between two said database versions for QBR section in execution plans.

First I am going to use the option/flag ‘qbregistry‘ (for Query block registry info) in Oracle database version 19.16, and next will repeat same steps in Oracle 21.3. Query block registy information can also be collect from the 10053 optimizer traces, but I always notice that one’s there in CBO traces are more repetitive that what you see as a concise version through execution plans with ‘qbregistry‘ option.

So, I have already set the playground, for testing purpose, created two sample tables and have written two outer join queries. One for each table. Then combining the results of these using union all.

--
-- In Oracle 19.16 Database
--
SQL*Plus: Release 19.0.0.0.0 - Production on Sun Oct 9 03:17:19 2022
Version 19.8.0.0.0

SQL> explain plan for select /*+ GATHER_PLAN_STATISTICS */ *
from   toys, bricks
where  toy_id = brick_id (+)
union all
select *
from   toys, bricks
where  toy_id (+) = brick_id
and    toy_id is null;  

Explained.


SQL> select * from table(dbms_xplan.display('PLAN_TABLE',NULL,'+alias +outline +qbregistry'));

PLAN_TABLE_OUTPUT
--------------------------------------------------------------------------------
Plan hash value: 731550672

-------------------------------------------------------------------------------
| Id  | Operation            | Name   | Rows  | Bytes | Cost (%CPU)| Time     |
-------------------------------------------------------------------------------
|   0 | SELECT STATEMENT     |        |     6 |   354 |     8   (0)| 00:00:01 |
|   1 |  UNION-ALL           |        |       |       |            |          |
|*  2 |   HASH JOIN OUTER    |        |     3 |   177 |     4   (0)| 00:00:01 |
|   3 |    TABLE ACCESS FULL | TOYS   |     3 |    96 |     2   (0)| 00:00:01 |
|   4 |    TABLE ACCESS FULL | BRICKS |     3 |    81 |     2   (0)| 00:00:01 |
|*  5 |   FILTER             |        |       |       |            |          |
|*  6 |    HASH JOIN OUTER   |        |     3 |   177 |     4   (0)| 00:00:01 |
|   7 |     TABLE ACCESS FULL| BRICKS |     3 |    81 |     2   (0)| 00:00:01 |
|   8 |     TABLE ACCESS FULL| TOYS   |     3 |    96 |     2   (0)| 00:00:01 |
-------------------------------------------------------------------------------

Query Block Name / Object Alias (identified by operation id):
-------------------------------------------------------------

   1 - SET$1
   2 - SEL$1
   3 - SEL$1 / TOYS@SEL$1
   4 - SEL$1 / BRICKS@SEL$1
   5 - SEL$2
   7 - SEL$2 / BRICKS@SEL$2
   8 - SEL$2 / TOYS@SEL$2

Outline Data
-------------

  /*+
      BEGIN_OUTLINE_DATA
      USE_HASH(@"SEL$1" "BRICKS"@"SEL$1")
      LEADING(@"SEL$1" "TOYS"@"SEL$1" "BRICKS"@"SEL$1")
      FULL(@"SEL$1" "BRICKS"@"SEL$1")
      FULL(@"SEL$1" "TOYS"@"SEL$1")
      USE_HASH(@"SEL$2" "TOYS"@"SEL$2")
      LEADING(@"SEL$2" "BRICKS"@"SEL$2" "TOYS"@"SEL$2")
      FULL(@"SEL$2" "TOYS"@"SEL$2")
      FULL(@"SEL$2" "BRICKS"@"SEL$2")
      OUTLINE_LEAF(@"SET$1")
      OUTLINE_LEAF(@"SEL$2")
      OUTLINE_LEAF(@"SEL$1")
      ALL_ROWS
      DB_VERSION('19.1.0')
      OPTIMIZER_FEATURES_ENABLE('19.1.0')
      IGNORE_OPTIM_EMBEDDED_HINTS
      END_OUTLINE_DATA
  */

Predicate Information (identified by operation id):
---------------------------------------------------

   2 - access("TOY_ID"="BRICK_ID"(+))
   5 - filter("TOY_ID" IS NULL)
   6 - access("TOY_ID"(+)="BRICK_ID")

Note
-----
   - dynamic statistics used: dynamic sampling (level=2)

Query Block Registry:
---------------------
<q o="2" f="y"><n><![CDATA[SET$1]]></n><f><h><t><![CDATA[NULL_HALIAS]]></t><s><![CDATA[SET$1]]></s></h></f></q>
<q o="2" f="y"><n><![CDATA[SEL$1]]></n><f><h><t><![CDATA[BRICKS]]></t><s><![CDATA[SEL$1]]></s></h><h><t><![CDATA[TOYS]]></t><s><![CDATA[SEL$1]]> </s></h></f></q>
<q o="2" f="y"><n><![CDATA[SEL$2]]></n><f><h><t><![CDATA[BRICKS]]></t><s><![CDATA[SEL$2]]></s></h><h><t><![CDATA[TOYS]]></t><s><![CDATA[SEL$2]]> </s></h></f></q>

73 rows selected.

SQL>
SQL> 

Above ‘Query Block Registry’ XML translates to something like this
SET$1 NULL_HALIAS|SET$1
SEL$1 BRICKS|SEL$1|TOYS|SEL$1
SEL$2 BRICKS|SEL$2|TOYS|SEL$2

Considering we have a two SELECT statements, one for each table, internally optimizer has created two query blocks SEL$1 and SEL$2, one for each of the select. Here its using a hint alias name ‘NULL_HALIAS‘, and points to both of the two SELECT statements used in the original query.

Next, lets execute the same statement in Oracle 21c (21.3.0) version and see the difference in QBR section.

--
-- In Oracle 21.3 Database
--
-- Skipping few sections to have more clarity about discussed topic
SQL*Plus: Release 21.0.0.0.0 - Production on Sat Oct 8 23:57:12 2022
Version 21.3.0.0.0

SQL>  select * from table(dbms_xplan.display('PLAN_TABLE',NULL,'+alias +outline +qbregistry'));

PLAN_TABLE_OUTPUT
----------------------------------------------------------------------------------------------------------------------------------------------------------------------------------------------------------------------------------------------------------------------------------------------------------------------------------------------------------------------------------------------------------------
Plan hash value: 731550672
...
.....
Query Block Name / Object Alias (identified by operation id):
-------------------------------------------------------------

   1 - SET$1
   2 - SEL$1
   3 - SEL$1 / "TOYS"@"SEL$1"
   4 - SEL$1 / "BRICKS"@"SEL$1"
   5 - SEL$2
   7 - SEL$2 / "BRICKS"@"SEL$2"
   8 - SEL$2 / "TOYS"@"SEL$2"

Outline Data
-------------
......
Predicate Information (identified by operation id):
---------------------------------------------------
.....

Query Block Registry:
---------------------

  SEL$1 (PARSER) [FINAL]
  SEL$2 (PARSER) [FINAL]
  SET$1 (PARSER) [FINAL]

SQL>

Here with 21c (21.3), first thing is its no more coming in the form of an XML, The curious part out of the entire output is the ‘Query Block Registry‘ where the [FINAL] is the transformation that is chosen by the CBO. This assures that time was used on a query block which has been selected for an optimal plan.

That’s it, just a small tidbit this time! 🙂

Hope It Helped!
Prashant Dixit

Posted in Advanced, troubleshooting | Tagged: , , , , | Leave a Comment »

What is a _FIX_CONTROL & DBMS_OPTIM_BUNDLE in Oracle ?

Posted by FatDBA on July 17, 2022

Lately I was in discussion with one of my friend who was facing an issue with Oracle 19c database where the vendor asked him to apply a patch to fix the problem, but he did not want to apply that single patch because their Oracle homes were shared and he didn’t want to increase the complexity of their patching cycles. Then later on Oracle suggested them to try a workaround which requires a setting using fix controls.

So many times Oracle recommends to set a fix control in case of a bug fix, but what exactly are they ? Their purpose ? & tools and methods to control these bug fixes ? This post is all about explaining all of them in detail.

So, What are they ? – Fix controls are bug fix control parameters introduced in 10.2 and they are typically used to enable/disable certain bug fixes in Oracle database. You cannot pull-back any patch, the patch you trying must have the option to use _FIX_CONTROL, and must be visible under V$SYSTEM_FIX_CONTROL views.

Let’s understand this using one of the case where mview push predicate was not happening due to wrong cardinality estimate in one of the production system running on 12.1.0.2. It was rejecting join predicate pushdown (JPPD) transformations and this was avoiding view to be joined with index-based nested-loop join method and causing issues. This was happening all due to bug 21802552. Let’s check if the bug number is present in fix control views and what’s its status.

SQL> select bugno, value, description from v$system_fix_control where bugno=21802552;

     BUGNO      VALUE DESCRIPTION
---------- ---------- ----------------------------------------------------------------------
  21802552          1 correct cardinality adjusted by DS

-- You can get similar information using DBMS_SQLDIAG.GET_FIX_CONTROL(BUG NUMBER) proc as well.

So, its there in the view’s output and its enabled (value 1), and we can turn it off, lets do it. A proper syntax of using them is given below.

-- To enable:
"_fix_control"='Bugno:ON'    (OR)   "_fix_control"="Bugno:1"

-- To disable:
"_fix_control"='Bugno:OFF'  (OR)   "_fix_control"="Bugno:0"


SQL> ALTER SYSTEM SET "_fix_control" = '21802552:OFF';

System altered.

SQL>

SQL> select bugno, value, description from v$system_fix_control where bugno=21802552;

     BUGNO      VALUE DESCRIPTION
---------- ---------- ----------------------------------------------------------------------
  21802552          0 correct cardinality adjusted by DS


-- same was recorded in alert log file as well

2022-07-16T09:04:02.371313-04:00
ALTER SYSTEM SET _fix_control='21802552:OFF' SCOPE=BOTH;

You can do the same using the new dbms_optim_bundle.set_fix_controls package, it was introduced in 12.1.0.2 to implement Oracle’s approach of ‘Automatic Fix Control Persistence’ framework. Let’s try to the same using said package.

-- This will set given _fix_controls in scope=BOTH on all instances
-- Lets enable it again before we disable it back again
SQL> exec dbms_optim_bundle.set_fix_controls('21802552:1','*', 'BOTH', 'NO');

PL/SQL procedure successfully completed.

SQL> select bugno, value, description from v$system_fix_control where bugno=21802552;

     BUGNO      VALUE DESCRIPTION
---------- ---------- ----------------------------------------------------------------------
  21802552          1 correct cardinality adjusted by DS


-- Lets roll it back
SQL> exec dbms_optim_bundle.set_fix_controls('21802552:0','*', 'BOTH', 'NO');

PL/SQL procedure successfully completed.

SQL> select bugno, value, description from v$system_fix_control where bugno=21802552;

     BUGNO      VALUE DESCRIPTION
---------- ---------- ----------------------------------------------------------------------
  21802552          0 correct cardinality adjusted by DS

--
-- Entry in parameter file made by the dbms_optim_bundle package for fix control
*._fix_control='21802552:0'#added through dbms_optim_bundle package


Hope It Helped!
Prashant Dixit

Posted in Advanced, troubleshooting | Tagged: , , , | Leave a Comment »

High stats collection time for partitioned tables after upgrade to 19c

Posted by FatDBA on July 2, 2022

Recently, while working on a database upgrade from 12c to 19c (19.15) one of my friend encountered a strange issue on the newly upgraded 19c database where the stats gathering on the full database started taking huge time. It used to take ~ 3 hours to complete the full database statistics, but the same stats collection job after the upgrade to 19c started taking close to 10 hours. The stats collection script they were using was quite simple and with minimal parameters used.

EXEC DBMS_STATS.GATHER_DATABASE_STATS(ESTIMATE_PERCENT=>DBMS_STATS.AUTO_SAMPLE_SIZE,degree => 8);

During the analysis he observed that the top 3-4 in-flight transactions during stats collection were related to the Index Statistics and were found doing ‘Index Fast Full Scan’, and all of them are on few of the large partitioned tables in the database. He discussed the case with me and together tried few thing i.e. recollected dictionary and fixed object statistics, did some comparative study of parameters between 12c and 19c but none of them worked. At last we tried to set debugging levels on DBMS_STATS to see what’s happening under the hood, and that gave us some hint when set it with level/flag 8 (trace index stats) and with level 32768 to trace approximate NDV (number distinct values) gatherings. Traces gave us some idea that its surely with the index stats and NDV or number of distinct keys and is taking time.

But even after that we both were totally clueless as these Tables and its dependent objects are there in the system for a very long time. So. the big question was – What’s new in 19c that has slowed down stats collection ?

Finally we decided to contact OCS! And they quickly responded to the problem as its a known problem with the 19c. As per them, there was an enhancement in 19c that is related to Index stats gathering, and that had lead to the longer stats times. It was all due to an unpublished Bug 33427856 which is an enhancement to improve the calculation of index NDK (Number of Distinct Keys). This new feature with the approx_count_distinct function and fully scans indexes to calculate NDK. This has a significant benefit because NDK is now accurate. It also means that gathering statistics can take longer (for example, updating global index statistics if incremental stats is used). So, In general, this is expected behavior, since DBMS_STATS is doing more work in 19c than it did in previously unenhanced versions.

And the solution to this new 19c index-stats feature (a problem) off by setting fix control to disable ‘Enhance Index NDK Statistics’ – 27268249

alter system set "_fix_control"='27268249:0';

And as soon as we deleted existing statistics and regather them, the time dropped drastically and got completed under 3 hours.

Hope It Helped!
Prashant Dixit

Posted in Advanced, troubleshooting | Tagged: , , , , | Leave a Comment »

Exceptionally high stats collection time on FIXED OBJECTS during an upgrade …

Posted by FatDBA on June 26, 2022

Someone recently asked about a situation where they were trying to upgrade their database to 19c and as a part of their upgrade plan, they were trying to run fixed object statistics but it was going on forever, and they were totally clueless why and where its taking time. This being a mandatory step, they tried several times, but same result.

About fixed object stats, It is recommended that you re-gather them if you do a major database or application upgrade, implement a new module, or make changes to the database configuration. For example if you increase the SGA size then all of the X$ tables that contain information about the buffer cache and shared pool may change significantly, such as X$ tables used in v$buffer_pool or v$shared_pool_advice.

About fixed objects stats collection idle time, I mean anything between 1-10 minutes is I will say normal and average, but anything that goes beyond 20 minutes or even more or even in hours is abnormally high and points to a situation.

So, I was asked to take a look on ad-hoc basis and during the analysis I found a SQL trying to do a count all on unified_audit_trail, and was running from the same time since they called the DBMS_STATS for FIXED OBJECTS on the database. When asked, they told me that they’d enabled auditing on the database some 6 months back and haven’t purged anything since then, the audit trail had grown behemoth and has ~ 880 Million records. I immediately offered them two approaches to handle the situation – Either lock your unified table statistics (using dbms_stats.lock_table_stats) or else take backup of the table and purge audit records before calling the stats gathering job again. They agreed with the second approach, they took backup of audit table and purged audit trail. As soon as they purged audit table, the stats collection on fixed objects got finished in ~ 3 minutes.

This was the situation and what we did …

SQL> select * from dba_audit_mgmt_last_arch_ts;

AUDIT_TRAIL RAC_INSTANCE LAST_ARCHIVE_TS
-------------------- ------------ ------------------------------
STANDARD AUDIT TRAIL 0 22-MAY-22 06.00.00.000000 AM +00:00


SQL> select count(*) from aud$;

COUNT(*)
----------
885632817

BEGIN
DBMS_AUDIT_MGMT.clean_audit_trail(
audit_trail_type => DBMS_AUDIT_MGMT.AUDIT_TRAIL_AUD_STD,
use_last_arch_timestamp => FALSE);
END;
/

SQL> select count(*) from aud$;

COUNT(*)
----------
0


SQL> SET TIMING ON
SQL> BEGIN
DBMS_STATS.GATHER_FIXED_OBJECTS_STATS;
END;
/

Elapsed: 00:03:10.81

Hope It Helped!
Prashant Dixit

Posted in Advanced, troubleshooting | Tagged: , , , , | 2 Comments »

How to prioritize an Oracle Database background process ?

Posted by FatDBA on April 18, 2022

Recently while looking into a system (was running on 19.3.0.0.0 standalone) where ‘log file sync’ was bugging the database, and after we tried all other possible solutions, we thought to increase the priroty of the LGWR background process to see if that helps.

Increasing the LGWR priority is putting the LGWR process in the Round-Robin (SCHED_RR) class. You can increase process’s priority both using OS (renice, nice commands) or Database methods, but this post is about setting the priority using ‘_high_priority_process’ an undocumented/hidden parameter that prioritizes your database managed processes.

I am using Oracle 19.3 for the test where the LGWR is not by default comes with any priority in the DB, starting from 21.3.0.0.0 LGWR process is part of _high_priority_processes group along with VKTM & LMS* processes.
Note: This being a hidden/undocumented parameter I advise to consult with Oracle support before going and changing the parameter value. Try other possible ways to reduce log file sync, before jumping into this crude method of prioritizing LGWR over others.

[oracle@oracleontario ~]$ !sql
sqlplus / as sysdba

SQL*Plus: Release 19.0.0.0.0 - Production on Sun Apr 10 03:36:06 2022
Version 19.3.0.0.0

Copyright (c) 1982, 2019, Oracle.  All rights reserved.

Connected to:
Oracle Database 19c Enterprise Edition Release 19.0.0.0.0 - Production
Version 19.3.0.0.0

SQL> @hidden

Enter value for param: high_prio
old   5:    and a.ksppinm like '%&param%'
new   5:    and a.ksppinm like '%priority_processes%'

Parameter                                     Session Value             Instance Value            descr
--------------------------------------------- ------------------------- ------------------------- ------------------------------------------------------------
_highest_priority_processes                   VKTM                      VKTM                      Highest Priority Process Name Mask
_high_priority_processes                      LMS*|VKTM                 LMS*|VKTM                 High Priority Process Name Mask 

And by default in Oracle version 19.3.0.0 the parameter is set to prioritize VKTM (Virtual keeper of time) and LMS (Lock Manager, a RAC process). Let me check VKTM’s current priority class, and it is set to RR class (SCHED_RR scheduling class) for the process as its defined via _high_priority_processes parameter.

[oracle@oracleontario ~]$ ps -eo pid,class,pri,nice,time,args |grep vktm
 23871 RR   41   - 00:00:53 ora_vktm_dixitdb

About the LGWR process, and it is set to TS (SCHED_OTHER) class and it has no priority class attached to it.

[oracle@oracleontario ~]$ ps -eo pid,class,pri,nice,time,args |grep ora_lg*
 23990 TS   19   0 00:00:07 ora_lgwr_dixitdb

Let’s change the priority and reboot the database to persistent the change!

SQL> alter system set "_high_priority_processes"='LMS*|VKTM|LGWR' scope=spfile;

System altered.

SQL> shut immediate
Database closed.
Database dismounted.
ORACLE instance shut down.

SQL> startup
ORACLE instance started.

Total System Global Area 1593831936 bytes
Fixed Size                  8897024 bytes
Variable Size            1107296256 bytes
Database Buffers          469762048 bytes
Redo Buffers                7876608 bytes
Database mounted.
Database opened.

SQL> @hidden
Enter value for param: high_priority_processes
old   5:    and a.ksppinm like '%&param%'
new   5:    and a.ksppinm like '%high_priority_processes%'

Parameter                                     Session Value             Instance Value            descr
--------------------------------------------- ------------------------- ------------------------- ------------------------------------------------------------
_high_priority_processes                      LMS*|VKTM|LGWR            LMS*|VKTM|LGWR            High Priority Process Name Mask

At the same time I can see the same was logged into the Alert log file.

2022-04-10T03:54:31.488732-04:00
LGWR started with pid=8, OS id=26058 at elevated (RT) priority

So, we have reniced the priority of LGWR on the system, I mean the higher value of priority actually makes the process lower priority; it means the process demands fewer system resources (and therefore is a “nicer” process). Now lets check the scheduling class of the process at the OS, it should be now changed to RR from TS.

SQL> !ps -eo pid,class,pri,nice,time,args |grep ora_lm*
 26058 RR   41   - 00:00:00 ora_lgwr_dixitdb

Let me check at the OS Level what has changed now.

[oracle@oracleontario 26058]$ pwd
/proc/26058
[oracle@oracleontario 26058]$ more sched
ora_lgwr_dixitd (26058, #threads: 1)
-------------------------------------------------------------------
se.exec_start                                :      26820431.663015
se.vruntime                                  :            -2.963799
se.sum_exec_runtime                          :          1858.211503
se.nr_migrations                             :                    0
nr_switches                                  :                 4038
nr_voluntary_switches                        :                 4023
nr_involuntary_switches                      :                   15
se.load.weight                               :                 1024
policy                                       :                    2      -----> Policy, the 0-99 are real-time priorities
prio                                         :                   98
clock-delta                                  :                   59
mm->numa_scan_seq                            :                    0
numa_migrations, 0
numa_faults_memory, 0, 0, 1, 0, -1
numa_faults_memory, 1, 0, 0, 0, -1


-- output from top utility
top - 05:09:14 up  7:32,  3 users,  load average: 0.14, 0.10, 0.11
Tasks:   2 total,   0 running,   2 sleeping,   0 stopped,   0 zombie
%Cpu(s):  0.0 us,  0.0 sy,  0.0 ni,100.0 id,  0.0 wa,  0.0 hi,  0.0 si,  0.0 st
GiB Mem :      4.3 total,      0.0 free,      1.1 used,      3.1 buff/cache
GiB Swap:      3.9 total,      3.9 free,      0.0 used.      2.1 avail Mem

   PID USER      PR  NI    VIRT    RES    SHR S %CPU %MEM     TIME+ COMMAND
 26027 oracle    -2   0 2016104  20096  17064 S  1.7  0.4   1:28.22 ora_vktm_dixitdb      ---> Look at the PR (priority) column with value -2 (higher pri)
 26058 oracle    -2   0 2017136  30360  26768 S  0.0  0.7   0:01.86 ora_lgwr_dixitdb      ---> Look at the PR (priority) column with value -2 (higher pri)

So, when nothing was working for us, this workaround helped and we were able to reduce LFS waits by more than 80% …

Hope It Helped!
Prashant Dixit

Posted in Advanced, troubleshooting | Tagged: , , , | 4 Comments »

Demystifying OUTLINE DATA in an Execution Plan …

Posted by FatDBA on March 7, 2022

‘Outline Data’ section displays the list of hints that would be needed to replicate the execution plan, even if the statistics change., but in case of a complex execution plans it comes with lot of strange looking and obscure terms used. As there isn’t any published explanation of stored outline hints, so today’s post is to decipher few of the terms that you see in an outline data of an execution plan.

If you want to read more about outlines, what are they, their purpose, please read my previous post on the same subject at –> https://fatdba.com/2017/11/30/how-to-fix-sql-plan-issues-using-outline-data/

Okay, coming back to the post, let me quickly generate the outline data for one of the test SQL and will try to explain about each of the hints, query blocks, aliases and other representations used.

SQL>
SQL> explain plan for 
SELECT d.department_name,e.employee_name
FROM departments d
LEFT OUTER JOIN employees e ON d.department_id = e.department_id
WHERE d.department_id >= 30
ORDER BY d.department_name, e.employee_name;  

Explained.

SQL> select * from table(dbms_xplan.display('PLAN_TABLE',NULL,'+alias +outline'));

PLAN_TABLE_OUTPUT
---------------------------------------------------------------------------------------------------------
Plan hash value: 3871261979
-----------------------------------------------------------------------------------
| Id  | Operation           | Name        | Rows  | Bytes | Cost (%CPU)| Time     |
-----------------------------------------------------------------------------------
|   0 | SELECT STATEMENT    |             |     4 |   168 |     7  (15)| 00:00:01 |
|   1 |  SORT ORDER BY      |             |     4 |   168 |     7  (15)| 00:00:01 |
|*  2 |   HASH JOIN OUTER   |             |     4 |   168 |     6   (0)| 00:00:01 |
|*  3 |    TABLE ACCESS FULL| DEPARTMENTS |     2 |    44 |     3   (0)| 00:00:01 |
|*  4 |    TABLE ACCESS FULL| EMPLOYEES   |     6 |   120 |     3   (0)| 00:00:01 |
-----------------------------------------------------------------------------------

Query Block Name / Object Alias (identified by operation id):
-------------------------------------------------------------
   1 - SEL$2BFA4EE4
   3 - SEL$2BFA4EE4 / D@SEL$1
   4 - SEL$2BFA4EE4 / E@SEL$1

Outline Data
-------------
  /*+
      BEGIN_OUTLINE_DATA
      USE_HASH(@"SEL$2BFA4EE4" "E"@"SEL$1")
      LEADING(@"SEL$2BFA4EE4" "D"@"SEL$1" "E"@"SEL$1")
      FULL(@"SEL$2BFA4EE4" "E"@"SEL$1")
      FULL(@"SEL$2BFA4EE4" "D"@"SEL$1")
      OUTLINE(@"SEL$1")
      OUTLINE(@"SEL$2")
      ANSI_REARCH(@"SEL$1")
      OUTLINE(@"SEL$8812AA4E")
      ANSI_REARCH(@"SEL$2")
      OUTLINE(@"SEL$948754D7")
      MERGE(@"SEL$8812AA4E" >"SEL$948754D7")
      OUTLINE_LEAF(@"SEL$2BFA4EE4")
      ALL_ROWS
      DB_VERSION('19.1.0')
      OPTIMIZER_FEATURES_ENABLE('19.1.0')
      IGNORE_OPTIM_EMBEDDED_HINTS
      END_OUTLINE_DATA
  */

Predicate Information (identified by operation id):
---------------------------------------------------

   2 - access("D"."DEPARTMENT_ID"="E"."DEPARTMENT_ID"(+))
   3 - filter("D"."DEPARTMENT_ID">=30)
   4 - filter("E"."DEPARTMENT_ID"(+)>=30)

As per the above outline data captured for the execution plan, the very first entry is USE_HASH(@”SEL$2BFA4EE4″ “E”@”SEL$1”) This represents the use of HASH join methods used in the query. Other join method outline options you might see are USE_NL and USE_MERGE. Here in our example we’ve used the LEFT OUTER JOIN which will return all valid rows from the table on the left side of the JOIN keyword, that’s table EMPLOYEE (alias ‘E’) along with the values from the table on the right side.

i.e LEFT OUTER JOIN employees e ON d.department_id = e.department_id

LEADING(@”SEL$2BFA4EE4″ “D”@”SEL$1” “E”@”SEL$1”) The LEADING hints specifies the exact join order for the SQL that is followed by the optimizer in the plan. It displays the join order as an ordered list of table aliases and query block names. The aliases appears in the ordering in which we access those tables in the query.

The first part of the hint @”SEL$2BFA4EE4″ represents the main SELECT block and if you closely see the full hint definition you will see “D”@”SEL$1”, where “SEL$1” is the query block name for table alias ‘D’ for Department table, which is followed by “E”@”SEL$1”, that represents query block name “SEL$1” on second table joined ‘E’ for Employee table.

FULL(@”SEL$2BFA4EE4″ “E”@”SEL$1”) & FULL(@”SEL$2BFA4EE4″ “D”@”SEL$1”) are what you see next and these two hints for FULL TABLE SCANS on table alias “E”, that is EMPLOYEE table, followed by FTS on table alias “D”, that is DEPARTMENT table. Same you can see in the execution plan too.

OUTLINE(@”SEL$1″) & OUTLINE(@”SEL$2″) These two OUTLINE hints correspond to initial and the intermediate query blocks.

ANSI_REARCH(@”SEL$1″) This is the hint that instructs the optimizer to re-architecture of ANSI left, right, and full outer joins. In our case this was to re-arch the left outer join.

MERGE(@”SEL$8812AA4E” >”SEL$948754D7″) is the MERGE query block hint. SEL$8812AA4E and SEL$948754D7 are the transformed query blocks.

OUTLINE_LEAF(@”SEL$2BFA4EE4″) This hint builds an outline leaf for the specified query block. In our example it represents that the query block SEL$2BFA4EE4 is a “final” query block that has actually been subject to independent optimization. Outline leaf cannot be transformed. You can see multiple outline_leaf hints for the query blocks.

IGNORE_OPTIM_EMBEDDED_HINTS is a special hint instructs the CBO to ignore most of all the other supplied hints.

ALL_ROWS This hint instructs to optimize the query/statement block for best throughput with lowest resource utilization.

DB_VERSION(‘19.1.0’) & OPTIMIZER_FEATURES_ENABLE(‘19.1.0’) these two hints allows for the CBO to process the SQL on the said version of the database, 19.1.0 in our case.

Few others that you might see in OUTLINE DATA sections and are easy to decipher are INDEX_RS_ASC (Index Range Scan in ascending order) and it happens when the INDEX RANGE SCAN is used as an access path/method in SQL execution plan. Few others that you can see in case of Nested Loop Joins are NLJ_BATCHING which happens when Oracle batches multiple physical I/O requests and process them using a vector I/O (array) instead of processing them one at a time, and batching improves performance because it uses asynchronous reads..
Few others that you can see in case of NL’s are USE_NL, NLJ_PREFETCH etc.

INDEX_FFS in case of Index Fast Full Scans and the list is long …

Hope It Helped!
Prashant Dixit

Posted in Advanced, troubleshooting | Tagged: , , , | Leave a Comment »

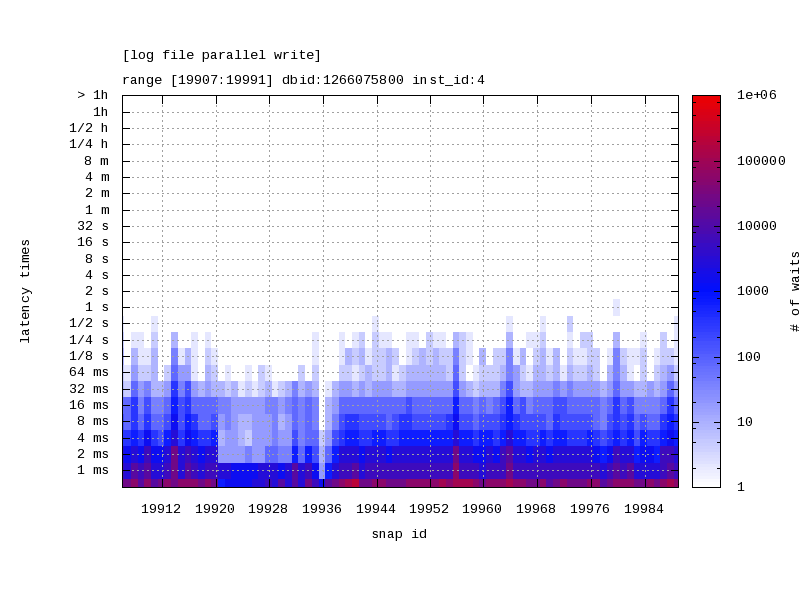
Script to display latency wait times using DBA_HIST_EVENT_HISTOGRAM using Heat Maps

Posted by FatDBA on March 2, 2022

Today’s post if about a brilliant tool/script that I frequently use to get the outputs/graphs for customer meetings, presentations and for quick analysis of any performance problem …

This is one of the awesome Oracle provided tool/script that generates a heat map of latency times for a given wait event. The script takes the output from DBA_HIST_EVENT_HISTOGRAM and produces a heat map and a JPG version of the heat map is also produced representing the wait time latency for the given wait event over a specific time frame identified by range of snapshots.

Source : Script to Display Latency Wait Time From DBA_HIST_EVENT_HISTOGRAM Using Heat Map (Doc ID 1931492.1)

Note: This script queries ASH views, specially DBA_HIST_EVENT_HISTOGRAM which requires license as its part of the Diagnostics Pack on Oracle EE

The scripts takes the following input parameters:

  • Snapshot id range (first snapshot id and last snapshot id)
  • Database id
  • Instance number
  • Exact name of wait event
perl ./lhm.pl --begin [first snapid] --end [last snapid] --dbid [database id] --instance [instance num] --wait_event "wait event"

perl ./lhm.pl  --dbid 1266075800 --begin 19907 --end 19991 --event "log file parallel write" --instance 4


-- Example Output
database id:     1266075800
wait event:      log file parallel write
Matrix:          [26x85]
snap range:      [19907:19991]
instance id:     4
jpg file   :     latency_log_file_parallel_write.jpg

Hope It Helped!
Prashant Dixit

Posted in Advanced, troubleshooting | Tagged: , , , , , | 1 Comment »