Recently someone asked me, How to run oratop utility on Oracle database version that is above 12.1 ? He was using Oracle version 19.3.0.0.0 and was getting error ‘error while loading shared libraries’ when tried to call the oratop, and it was quite an obvious error as the script trying to locate a shared object file called libclntshcore.so under $ORACLE_HOME/lib directory for version 12.1, whereas it was version 19.1 and hence the shared object version was libclntshcore.so.19.1
[oracle@oracleontario ~]$ ./oratop.RDBMS_12.1_LINUX_X64 -d -f -i 3 / as sysdba
./oratop.RDBMS_12.1_LINUX_X64: error while loading shared libraries: libclntshcore.so.12.1: cannot open shared object file: No such file or directory
[oracle@oracleontario ~]$
Solution to the problem is, starting from Oracle 19c, oratop is part of Oracle supplied tool and is present under ORACLE_HOME/suptools directory, and is not version specific. Other tools that you will see along with oratop in suptools directory are orachk and tfa. Let’s call it and see if it runs!
[oracle@oracleontario ~]$ cd $ORACLE_HOME/suptools/
[oracle@oracleontario suptools]$ ls
orachk  oratop  tfa
[oracle@oracleontario suptools]$ cd oratop/
[oracle@oracleontario oratop]$ ls
oratop
[oracle@oracleontario oratop]$
[oracle@oracleontario oratop]$

[oracle@oracleontario oratop]$ ./oratop  -f -i 3 / as sysdba

oratop: Release 15.0.0 Production on Thu Mar 10 07:33:49 2022
Copyright (c) 2011, Oracle.  All rights reserved.

Connecting ..
Processing ...

Oracle 19c - Primary dixitd 07:33:45 up: 5.2h,  1 ins,    0 sn,   0 us, 1.5G sga,    0% fra,   1 er,                        0.5%db
ID CPU  %CPU %DCP LOAD  AAS  ASC  ASI  ASW  IDL  ASP  LAT  MBPS IOPS  R/S  W/S  LIO  GCPS %FR  PGA TEMP UTPS  UCPS  RT/X DCTR DWTR
 1   1   9.1  0.2  0.2  0.0    0    0    0    0    0    0   0.1    3    3    0    3     0  45 153M    0    0     0  110m  118    8

EVENT (C)                                                         TOTAL WAITS   TIME(s)  AVG_MS  PCT                    WAIT_CLASS
db file sequential read                                                  5175        65    12.6   32                      User I/O
DB CPU                                                                               42           21
oracle thread bootstrap                                                    81        40   503.8   20                         Other
db file scattered read                                                    593        29    50.4   15                      User I/O
external table read                                                         1        23 23470.8   12                      User I/O

ID   SID     SPID USERNAME  PROGRAM    SRV  SERVICE  PGA  SQLID/BLOCKER OPN  E/T  STA  STE  WAIT_CLASS  EVENT/*LATCH           W/T
 1    58    14884 SYS       sqlplus@o  DED  SYS$USE 1.4M           1:77 UPD 8.0s  ACT  WAI  Applicatio  enq: TX - row lock co 7.8s


[oracle@oracleontario oratop]$
[oracle@oracleontario oratop]$
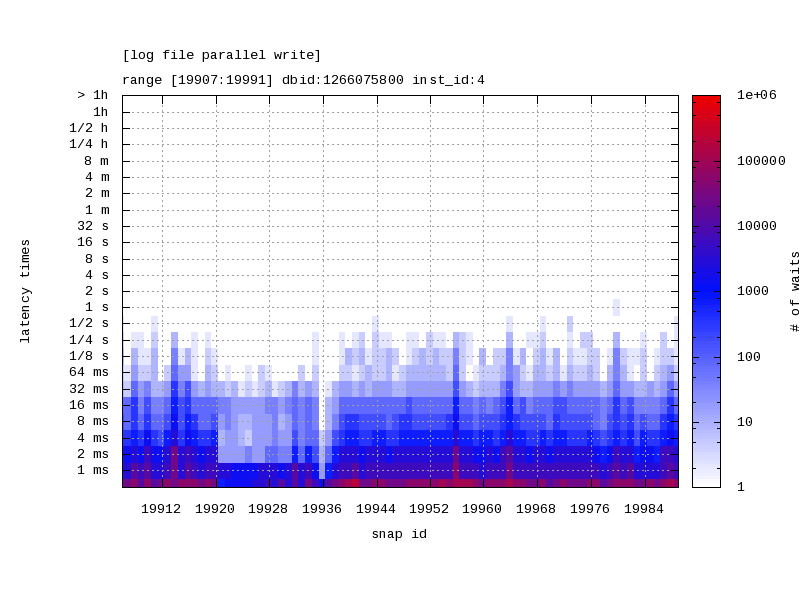
Today’s post if about a brilliant tool/script that I frequently use to get the outputs/graphs for customer meetings, presentations and for quick analysis of any performance problem …
This is one of the awesome Oracle provided tool/script that generates a heat map of latency times for a given wait event. The script takes the output from DBA_HIST_EVENT_HISTOGRAM and produces a heat map and a JPG version of the heat map is also produced representing the wait time latency for the given wait event over a specific time frame identified by range of snapshots.
Source : Script to Display Latency Wait Time From DBA_HIST_EVENT_HISTOGRAM Using Heat Map (Doc ID 1931492.1)
Note: This script queries ASH views, specially DBA_HIST_EVENT_HISTOGRAM which requires license as its part of the Diagnostics Pack on Oracle EE
The scripts takes the following input parameters:
Snapshot id range (first snapshot id and last snapshot id)
Recently I had to part-time support a system where customer reported slowness issues with few of the critical SQLs which uses few IN-Memory tables and were impacted exactly since they moved from Oracle 12.1 to 12.2. We tried few things but none of them worked, and with that I started suspecting if the change in CBO version from 12.1 to 12.2 the reason behind those problems with SQLs.
So, today’s post will give you some idea about such scenarios when you’re not sure about the things that broke the performance after the upgrade, and you have to do the try and error approach to find out the cause. So, I decided to give it a try with one of those SQLs to set the OFE (Optimizer Feature Enable) to earlier DB version 12.1 and verify query performance. So I started my test with the optimizer_features_enable parameter to set it to the older version.
SQL> alter session set optimizer_features_enable='12.1.0.2';
And the query ran fine, At this stage we had some sort of understanding of the problem as it was clear that some changes in 12.2 that has trigger this problem. But now I have to identify among all those hidden/underscore parameters and fix control’s that one final parameter which is influencing the optimizer for that odd behavior. So, I started something like this … We extract all the fixes and underscore parameters introduced in oracle 12.2 and I started with the hidden Parameters followed by Fix Control settings in 12.2.0.1 Optimizer environment to come to 12.1.0.2 OFE level
-- Hidden parameters added into Oracle version 12.2
-- Setting them back to Oracle version 12.1
alter session set "_optimizer_undo_cost_change"="12.1.0.2";
alter session set "_optimizer_cbqt_or_expansion"=off;
alter session set "_optimizer_ads_use_partial_results"=false;
alter session set "_query_rewrite_use_on_query_computation"=false;
alter session set "_px_scalable_invdist_mcol"=false;
alter session set "_optimizer_eliminate_subquery"=false;
alter session set "_sqlexec_hash_based_distagg_ssf_enabled"=false;
alter session set "_optimizer_union_all_gsets"=false;
alter session set "_optimizer_enhanced_join_elimination"=false;
alter session set "_optimizer_multicol_join_elimination"=false;
alter session set "_key_vector_create_pushdown_threshold"=0;
alter session set "_optimizer_enable_plsql_stats"=false;
alter session set "_recursive_with_parallel"=false;
alter session set "_recursive_with_branch_iterations"=1;
alter session set "_px_dist_agg_partial_rollup_pushdown"=off;
alter session set "_optimizer_key_vector_pruning_enabled"=false;
alter session set "_pwise_distinct_enabled"=false;
alter session set "_vector_encoding_mode"=off;
alter session set "_ds_xt_split_count"=0;
alter session set "_ds_sampling_method"=NO_QUALITY_METRIC;
alter session set "_optimizer_ads_use_spd_cache"=false;
alter session set "_optimizer_use_table_scanrate"=OFF;
alter session set "_optimizer_use_xt_rowid"=false;
alter session set "_xt_sampling_scan_granules"=off;
alter session set "_optimizer_band_join_aware"=false;
alter session set "_optimizer_vector_base_dim_fact_factor"=0;
alter session set "_ds_enable_view_sampling"=false;
alter session set "_optimizer_inmemory_use_stored_stats"=NEVER;
alter session set "_mv_access_compute_fresh_data"=off;
alter session set "_bloom_filter_ratio"=30;
alter session set "_optimizer_control_shard_qry_processing"=65535;
alter session set "_optimizer_interleave_or_expansion"=false;
Placed all above underscore parameters with the query and ran it again and observed the benefits (make sure to flush the previous plans from the shared pool). In my case this actually worked, but question was which underscore parameter helped. Do same with all fixes (controls).
-- Fix Controls added in Oracle version 12.2
-- Setting them back to Oracle version 12.1
alter session set "_fix_control"="16515789:0";
alter session set "_fix_control"="17491018:0";
alter session set "_fix_control"="17986549:0";
alter session set "_fix_control"="18115594:0";
alter session set "_fix_control"="18182018:0";
alter session set "_fix_control"="18302923:0";
alter session set "_fix_control"="18377553:0";
alter session set "_fix_control"="5677419:0";
alter session set "_fix_control"="18134680:0";
alter session set "_fix_control"="18636079:0";
alter session set "_fix_control"="18415557:0";
alter session set "_fix_control"="18385778:0";
alter session set "_fix_control"="18308329:0";
alter session set "_fix_control"="17973658:0";
alter session set "_fix_control"="18558952:0";
alter session set "_fix_control"="18874242:0";
alter session set "_fix_control"="18765574:0";
alter session set "_fix_control"="18952882:0";
alter session set "_fix_control"="18924221:0";
alter session set "_fix_control"="18422714:0";
alter session set "_fix_control"="18798414:0";
alter session set "_fix_control"="18969167:0";
alter session set "_fix_control"="19055664:0";
alter session set "_fix_control"="18898582:0";
alter session set "_fix_control"="18960760:0";
alter session set "_fix_control"="19070454:0";
alter session set "_fix_control"="19230097:0";
alter session set "_fix_control"="19063497:0";
alter session set "_fix_control"="19046459:0";
alter session set "_fix_control"="19269482:0";
alter session set "_fix_control"="18876528:0";
alter session set "_fix_control"="19227996:0";
alter session set "_fix_control"="18864613:0";
alter session set "_fix_control"="19239478:0";
alter session set "_fix_control"="19451895:0";
alter session set "_fix_control"="18907390:0";
alter session set "_fix_control"="19025959:0";
alter session set "_fix_control"="16774698:0";
alter session set "_fix_control"="19475484:0";
alter session set "_fix_control"="19287919:0";
alter session set "_fix_control"="19386746:0";
alter session set "_fix_control"="19774486:0";
alter session set "_fix_control"="18671960:0";
alter session set "_fix_control"="19484911:0";
alter session set "_fix_control"="19731940:0";
alter session set "_fix_control"="19604408:0";
alter session set "_fix_control"="14402409:0";
alter session set "_fix_control"="16486095:0";
alter session set "_fix_control"="19563657:0";
alter session set "_fix_control"="19632232:0";
alter session set "_fix_control"="19889960:0";
alter session set "_fix_control"="17208933:0";
alter session set "_fix_control"="19710102:0";
alter session set "_fix_control"="18697515:0";
alter session set "_fix_control"="18318631:0";
alter session set "_fix_control"="20078639:0";
alter session set "_fix_control"="19503668:0";
alter session set "_fix_control"="20124288:0";
alter session set "_fix_control"="19847091:0";
alter session set "_fix_control"="12618642:0";
alter session set "_fix_control"="19779920:0";
alter session set "_fix_control"="20186282:0";
alter session set "_fix_control"="20186295:0";
alter session set "_fix_control"="20265690:0";
alter session set "_fix_control"="16047938:0";
alter session set "_fix_control"="19507904:0";
alter session set "_fix_control"="18915345:0";
alter session set "_fix_control"="20329321:0";
alter session set "_fix_control"="20225191:0";
alter session set "_fix_control"="18776755:0";
alter session set "_fix_control"="19882842:0";
alter session set "_fix_control"="20010996:0";
alter session set "_fix_control"="20379571:0";
alter session set "_fix_control"="20129763:0";
alter session set "_fix_control"="19899588:0";
alter session set "_fix_control"="10098852:0";
alter session set "_fix_control"="19663421:0";
alter session set "_fix_control"="20465582:0";
alter session set "_fix_control"="16732417:0";
alter session set "_fix_control"="20732410:0";
alter session set "_fix_control"="20289688:0";
alter session set "_fix_control"="20543684:0";
alter session set "_fix_control"="20506136:0";
alter session set "_fix_control"="20830312:0";
alter session set "_fix_control"="19768896:0";
alter session set "_fix_control"="19814541:0";
alter session set "_fix_control"="17443547:0";
alter session set "_fix_control"="19123152:0";
alter session set "_fix_control"="19899833:0";
alter session set "_fix_control"="20754928:0";
alter session set "_fix_control"="20808265:0";
alter session set "_fix_control"="20808192:0";
alter session set "_fix_control"="20340595:0";
alter session set "_fix_control"="18949550:0";
alter session set "_fix_control"="14775297:0";
alter session set "_fix_control"="17497847:0";
alter session set "_fix_control"="20232513:0";
alter session set "_fix_control"="20587527:0";
alter session set "_fix_control"="19186783:0";
alter session set "_fix_control"="19653920:0";
alter session set "_fix_control"="21211786:0";
alter session set "_fix_control"="21057343:0";
alter session set "_fix_control"="21503478:0";
alter session set "_fix_control"="21476032:0";
alter session set "_fix_control"="20859246:0";
alter session set "_fix_control"="21639419:0";
alter session set "_fix_control"="20951803:0";
alter session set "_fix_control"="21683982:0";
alter session set "_fix_control"="20216500:0";
alter session set "_fix_control"="20906162:0";
alter session set "_fix_control"="20854798:0";
alter session set "_fix_control"="21509656:0";
alter session set "_fix_control"="21833220:0";
alter session set "_fix_control"="21802552:0";
alter session set "_fix_control"="21452843:0";
alter session set "_fix_control"="21800590:0";
alter session set "_fix_control"="21273039:0";
alter session set "_fix_control"="16750133:0";
alter session set "_fix_control"="22013607:0";
alter session set "_fix_control"="22152372:0";
alter session set "_fix_control"="22077191:0";
alter session set "_fix_control"="22123025:0";
alter session set "_fix_control"="16913734:0";
alter session set "_fix_control"="8357294:0";
alter session set "_fix_control"="21979983:0";
alter session set "_fix_control"="22158526:0";
alter session set "_fix_control"="21971099:0";
alter session set "_fix_control"="22090662:0";
alter session set "_fix_control"="21300129:0";
alter session set "_fix_control"="21339278:0";
alter session set "_fix_control"="20270511:0";
alter session set "_fix_control"="21424812:0";
alter session set "_fix_control"="22114090:0";
alter session set "_fix_control"="22159570:0";
alter session set "_fix_control"="22272439:0";
alter session set "_fix_control"="22372694:0";
alter session set "_fix_control"="22514195:0";
alter session set "_fix_control"="22520315:0";
alter session set "_fix_control"="22649054:0";
alter session set "_fix_control"="8617254:0";
alter session set "_fix_control"="22020067:0";
alter session set "_fix_control"="22864730:0";
alter session set "_fix_control"="21099502:0";
alter session set "_fix_control"="22904304:0";
alter session set "_fix_control"="22967807:0";
alter session set "_fix_control"="22879002:0";
alter session set "_fix_control"="23019286:0";
alter session set "_fix_control"="22760704:0";
alter session set "_fix_control"="20853506:0";
alter session set "_fix_control"="22513493:0";
alter session set "_fix_control"="22518491:0";
alter session set "_fix_control"="23103096:0";
alter session set "_fix_control"="22143411:0";
alter session set "_fix_control"="23180670:0";
alter session set "_fix_control"="23002609:0";
alter session set "_fix_control"="23210039:0";
alter session set "_fix_control"="23102649:0";
alter session set "_fix_control"="23071621:0";
alter session set "_fix_control"="23136865:0";
alter session set "_fix_control"="23176721:0";
alter session set "_fix_control"="23223113:0";
alter session set "_fix_control"="22258300:0";
alter session set "_fix_control"="22205301:0";
alter session set "_fix_control"="23556483:0";
alter session set "_fix_control"="21305617:0";
alter session set "_fix_control"="22533539:0";
alter session set "_fix_control"="23596611:0";
alter session set "_fix_control"="22937293:0";
alter session set "_fix_control"="23565188:0";
alter session set "_fix_control"="24654471:0";
alter session set "_fix_control"="24845754:0";
ALTER session set "_fix_control"='5483301:OFF;
In my case none of fix control gives any benefits. This was now clear there was some feature in 12.2 which when disabled in the form of underscore parameter helped to get us back to previous state. But the problem is, they are total 32 different parameters, so I thought to divide the parameter list into half and execute the query after setting first half parameters and see if I get the correct result, if not then tried again setting next half parameter list and executed the query. And with that trial and error approach, I was able to reach that one parameter which caused issues with those set of SQLs. It was ‘_optimizer_inmemory_use_stored_stats‘ which was causing issues with those IN-Memory tables references by those SQLs, as the optimizer NEVER uses the stored statistics for in-memory tables in 12.1, but the same parameter in 12.2 is with default value of AUTO and that causes the issue.
Someone asked me lately if its possible to fix a plan for a bad/slow SELECT SQL in a Data Guard environment ? The guy was asking as he was using ‘coe_xfr_sql_profile.sql‘, the script that you can use to create custom SQL Profiles to correct optimizer cost estimates to encourage good execution plans for a SQL.
Well, the post is not about using it to fix SQL plans, but is to understand how to fix a plan for a SQL that is slow on standby environment. Because if you go and try to execute the script that SQLT generates you will get ‘ORA-00600: internal error’ as dataguard is always opened in the RO mode and you cannot write anything on the database, so the question is – How to fix the plan then for a standby database ?
Here in the example, I’ve got a ADG setup with name ‘TESTSTANDBY’ and one of the SELECT statement with SQL ID 0y521mggg73pk that is slow and it has 4 different plan hash values (PHV) and there is plan flip that happens and due to that sometimes it picks the wrong plan and that’s when it goes slow. Here 1469174702 is the PHV that is WORST and both 3847062775 and 2797333706 PHVs are BEST and we can any of the two.
SQL> @1

DB_UNIQUE_NAME                 OPEN_MODE            DATABASE_ROLE
------------------------------ -------------------- ----------------
TESTSTANDBY                    READ ONLY WITH APPLY PHYSICAL STANDBY


SQL_ID        SUM(EXECS)   MIN_ETIME   MAX_ETIME   NORM_STDDEV
------------- ---------- ----------- ----------- -------------
0y521mggg73pk         32         .03        9.34      143.6554


SQL> @2
Enter value for sql_id: 0y521mggg73pk

SQL_ID        PLAN_HASH_VALUE        EXECS    AVG_ETIME AVG_CPU_TIME        AVG_LIO      AVG_PIO
------------- --------------- ------------ ------------ ------------ -------------- ------------
0y521mggg73pk      3847062775           10         .032         .021        1,448.0           .0
0y521mggg73pk      2797333706           10         .032         .021        1,448.0           .0
0y521mggg73pk      1687052623           10         .034         .025        1,448.0           .0
0y521mggg73pk      1469174702            2        9.340        1.021      541,054.0      4,155.5


-- This is what you will receive if try to run it on STANDBY database.
SQL> @coe_xfr_sql_profile_0y521mggg73pk_3847062775.sql

DECLARE
*
ERROR at line 1:
ORA-00600: internal error code, arguments: [2652], [108], [108], [0], [0], [3891200], [], [], [], [], [], []
ORA-06512: at "SYS.DBMS_SQLTUNE_INTERNAL", line 18876
ORA-06512: at "SYS.DBMS_SQLTUNE", line 9368
ORA-06512: at "SYS.DBMS_SQLTUNE", line 9328
ORA-06512: at line 37
So, what you have to do here, you need to move the file (do scp, ftp, cp whatever) ‘coe_xfr_sql_profile_0y521mggg73pk_3847062775.sql‘ that is produced by the COE file, to the PRIMARY database and run that file from there and not on the standby.
-- Run the script on PRIMARY database
SQL>
SQL> @coe_xfr_sql_profile_0y521mggg73pk_3847062775.sql
SQL> REM
SQL> REM $Header: 215187.1 coe_xfr_sql_profile_0y521mggg73pk_3847062775.sql 11.4.4.4 2022/01/13 carlos.sierra $
SQL> REM
SQL> REM Copyright (c) 2000-2012, Oracle Corporation. All rights reserved.
SQL> REM
SQL> REM AUTHOR
SQL> REM   carlos.sierra@oracle.com
SQL> REM
SQL> REM SCRIPT
SQL> REM   coe_xfr_sql_profile_0y521mggg73pk_3847062775.sql
SQL> REM
SQL> REM DESCRIPTION
SQL> REM   This script is generated by coe_xfr_sql_profile.sql
SQL> REM   It contains the SQL*Plus commands to create a custom
SQL> REM   SQL Profile for SQL_ID 0y521mggg73pk based on plan hash
SQL> REM   value 3847062775.
SQL> REM   The custom SQL Profile to be created by this script
SQL> REM   will affect plans for SQL commands with signature
SQL> REM   matching the one for SQL Text below.
SQL> REM   Review SQL Text and adjust accordingly.
SQL> REM
SQL> REM PARAMETERS
SQL> REM   None.
SQL> REM
SQL> REM EXAMPLE
SQL> REM   SQL> START coe_xfr_sql_profile_0y521mggg73pk_3847062775.sql;
SQL> REM
SQL> REM NOTES
SQL> REM   1. Should be run as SYSTEM or SYSDBA.
SQL> REM   2. User must have CREATE ANY SQL PROFILE privilege.
SQL> REM   3. SOURCE and TARGET systems can be the same or similar.
SQL> REM   4. To drop this custom SQL Profile after it has been created:
SQL> REM         EXEC DBMS_SQLTUNE.DROP_SQL_PROFILE('coe_0y521mggg73pk_3847062775');
SQL> REM   5. Be aware that using DBMS_SQLTUNE requires a license
SQL> REM         for the Oracle Tuning Pack.
SQL> REM   6. If you modified a SQL putting Hints in order to produce a desired
SQL> REM         Plan, you can remove the artifical Hints from SQL Text pieces below.
SQL> REM         By doing so you can create a custom SQL Profile for the original
SQL> REM         SQL but with the Plan captured from the modified SQL (with Hints).
SQL> REM
SQL> WHENEVER SQLERROR EXIT SQL.SQLCODE;
SQL> REM
SQL> VAR signature NUMBER;
SQL> VAR signaturef NUMBER;
SQL> REM
SQL> DECLARE
  2  sql_txt CLOB;
  3  h       SYS.SQLPROF_ATTR;
  4  PROCEDURE wa (p_line IN VARCHAR2) IS
  5  BEGIN
  6  DBMS_LOB.WRITEAPPEND(sql_txt, LENGTH(p_line), p_line);
  7  END wa;
  8  BEGIN
  9  DBMS_LOB.CREATETEMPORARY(sql_txt, TRUE);
 10  DBMS_LOB.OPEN(sql_txt, DBMS_LOB.LOB_READWRITE);
 11  -- SQL Text pieces below do not have to be of same length.
 12  -- So if you edit SQL Text (i.e. removing temporary Hints),
 13  -- there is no need to edit or re-align unmodified pieces.
 14  wa(q'[/* SQL Analyze(63,1) */ DELETE FROM PRTINSTANCEITER PII WHERE EX]');
 15  wa(q'[ISTS ( SELECT 1 FROM PRTPROCESS PP WHERE PP.INSTANCEID = PII.INS]');
 16  wa(q'[TANCEID||':'||PII.LASTITERATION AND CURRENTTIME < :B1 AND (STATU]');
 17  wa(q'[S = 4 OR STATUS = 5)) AND ROWNUM <=10000]');
 18  DBMS_LOB.CLOSE(sql_txt);
 19  h := SYS.SQLPROF_ATTR(
 20  q'[BEGIN_OUTLINE_DATA]',
 21  q'[IGNORE_OPTIM_EMBEDDED_HINTS]',
 22  q'[OPTIMIZER_FEATURES_ENABLE('12.2.0.1')]',
 23  q'[DB_VERSION('12.2.0.1')]',
 24  q'[ALL_ROWS]',
 25  q'[OUTLINE_LEAF(@"SEL$3BA1AD7C")]',
 26  q'[UNNEST(@"SEL$1")]',
 27  q'[OUTLINE(@"DEL$1")]',
 28  q'[OUTLINE(@"SEL$1")]',
 29  q'[INDEX_RS_ASC(@"SEL$3BA1AD7C" "PP"@"SEL$1" ("PRTPROCESS"."CURRENTTIME" "PRTPROCESS"."STATUS"))]',
 30  q'[BATCH_TABLE_ACCESS_BY_ROWID(@"SEL$3BA1AD7C" "PP"@"SEL$1")]',
 31  q'[FULL(@"SEL$3BA1AD7C" "PII"@"DEL$1")]',
 32  q'[LEADING(@"SEL$3BA1AD7C" "PP"@"SEL$1" "PII"@"DEL$1")]',
 33  q'[USE_HASH(@"SEL$3BA1AD7C" "PII"@"DEL$1")]',
 34  q'[END_OUTLINE_DATA]');
 35  :signature := DBMS_SQLTUNE.SQLTEXT_TO_SIGNATURE(sql_txt);
 36  :signaturef := DBMS_SQLTUNE.SQLTEXT_TO_SIGNATURE(sql_txt, TRUE);
 37  DBMS_SQLTUNE.IMPORT_SQL_PROFILE (
 38  sql_text    => sql_txt,
 39  profile     => h,
 40  name        => 'coe_0y521mggg73pk_3847062775',
 41  description => 'coe 0y521mggg73pk 3847062775 '||:signature||' '||:signaturef||'',
 42  category    => 'DEFAULT',
 43  validate    => TRUE,
 44  replace     => TRUE,
 45  force_match => FALSE /* TRUE:FORCE (match even when different literals in SQL). FALSE:EXACT (similar to CURSOR_SHARING) */ );
 46  DBMS_LOB.FREETEMPORARY(sql_txt);
 47  END;
 48  /

PL/SQL procedure successfully completed.

SQL> WHENEVER SQLERROR CONTINUE
SQL> SET ECHO OFF;

            SIGNATURE
---------------------
  3905242471056150906


           SIGNATUREF
---------------------
  3905242471056150906


... manual custom SQL Profile has been created

not spooling currently

COE_XFR_SQL_PROFILE_0y521mggg73pk_3847062775 completed
SQL>
SQL>
Perfect, it ran successfully on the PRIMARY database, and the same will be transferred on to the STANDBY database by its own. Let’s check if its created or moved to the STANDBY database or not. Let’s query dba_sql_profiles to see if its there …
-- Lets check it on Standby
SQL> select NAME, SQL_TEXT, CREATED, STATUS from dba_sql_profiles order by created;

NAME                           SQL_TEXT                                                                         CREATED                        STATUS
------------------------------ -------------------------------------------------------------------------------- ------------------------------ --------
coe_0y521mggg73pk_3847062775   DELETE FROM BIGTABDIXITTAB PII WHERE EXISTS ( SELECT 1                          13-JAN-22 06.28.03.000000 AM   ENABLED
So, the issue is fixed on the standby and the SQL immediately picked the right plan that we asked it to follow.
Here goes my maiden post blog post from series about “Troubleshooting SQLs & other Issues on a Read Only Standby/Dataguard Environments” …
Recently I helped one of my customer stabilize performance of one of their critical DWH/BI decision support system workload running on an ADG (Physical Standby). At one time I have to generate SQL tuning advisory reports for few slow SQLs on the database, but that being a RO dataguard, it always ends with an error "ORA-13792: This operation requires a database link." when I try to call the SQL tuning advisor directly on the standby database.
So, this post is about how to run SQL Tuning advisor on a dataguard environment. Let’s assume we want to get SQLTA recommendation for this below SQL that is going for a FULL TABLE SCAN and is a costly SQL.
SQL> explain plan for select count(*) from bigtab where weight in ( select distinct( weight) from bigtab);

Explained.

SQL> select * from  table(dbms_xplan.display_cursor(null,null,'ALLSTATS LAST'));

PLAN_TABLE_OUTPUT
-------------------------------------------------------------------------------------------------
SQL_ID  0mauvkjsvmcmj, child number 1


Plan hash value: 2140185107

-----------------------------------------------------------------------------
| Id  | Operation          | Name   | Rows  | Bytes | Cost (%CPU)| Time     |
-----------------------------------------------------------------------------
|   0 | SELECT STATEMENT   |        |     1 |    13 |    74   (0)| 00:00:01 |
|   1 |  SORT AGGREGATE    |        |     1 |    13 |            |          |
|*  2 |   TABLE ACCESS FULL| BIGTAB | 80223 |  1018K|    74   (0)| 00:00:01 |
-----------------------------------------------------------------------------

Predicate Information (identified by operation id):
---------------------------------------------------

   2 - filter("WEIGHT" IS NOT NULL)
This is what I have received on the standby database when tried to run the SQL Tuning advisor directly on it where it says that it requires a database link in order to run the advisory.
-- On standby database:
SQL>
SQL> @?/rdbms/admin/sqltrpt.sql


Specify the Sql id
~~~~~~~~~~~~~~~~~~
Enter value for sqlid: 0y521mggg73pk

Sql Id specified: 0y521mggg73pk

Tune the sql
~~~~~~~~~~~~
DECLARE
*
ERROR at line 1:
ORA-13792: This operation requires a database link.
ORA-06512: at line 36
ORA-06512: at "SYS.DBMS_SQLTUNE_UTIL1", line 1571
ORA-06512: at "SYS.DBMS_SYS_ERROR", line 79
ORA-06512: at "SYS.DBMS_SQLTUNE_UTIL1", line 1563
ORA-06512: at "SYS.DBMS_SQLTUNE", line 798
ORA-06512: at line 20


ERROR:
ORA-13608: The specified name NULL is invalid.
ORA-06512: at "SYS.DBMS_SQLTUNE_UTIL1", line 1571
ORA-06512: at "SYS.PRVT_ADVISOR", line 7080
ORA-06512: at "SYS.DBMS_SYS_ERROR", line 86
ORA-06512: at "SYS.PRVT_ADVISOR", line 85
ORA-06512: at "SYS.PRVT_ADVISOR", line 5938
ORA-06512: at "SYS.PRVT_ADVISOR", line 7011
ORA-06512: at "SYS.DBMS_SQLTUNE_UTIL1", line 1535
ORA-06512: at "SYS.DBMS_SQLTUNE", line 1324
ORA-06512: at line 1
In remote tuning, the database on which you initiate a tuning task differs from the database in which the tuning process executes or in which results are stored. For example, a standby database can have its own workload of queries, some of which may require tuning. You can issue SQL Tuning Advisor statements on a standby database. A standby-to-primary database link enables DBMS_SQLTUNE to write data to and read data from the primary database. The link is necessary because the standby database, which is read-only, cannot write the SQL tuning data.
Okay, for that first you need to create the DB Link between primary and the standby database, and same will be used by the SQL tuning advisor where it will do the write operations on the primary database. We will check its connectivity from the standby database if its working or not …
-- On Primary database
SQL> select username,common,account_status from dba_users where username ='SYS$UMF';

USERNAME        COM ACCOUNT_STATUS
--------------- --- --------------------------------
SYS$UMF         YES OPEN

-- On Primary database:
SQL> create database link lnk_to_pri connect to "SYS$UMF" identified by "oracle90" using 'DXTPRI';

Database link created.


-- On Standby database:
SQL> select  db_unique_name from v$database@lnk_to_pri;

DB_UNIQUE_NAME
------------------------------
DXTPRI

1 row selected.

SQL>
To tune a standby workload on a primary database, specify the database_link_to parameter in DBMS_SQLTUNE procedures. By default, the database_link_to parameter is null, which means that tuning is local. The database_link_to parameter must specify a private database link. This link must be owned by SYS and accessed by the default privileged user SYS$UMF. You issue all statements on the standby database. DBMS_SQLTUNE uses the database link both to fetch data from the primary database, and store data in the primary database. Let’s create the TUNING TASK for the SQL Text.
-- run it on the STANDBY Database.
SQL>
SQL>
DECLARE
my_task_name VARCHAR2(30);
my_sqltext CLOB;
BEGIN
my_sqltext := 'select count(*) from bigtab where weight in ( select distinct( weight) from bigtab)';
my_task_name := DBMS_SQLTUNE.CREATE_TUNING_TASK(
sql_text => my_sqltext,
task_name => 'TEST_sql_tuning_task1',
database_link_to => 'lnk_to_pri');
END;
/
PL/SQL procedure successfully completed.

SQL>

-- Lets check if the tuning task is created
SQL> SELECT task_name, STATUS, EXECUTION_start, EXECUTION_end FROM dba_advisor_log;

TASK_NAME
--------------------------------------------------------------------------------
STATUS      EXECUTION EXECUTION
----------- --------- ---------
TEST_sql_tuning_task1
EXECUTING   13-JAN-22
Next you need to execute the tuning task using the task_name you have assigned in the last step while creating the tuning task.
-- On Standby database
SQL> EXEC DBMS_SQLTUNE.execute_tuning_task(task_name => '&&your_sta_taks_name', database_link_to => 'lnk_to_pri');
Enter value for your_sta_taks_name: TEST_sql_tuning_task1

PL/SQL procedure successfully completed.

SQL>
Next, lets do the final step, generate the tuning task report with all recommendations for the SQL that is slow in the standby database.
-- Run it on the Standby database.
SQL>
SQL> SET LINES 150
SQL> SET pages 50000
SQL> SET long 5000000
SQL> SET longc 5000000
SQL> select dbms_sqltune.report_tuning_task('&&your_sta_taks_name', database_link_to => 'lnk_to_pri') from dual;
old   1: select dbms_sqltune.report_tuning_task('&&your_sta_taks_name', database_link_to => 'lnk_to_pri') from dual
new   1: select dbms_sqltune.report_tuning_task('TEST_sql_tuning_task1', database_link_to => 'lnk_to_pri') from dual

DBMS_SQLTUNE.REPORT_TUNING_TASK('TEST_SQL_TUNING_TASK1',DATABASE_LINK_TO=>'LNK_TO_PRI')
--------------------------------------------------------------------------------
GENERAL INFORMATION SECTION
----------------------------------------------------


RECOMMENDATIONS
------------------------------------------------------------------------------------------------------------------------------------------------------
GENERAL INFORMATION SECTION
-------------------------------------------------------------------------------
Tuning Task Name   : sql_tuning_task_5mxdwvuf9j3vp
Tuning Task Owner  : SYS
Workload Type      : Single SQL Statement
Scope              : COMPREHENSIVE
Time Limit(seconds): 60
Completion Status  : COMPLETED
Started at         : 01/13/2021 22:05:52
Completed at       : 01/13/2021 22:06:25

-------------------------------------------------------------------------------
Schema Name: SYS
SQL ID     : pdxdwvuf9j3co
SQL Text   : select count(*) from bigtab where weight in ( select distinct( weight) from bigtab)

-------------------------------------------------------------------------------
FINDINGS SECTION (1 finding)
-------------------------------------------------------------------------------

1- SQL Profile Finding (see explain plans section below)
--------------------------------------------------------
  A potentially better execution plan was found for this statement.

  Recommendation (estimated benefit: 99.94%)
  ------------------------------------------
  - Consider accepting the recommended SQL profile.
    execute dbms_sqltune.accept_sql_profile(task_name =>
            'sql_tuning_task_pdxdwvuf9j3co', task_owner => 'SYS', replace =>
            TRUE);

  Validation results
  ------------------
So, that’t it, you finally have the tuning recommendations for the slow SQL in the STANDBY database.
Lately someone told me that he ran the gather_plan_statistics hint with his SQL, but he is not getting the detailed execution plan, I mean all extra stats that you see i.e. starts, estimated time, starts, buffers, actual and estimated number of rows were not there and he was getting the regular/simple execution plan.
But I found he was trying it in a wrong way! The /*+ gather_plan_statistics */ hint does not save data into PLAN_TABLE, but it stores execution statistics in V$SQL_PLAN performance view. To display these data you can use (dbms_xplan.display_cursor (format=>’ALLSTATS LAST’)), but this not always work, because you must execute the second command immediately after the SQL query. The better method is to query V$SQL or V$SQLAREA or any useful view to obtain SQL_ID of the query, and then use DISPLAY_CURSOR function, for example in this way …
SQL>
SQL> SELECT /*+ gather_plan_statistics */ * FROM (SELECT A.MANDNA_KKAJ_DI,A.NAME,ROWNUM IDX FROM DIXDROI.INF_KRA_PRIMAR A,DIXDROI.INF_KRA_PRIMAR_B B,DIXDROI.INF_KRA_PRIMAR_RANGE C WHERE A.TYPE='MOBILE'
AND A.STATUS='Available' AND A.ASSIGNED_CSN_ID IS NULL AND B.OWNING_OBJECT_ID=A.MANDNA_KKAJ_DI AND
B.BINDING_NAME='com.paratapata.killer.mfs.oare.mainframe.locking.ADAKingstonToKillerRangeStst' AND C.MANDNA_KKAJ_DI=B.TARGET_OBJECT_ID
AND C.STATUS = NVL('Active', C.STATUS) AND C.CATEGORY = 'Range'
AND 'Internal' = NVL(C.NUMBER_USAGE,'External') AND (A.lock_id IS NULL OR A.LOCK_DATE <= (sysdate - NVL(A.LOCK_PERIOD,(SELECT mark_raar_value
FROM DIXDROI.PAM_KRIAIS_MAINFATRAARA_AHAH WHERE mark_raar_name = 'DEFAULT_LOCK_PERIOD' )) / 60 / 24))
ORDER BY TO_NUMBER(A.NAME) ) RESULTS WHERE RESULTS.IDX BETWEEN 1 AND 15;

MANDNA_KKAJ_DI NAME                                                      IDX
-------------- -------------------------------------------------- ----------
      91891302 0444915115                                                 12
      91891309 0444915122                                                 13
      91891310 0444915123                                                 14
      91891314 0444915127                                                 15
      91891723 0444915536                                                  2
      91891724 0444915537                                                  3
      91891726 0444915539                                                  4
      91891730 0444915543                                                  5
      91891739 0444915552                                                  6
      91891748 0444915561                                                  7
      91891766 0444915579                                                  8
      91891768 0444915581                                                  9
      91891807 0444915620                                                 10
      91891854 0444915667                                                 11
      17116808 04466962472                                                 1

15 rows selected.

SQL> select sql_id, plan_hash_value, executions, sql_text from gv$sqlarea where sql_fulltext like '%gather_plan_statistics%';

SQL_ID        PLAN_HASH_VALUE EXECUTIONS SQL_TEXT
------------- --------------- ---------- ------------------------------------------------------------
0m329sngnhv1p      2185860753          1 SELECT /*+ gather_plan_statistics */ * FROM (SELECT A.OBJECT
                                         _INST_ID,A.NAME,ROWNUM IDX FROM DIXDROI.INF_KRA_PRIMAR A,INS
                                         TALL.INF_KRA_PRIMAR_B B,DIXDROI.INF_KRA_PRIMAR_RANGE C WHERE
                                          A.TYPE=:"SYS_B_00" AND A.STATUS=:"SYS_B_01" AND A.ASSIGNED_
                                         CSN_ID IS NULL AND B.OWNING_OBJECT_ID=A.MANDNA_KKAJ_DI AND B
                                         .BINDING_NAME=:"SYS_B_02" AND C.MANDNA_KKAJ_DI=B.TARGET_OBJE
                                         CT_ID AND C.STATUS = NVL(:"SYS_B_03", C.STATUS) AND C.CATEGO
                                         RY = :"SYS_B_04" AND :"SYS_B_05" = NVL(C.NUMBER_USAGE,:"SYS_
                                         B_06") AND (A.lock_id IS NULL OR A.LOCK_DATE <= (sysdate - N
                                         VL(A.LOCK_PERIOD,(SELECT mark_raar_value FROM DIXDROI.EAI_HY
                                         BRIS_CONFIGURATION_DATA WHERE mark_raar_name = :"SYS_B_07" )
                                         ) / :"SYS_B_08" / :"SYS_B_09")) ORDER BY TO_NUMBER(A.NAME) )
                                          RESULTS WHERE RESULTS.IDX BETWEEN :"SYS_B_10" AND :"SYS_B_1
                                         1"
The above query returns SQL_ID=0m329sngnhv1p and CHILD_NUMBER=0(child number is just a cursor number). Use these values to query the collected plan. This will show you statistics such as the actual number of rows processed (A-Rows), rather than just the estimates (E-Rows). A-Rows is the total number of rows produced by all starts of that operation. But E-Rows is an estimate of the number of rows produced by a single start of an operation. If you want to read about E-Rows and A-Rows columns, please read a brilliant post by Jonathan Lewis.
Okay, the plan also includes a column called Starts, which tells you how many times each step was executed. A-Rows, E-Rows and Starts are all incredibly useful if you want to understand a plan.
SQL> SELECT * FROM table(DBMS_XPLAN.DISPLAY_CURSOR('0m329sngnhv1p', 0, 'ALLSTATS'));

PLAN_TABLE_OUTPUT
----------------------------------------------------------------------------------------------------------------------------------------------------------------------------------------------------------------------------------------------------------------------------------------------------------------------------------------------------------------------------------------------------------------
SQL_ID  0m329sngnhv1p, child number 0
-------------------------------------
SELECT /*+ gather_plan_statistics */ * FROM (SELECT
A.MANDNA_KKAJ_DI,A.NAME,ROWNUM IDX FROM DIXDROI.INF_KRA_PRIMAR
A,DIXDROI.INF_KRA_PRIMAR_B B,DIXDROI.INF_KRA_PRIMAR_RANGE C WHERE
A.TYPE=:"SYS_B_00" AND A.STATUS=:"SYS_B_01" AND A.ASSIGNED_CSN_ID IS
NULL AND B.OWNING_OBJECT_ID=A.MANDNA_KKAJ_DI AND
B.BINDING_NAME=:"SYS_B_02" AND C.MANDNA_KKAJ_DI=B.TARGET_OBJECT_ID AND
C.STATUS = NVL(:"SYS_B_03", C.STATUS) AND C.CATEGORY = :"SYS_B_04" AND
:"SYS_B_05" = NVL(C.NUMBER_USAGE,:"SYS_B_06") AND (A.lock_id IS NULL OR
A.LOCK_DATE <= (sysdate - NVL(A.LOCK_PERIOD,(SELECT mark_raar_value
FROM DIXDROI.PAM_KRIAIS_MAINFATRAARA_AHAH WHERE mark_raar_name =
:"SYS_B_07" )) / :"SYS_B_08" / :"SYS_B_09")) ORDER BY TO_NUMBER(A.NAME)
) RESULTS WHERE RESULTS.IDX BETWEEN :"SYS_B_10" AND :"SYS_B_11"


Plan hash value: 2185860753


-----------------------------------------------------------------------------------------------------------------------------------------------------------------
| Id  | Operation                                  | Name                          | Starts | E-Rows | A-Rows |   A-Time   | Buffers |  OMem |  1Mem |  O/1/M|
-----------------------------------------------------------------------------------------------------------------------------------------------------------------
|   0 | SELECT STATEMENT                           |                               |      1 |        |     15 |00:00:00.62 |     353K|       |       |      |
|*  1 |  FILTER                                    |                               |      1 |        |     15 |00:00:00.62 |     353K|       |       |      |
|*  2 |   VIEW                                     |                               |      1 |   5530 |     15 |00:00:00.62 |     353K|       |       |      |
|   3 |    SORT ORDER BY                           |                               |      1 |   5530 |   7873 |00:00:00.62 |     353K|   549K|   457K| 1/0/0|
|   4 |     COUNT                                  |                               |      1 |        |   7873 |00:00:00.46 |     353K|       |       |      |
|   5 |      NESTED LOOPS                          |                               |      1 |   5530 |   7873 |00:00:00.46 |     353K|       |       |      |
|   6 |       NESTED LOOPS                         |                               |      1 |   5530 |    266K|00:00:00.44 |     240K|       |       |      |
|   7 |        NESTED LOOPS                        |                               |      1 |   5530 |    266K|00:00:00.19 |   46039 |       |       |      |
|*  8 |         TABLE ACCESS FULL                  | INF_KRA_PRIMAR_RANGE          |      1 |   4392 |     90 |00:00:00.01 |     878 |       |       |      |
|   9 |         TABLE ACCESS BY INDEX ROWID BATCHED| INF_KRA_PRIMAR_B              |     90 |      1 |    266K|00:00:00.17 |   45161 |       |       |      |
|* 10 |          INDEX RANGE SCAN                  | EAI_NUMBER_REL_1              |     90 |      1 |    266K|00:00:00.04 |    3871 |       |       |      |
|* 11 |        INDEX UNIQUE SCAN                   | PK_INF_KRA_PRIMAR             |    266K|      1 |    266K|00:00:00.20 |     194K|       |       |      |
|* 12 |       TABLE ACCESS BY INDEX ROWID          | INF_KRA_PRIMAR                |    266K|      1 |   7873 |00:00:00.20 |     113K|       |       |      |
|  13 |        TABLE ACCESS BY INDEX ROWID BATCHED | PAM_KRIAIS_MAINFATRAARA_AHAH  |      1 |      1 |      1 |00:00:00.01 |       2 |       |       |      |
|* 14 |         INDEX RANGE SCAN                   | IDXGETNUMBERPD1               |      1 |      1 |      1 |00:00:00.01 |       1 |       |       |      |
-----------------------------------------------------------------------------------------------------------------------------------------------------------------

Predicate Information (identified by operation id):
---------------------------------------------------

   1 - filter(:SYS_B_11>=:SYS_B_10)
   2 - filter(("RESULTS"."IDX">=:SYS_B_10 AND "RESULTS"."IDX"<=:SYS_B_11))
   8 - filter((NVL("C"."CATEGORY",'Range')=:SYS_B_04 AND NVL("C"."NUMBER_USAGE",:SYS_B_06)=:SYS_B_05 AND "C"."STATUS"=NVL(:SYS_B_03,"C"."STATUS")))
  10 - access("C"."MANDNA_KKAJ_DI"="B"."TARGET_OBJECT_ID" AND "B"."BINDING_NAME"=:SYS_B_02)
  11 - access("B"."OWNING_OBJECT_ID"="A"."MANDNA_KKAJ_DI")
  12 - filter(("A"."TYPE"=:SYS_B_00 AND "A"."STATUS"=:SYS_B_01 AND "A"."ASSIGNED_CSN_ID" IS NULL AND ("A"."LOCK_ID" IS NULL OR
              "A"."LOCK_DATE"<=SYSDATE@!-NVL("A"."LOCK_PERIOD",)/:SYS_B_08/:SYS_B_09)))
  14 - access("mark_raar_NAME"=:SYS_B_07)


49 rows selected.
There are multiple other ways how you can add or remove more details to your execution plan, lets take a look on few of those methods.
-- To get additional COST and BYTES column into plan

SQL> SELECT * FROM TABLE(DBMS_XPLAN.display_cursor(sql_id=>'0m329sngnhv1p',format=>'ALLSTATS LAST +cost +bytes'));

PLAN_TABLE_OUTPUT
----------------------------------------------------------------------------------------------------------------------------------------------------------------------------------------------------------------------------------------------------------------------------------------------------------------------------------------------------------------------------------------------------------------
SQL_ID  0m329sngnhv1p, child number 0
-------------------------------------
SELECT /*+ gather_plan_statistics */ * FROM (SELECT
A.MANDNA_KKAJ_DI,A.NAME,ROWNUM IDX FROM DIXDROI.INF_KRA_PRIMAR
A,DIXDROI.INF_KRA_PRIMAR_B B,DIXDROI.INF_KRA_PRIMAR_RANGE C WHERE
A.TYPE=:"SYS_B_00" AND A.STATUS=:"SYS_B_01" AND A.ASSIGNED_CSN_ID IS
NULL AND B.OWNING_OBJECT_ID=A.MANDNA_KKAJ_DI AND
B.BINDING_NAME=:"SYS_B_02" AND C.MANDNA_KKAJ_DI=B.TARGET_OBJECT_ID AND
C.STATUS = NVL(:"SYS_B_03", C.STATUS) AND C.CATEGORY = :"SYS_B_04" AND
:"SYS_B_05" = NVL(C.NUMBER_USAGE,:"SYS_B_06") AND (A.lock_id IS NULL OR
A.LOCK_DATE <= (sysdate - NVL(A.LOCK_PERIOD,(SELECT mark_raar_value
FROM DIXDROI.PAM_KRIAIS_MAINFATRAARA_AHAH WHERE mark_raar_name =
:"SYS_B_07" )) / :"SYS_B_08" / :"SYS_B_09")) ORDER BY TO_NUMBER(A.NAME)
) RESULTS WHERE RESULTS.IDX BETWEEN :"SYS_B_10" AND :"SYS_B_11"

Plan hash value: 2185860753

----------------------------------------------------------------------------------------------------------------------------------------------------------------------------------------------
| Id  | Operation                                  | Name                          | Starts | E-Rows |E-Bytes|E-Temp | Cost (%CPU)| A-Rows |   A-Time   | Buffers |  OMem |  1Mem | Used-Mem |
----------------------------------------------------------------------------------------------------------------------------------------------------------------------------------------------
|   0 | SELECT STATEMENT                           |                               |      1 |        |       |       |  3753 (100)|     15 |00:00:00.62 |     353K|       |       |          |
|*  1 |  FILTER                                    |                               |      1 |        |       |       |            |     15 |00:00:00.62 |     353K|       |       |          |
|*  2 |   VIEW                                     |                               |      1 |   5530 |   286K|       |  3753   (1)|     15 |00:00:00.62 |     353K|       |       |          |
|   3 |    SORT ORDER BY                           |                               |      1 |   5530 |   918K|  1064K|  3753   (1)|   7873 |00:00:00.62 |     353K|   549K|   457K|  487K (0)|
|   4 |     COUNT                                  |                               |      1 |        |       |       |            |   7873 |00:00:00.46 |     353K|       |       |          |
|   5 |      NESTED LOOPS                          |                               |      1 |   5530 |   918K|       |  3544   (1)|   7873 |00:00:00.46 |     353K|       |       |          |
|   6 |       NESTED LOOPS                         |                               |      1 |   5530 |   918K|       |  3544   (1)|    266K|00:00:00.44 |     240K|       |       |          |
|   7 |        NESTED LOOPS                        |                               |      1 |   5530 |   615K|       |  2437   (1)|    266K|00:00:00.19 |   46039 |       |       |          |
|*  8 |         TABLE ACCESS FULL                  | INF_KRA_PRIMAR_RANGE          |      1 |   4392 | 92232 |       |   240   (1)|     90 |00:00:00.01 |     878 |       |       |          |
|   9 |         TABLE ACCESS BY INDEX ROWID BATCHED| INF_KRA_PRIMAR_B              |     90 |      1 |    93 |       |     1   (0)|    266K|00:00:00.17 |   45161 |       |       |          |
|* 10 |          INDEX RANGE SCAN                  | EAI_NUMBER_REL_1              |     90 |      1 |       |       |     1   (0)|    266K|00:00:00.04 |    3871 |       |       |          |
|* 11 |        INDEX UNIQUE SCAN                   | PK_INF_KRA_PRIMAR             |    266K|      1 |       |       |     1   (0)|    266K|00:00:00.20 |     194K|       |       |          |
|* 12 |       TABLE ACCESS BY INDEX ROWID          | INF_KRA_PRIMAR                |    266K|      1 |    56 |       |     1   (0)|   7873 |00:00:00.20 |     113K|       |       |          |
|  13 |        TABLE ACCESS BY INDEX ROWID BATCHED | PAM_KRIAIS_MAINFATRAARA_AHAH  |      1 |      1 |    28 |       |     1   (0)|      1 |00:00:00.01 |       2 |       |       |          |
|* 14 |         INDEX RANGE SCAN                   | IDXGETNUMBERPD1               |      1 |      1 |       |       |     1   (0)|      1 |00:00:00.01 |       1 |       |       |          |
----------------------------------------------------------------------------------------------------------------------------------------------------------------------------------------------

Predicate Information (identified by operation id):
---------------------------------------------------

   1 - filter(:SYS_B_11>=:SYS_B_10)
   2 - filter(("RESULTS"."IDX">=:SYS_B_10 AND "RESULTS"."IDX"<=:SYS_B_11))
   8 - filter((NVL("C"."CATEGORY",'Range')=:SYS_B_04 AND NVL("C"."NUMBER_USAGE",:SYS_B_06)=:SYS_B_05 AND "C"."STATUS"=NVL(:SYS_B_03,"C"."STATUS")))
  10 - access("C"."MANDNA_KKAJ_DI"="B"."TARGET_OBJECT_ID" AND "B"."BINDING_NAME"=:SYS_B_02)
  11 - access("B"."OWNING_OBJECT_ID"="A"."MANDNA_KKAJ_DI")
  12 - filter(("A"."TYPE"=:SYS_B_00 AND "A"."STATUS"=:SYS_B_01 AND "A"."ASSIGNED_CSN_ID" IS NULL AND ("A"."LOCK_ID" IS NULL OR
              "A"."LOCK_DATE"<=SYSDATE@!-NVL("A"."LOCK_PERIOD",)/:SYS_B_08/:SYS_B_09)))
  14 - access("mark_raar_NAME"=:SYS_B_07)


49 rows selected.


-- To get OUTLINE data into your execution plan

SQL>
SQL> SELECT * FROM TABLE(DBMS_XPLAN.display_cursor(sql_id=>'0m329sngnhv1p', format=>'ALLSTATS LAST +outline'));

PLAN_TABLE_OUTPUT
----------------------------------------------------------------------------------------------------------------------------------------------------------------------------------------------------------------------------------------------------------------------------------------------------------------------------------------------------------------------------------------------------------------
SQL_ID  0m329sngnhv1p, child number 0
-------------------------------------
SELECT /*+ gather_plan_statistics */ * FROM (SELECT
A.MANDNA_KKAJ_DI,A.NAME,ROWNUM IDX FROM DIXDROI.INF_KRA_PRIMAR
A,DIXDROI.INF_KRA_PRIMAR_B B,DIXDROI.INF_KRA_PRIMAR_RANGE C WHERE
A.TYPE=:"SYS_B_00" AND A.STATUS=:"SYS_B_01" AND A.ASSIGNED_CSN_ID IS
NULL AND B.OWNING_OBJECT_ID=A.MANDNA_KKAJ_DI AND
B.BINDING_NAME=:"SYS_B_02" AND C.MANDNA_KKAJ_DI=B.TARGET_OBJECT_ID AND
C.STATUS = NVL(:"SYS_B_03", C.STATUS) AND C.CATEGORY = :"SYS_B_04" AND
:"SYS_B_05" = NVL(C.NUMBER_USAGE,:"SYS_B_06") AND (A.lock_id IS NULL OR
A.LOCK_DATE <= (sysdate - NVL(A.LOCK_PERIOD,(SELECT mark_raar_value
FROM DIXDROI.PAM_KRIAIS_MAINFATRAARA_AHAH WHERE mark_raar_name =
:"SYS_B_07" )) / :"SYS_B_08" / :"SYS_B_09")) ORDER BY TO_NUMBER(A.NAME)
) RESULTS WHERE RESULTS.IDX BETWEEN :"SYS_B_10" AND :"SYS_B_11"

Plan hash value: 2185860753

-----------------------------------------------------------------------------------------------------------------------------------------------------------------
| Id  | Operation                                  | Name                          | Starts | E-Rows | A-Rows |   A-Time   | Buffers |  OMem |  1Mem | Used-Mem |
-----------------------------------------------------------------------------------------------------------------------------------------------------------------
|   0 | SELECT STATEMENT                           |                               |      1 |        |     15 |00:00:00.62 |     353K|       |       |          |
|*  1 |  FILTER                                    |                               |      1 |        |     15 |00:00:00.62 |     353K|       |       |          |
|*  2 |   VIEW                                     |                               |      1 |   5530 |     15 |00:00:00.62 |     353K|       |       |          |
|   3 |    SORT ORDER BY                           |                               |      1 |   5530 |   7873 |00:00:00.62 |     353K|   549K|   457K|  487K (0)|
|   4 |     COUNT                                  |                               |      1 |        |   7873 |00:00:00.46 |     353K|       |       |          |
|   5 |      NESTED LOOPS                          |                               |      1 |   5530 |   7873 |00:00:00.46 |     353K|       |       |          |
|   6 |       NESTED LOOPS                         |                               |      1 |   5530 |    266K|00:00:00.44 |     240K|       |       |          |
|   7 |        NESTED LOOPS                        |                               |      1 |   5530 |    266K|00:00:00.19 |   46039 |       |       |          |
|*  8 |         TABLE ACCESS FULL                  | INF_KRA_PRIMAR_RANGE          |      1 |   4392 |     90 |00:00:00.01 |     878 |       |       |          |
|   9 |         TABLE ACCESS BY INDEX ROWID BATCHED| INF_KRA_PRIMAR_B              |     90 |      1 |    266K|00:00:00.17 |   45161 |       |       |          |
|* 10 |          INDEX RANGE SCAN                  | EAI_NUMBER_REL_1              |     90 |      1 |    266K|00:00:00.04 |    3871 |       |       |          |
|* 11 |        INDEX UNIQUE SCAN                   | PK_INF_KRA_PRIMAR             |    266K|      1 |    266K|00:00:00.20 |     194K|       |       |          |
|* 12 |       TABLE ACCESS BY INDEX ROWID          | INF_KRA_PRIMAR                |    266K|      1 |   7873 |00:00:00.20 |     113K|       |       |          |
|  13 |        TABLE ACCESS BY INDEX ROWID BATCHED | PAM_KRIAIS_MAINFATRAARA_AHAH  |      1 |      1 |      1 |00:00:00.01 |       2 |       |       |          |
|* 14 |         INDEX RANGE SCAN                   | IDXGETNUMBERPD1               |      1 |      1 |      1 |00:00:00.01 |       1 |       |       |          |
-----------------------------------------------------------------------------------------------------------------------------------------------------------------

Outline Data
-------------

  /*+
      BEGIN_OUTLINE_DATA
      IGNORE_OPTIM_EMBEDDED_HINTS
      OPTIMIZER_FEATURES_ENABLE('12.2.0.1')
      DB_VERSION('12.2.0.1')
      OPT_PARAM('optimizer_index_cost_adj' 10)
      FIRST_ROWS(1)
      OUTLINE_LEAF(@"SEL$3")
      OUTLINE_LEAF(@"SEL$2")
      OUTLINE_LEAF(@"SEL$1")
      NO_ACCESS(@"SEL$1" "RESULTS"@"SEL$1")
      FULL(@"SEL$2" "C"@"SEL$2")
      INDEX_RS_ASC(@"SEL$2" "B"@"SEL$2" ("INF_KRA_PRIMAR_B"."TARGET_OBJECT_ID" "INF_KRA_PRIMAR_B"."BINDING_NAME"))
      BATCH_TABLE_ACCESS_BY_ROWID(@"SEL$2" "B"@"SEL$2")
      INDEX(@"SEL$2" "A"@"SEL$2" ("INF_KRA_PRIMAR"."MANDNA_KKAJ_DI"))
      LEADING(@"SEL$2" "C"@"SEL$2" "B"@"SEL$2" "A"@"SEL$2")
      USE_NL(@"SEL$2" "B"@"SEL$2")
      USE_NL(@"SEL$2" "A"@"SEL$2")
      NLJ_BATCHING(@"SEL$2" "A"@"SEL$2")
      PUSH_SUBQ(@"SEL$3")
      INDEX_RS_ASC(@"SEL$3" "PAM_KRIAIS_MAINFATRAARA_AHAH"@"SEL$3" ("PAM_KRIAIS_MAINFATRAARA_AHAH"."mark_raar_NAME"))
      BATCH_TABLE_ACCESS_BY_ROWID(@"SEL$3" "PAM_KRIAIS_MAINFATRAARA_AHAH"@"SEL$3")
      END_OUTLINE_DATA
  */

Predicate Information (identified by operation id):
---------------------------------------------------

   1 - filter(:SYS_B_11>=:SYS_B_10)
   2 - filter(("RESULTS"."IDX">=:SYS_B_10 AND "RESULTS"."IDX"<=:SYS_B_11))
   8 - filter((NVL("C"."CATEGORY",'Range')=:SYS_B_04 AND NVL("C"."NUMBER_USAGE",:SYS_B_06)=:SYS_B_05 AND "C"."STATUS"=NVL(:SYS_B_03,"C"."STATUS")))
  10 - access("C"."MANDNA_KKAJ_DI"="B"."TARGET_OBJECT_ID" AND "B"."BINDING_NAME"=:SYS_B_02)
  11 - access("B"."OWNING_OBJECT_ID"="A"."MANDNA_KKAJ_DI")
  12 - filter(("A"."TYPE"=:SYS_B_00 AND "A"."STATUS"=:SYS_B_01 AND "A"."ASSIGNED_CSN_ID" IS NULL AND ("A"."LOCK_ID" IS NULL OR
              "A"."LOCK_DATE"<=SYSDATE@!-NVL("A"."LOCK_PERIOD",)/:SYS_B_08/:SYS_B_09)))
  14 - access("mark_raar_NAME"=:SYS_B_07)


77 rows selected.

SQL>


-- Lets try a more sophisticated one to get all sorts of information available

SQL>
SQL>
SQL> SELECT * FROM TABLE(dbms_xplan.display_cursor(sql_id => '0m329sngnhv1p', FORMAT => 'ADVANCED +ROWS +BYTES +COST +PARALLEL +PARTITION +IOSTATS +MEMSTATS +ALIAS +PEEKED_BINDS +OUTLINE +PREDICATE +PROJECTION +REMOTE +NOTE'));

PLAN_TABLE_OUTPUT
----------------------------------------------------------------------------------------------------------------------------------------------------------------------------------------------------------------------------------------------------------------------------------------------------------------------------------------------------------------------------------------------------------------
SQL_ID  0m329sngnhv1p, child number 0
-------------------------------------
SELECT /*+ gather_plan_statistics */ * FROM (SELECT
A.MANDNA_KKAJ_DI,A.NAME,ROWNUM IDX FROM DIXDROI.INF_KRA_PRIMAR
A,DIXDROI.INF_KRA_PRIMAR_B B,DIXDROI.INF_KRA_PRIMAR_RANGE C WHERE
A.TYPE=:"SYS_B_00" AND A.STATUS=:"SYS_B_01" AND A.ASSIGNED_CSN_ID IS
NULL AND B.OWNING_OBJECT_ID=A.MANDNA_KKAJ_DI AND
B.BINDING_NAME=:"SYS_B_02" AND C.MANDNA_KKAJ_DI=B.TARGET_OBJECT_ID AND
C.STATUS = NVL(:"SYS_B_03", C.STATUS) AND C.CATEGORY = :"SYS_B_04" AND
:"SYS_B_05" = NVL(C.NUMBER_USAGE,:"SYS_B_06") AND (A.lock_id IS NULL OR
A.LOCK_DATE <= (sysdate - NVL(A.LOCK_PERIOD,(SELECT mark_raar_value
FROM DIXDROI.PAM_KRIAIS_MAINFATRAARA_AHAH WHERE mark_raar_name =
:"SYS_B_07" )) / :"SYS_B_08" / :"SYS_B_09")) ORDER BY TO_NUMBER(A.NAME)
) RESULTS WHERE RESULTS.IDX BETWEEN :"SYS_B_10" AND :"SYS_B_11"

Plan hash value: 2185860753

---------------------------------------------------------------------------------------------------------------------------------------------------------------------------------------------------------
| Id  | Operation                                  | Name                          | Starts | E-Rows |E-Bytes|E-Temp | Cost (%CPU)| E-Time   | A-Rows |   A-Time   | Buffers |  OMem |  1Mem |  O/1/M   |
---------------------------------------------------------------------------------------------------------------------------------------------------------------------------------------------------------
|   0 | SELECT STATEMENT                           |                               |      1 |        |       |       |  3753 (100)|          |     15 |00:00:00.62 |     353K|       |       |          |
|*  1 |  FILTER                                    |                               |      1 |        |       |       |            |          |     15 |00:00:00.62 |     353K|       |       |          |
|*  2 |   VIEW                                     |                               |      1 |   5530 |   286K|       |  3753   (1)| 00:00:01 |     15 |00:00:00.62 |     353K|       |       |          |
|   3 |    SORT ORDER BY                           |                               |      1 |   5530 |   918K|  1064K|  3753   (1)| 00:00:01 |   7873 |00:00:00.62 |     353K|   549K|   457K|     1/0/0|
|   4 |     COUNT                                  |                               |      1 |        |       |       |            |          |   7873 |00:00:00.46 |     353K|       |       |          |
|   5 |      NESTED LOOPS                          |                               |      1 |   5530 |   918K|       |  3544   (1)| 00:00:01 |   7873 |00:00:00.46 |     353K|       |       |          |
|   6 |       NESTED LOOPS                         |                               |      1 |   5530 |   918K|       |  3544   (1)| 00:00:01 |    266K|00:00:00.44 |     240K|       |       |          |
|   7 |        NESTED LOOPS                        |                               |      1 |   5530 |   615K|       |  2437   (1)| 00:00:01 |    266K|00:00:00.19 |    46039|       |       |          |
|*  8 |         TABLE ACCESS FULL                  | INF_KRA_PRIMAR_RANGE          |      1 |   4392 | 92232 |       |   240   (1)| 00:00:01 |     90 |00:00:00.01 |      878|       |       |          |
|   9 |         TABLE ACCESS BY INDEX ROWID BATCHED| INF_KRA_PRIMAR_B              |     90 |      1 |    93 |       |     1   (0)| 00:00:01 |    266K|00:00:00.17 |    45161|       |       |          |
|* 10 |          INDEX RANGE SCAN                  | EAI_NUMBER_REL_1              |     90 |      1 |       |       |     1   (0)| 00:00:01 |    266K|00:00:00.04 |     3871|       |       |          |
|* 11 |        INDEX UNIQUE SCAN                   | PK_INF_KRA_PRIMAR             |    266K|      1 |       |       |     1   (0)| 00:00:01 |    266K|00:00:00.20 |     194K|       |       |          |
|* 12 |       TABLE ACCESS BY INDEX ROWID          | INF_KRA_PRIMAR                |    266K|      1 |    56 |       |     1   (0)| 00:00:01 |   7873 |00:00:00.20 |     113K|       |       |          |
|  13 |        TABLE ACCESS BY INDEX ROWID BATCHED | PAM_KRIAIS_MAINFATRAARA_AHAH  |      1 |      1 |    28 |       |     1   (0)| 00:00:01 |      1 |00:00:00.01 |        2|       |       |          |
|* 14 |         INDEX RANGE SCAN                   | IDXGETNUMBERPD1               |      1 |      1 |       |       |     1   (0)| 00:00:01 |      1 |00:00:00.01 |        1|       |       |          |
---------------------------------------------------------------------------------------------------------------------------------------------------------------------------------------------------------

Query Block Name / Object Alias (identified by operation id):
-------------------------------------------------------------

   1 - SEL$1
   2 - SEL$2 / RESULTS@SEL$1
   3 - SEL$2
   8 - SEL$2 / C@SEL$2
   9 - SEL$2 / B@SEL$2
  10 - SEL$2 / B@SEL$2
  11 - SEL$2 / A@SEL$2
  12 - SEL$2 / A@SEL$2
  13 - SEL$3 / PAM_KRIAIS_MAINFATRAARA_AHAH@SEL$3
  14 - SEL$3 / PAM_KRIAIS_MAINFATRAARA_AHAH@SEL$3

Outline Data
-------------

  /*+
      BEGIN_OUTLINE_DATA
      IGNORE_OPTIM_EMBEDDED_HINTS
      OPTIMIZER_FEATURES_ENABLE('12.2.0.1')
      DB_VERSION('12.2.0.1')
      OPT_PARAM('optimizer_index_cost_adj' 10)
      FIRST_ROWS(1)
      OUTLINE_LEAF(@"SEL$3")
      OUTLINE_LEAF(@"SEL$2")
      OUTLINE_LEAF(@"SEL$1")
      NO_ACCESS(@"SEL$1" "RESULTS"@"SEL$1")
      FULL(@"SEL$2" "C"@"SEL$2")
      INDEX_RS_ASC(@"SEL$2" "B"@"SEL$2" ("INF_KRA_PRIMAR_B"."TARGET_OBJECT_ID" "INF_KRA_PRIMAR_B"."BINDING_NAME"))
      BATCH_TABLE_ACCESS_BY_ROWID(@"SEL$2" "B"@"SEL$2")
      INDEX(@"SEL$2" "A"@"SEL$2" ("INF_KRA_PRIMAR"."MANDNA_KKAJ_DI"))
      LEADING(@"SEL$2" "C"@"SEL$2" "B"@"SEL$2" "A"@"SEL$2")
      USE_NL(@"SEL$2" "B"@"SEL$2")
      USE_NL(@"SEL$2" "A"@"SEL$2")
      NLJ_BATCHING(@"SEL$2" "A"@"SEL$2")
      PUSH_SUBQ(@"SEL$3")
      INDEX_RS_ASC(@"SEL$3" "PAM_KRIAIS_MAINFATRAARA_AHAH"@"SEL$3" ("PAM_KRIAIS_MAINFATRAARA_AHAH"."mark_raar_NAME"))
      BATCH_TABLE_ACCESS_BY_ROWID(@"SEL$3" "PAM_KRIAIS_MAINFATRAARA_AHAH"@"SEL$3")
      END_OUTLINE_DATA
  */

Peeked Binds (identified by position):
--------------------------------------

   1 - :1 (VARCHAR2(30), CSID=873): 'MOBILE'
   2 - :2 (VARCHAR2(30), CSID=873): 'Available'
   3 - (VARCHAR2(30), CSID=873): 'com.paratapata.killer.mfs.oare.mainframe.locking.ADAKingstonToKillerRangeStst'
   4 - (VARCHAR2(30), CSID=873): 'Active'
   5 - (VARCHAR2(30), CSID=873): 'Range'
   6 - (VARCHAR2(30), CSID=873): 'Internal'
   7 - (VARCHAR2(30), CSID=873): 'External'

Predicate Information (identified by operation id):
---------------------------------------------------

   1 - filter(:SYS_B_11>=:SYS_B_10)
   2 - filter(("RESULTS"."IDX">=:SYS_B_10 AND "RESULTS"."IDX"<=:SYS_B_11))
   8 - filter((NVL("C"."CATEGORY",'Range')=:SYS_B_04 AND NVL("C"."NUMBER_USAGE",:SYS_B_06)=:SYS_B_05 AND "C"."STATUS"=NVL(:SYS_B_03,"C"."STATUS")))
  10 - access("C"."MANDNA_KKAJ_DI"="B"."TARGET_OBJECT_ID" AND "B"."BINDING_NAME"=:SYS_B_02)
  11 - access("B"."OWNING_OBJECT_ID"="A"."MANDNA_KKAJ_DI")
  12 - filter(("A"."TYPE"=:SYS_B_00 AND "A"."STATUS"=:SYS_B_01 AND "A"."ASSIGNED_CSN_ID" IS NULL AND ("A"."LOCK_ID" IS NULL OR
              "A"."LOCK_DATE"<=SYSDATE@!-NVL("A"."LOCK_PERIOD",)/:SYS_B_08/:SYS_B_09)))
  14 - access("mark_raar_NAME"=:SYS_B_07)

Column Projection Information (identified by operation id):
-----------------------------------------------------------

   1 - "RESULTS"."MANDNA_KKAJ_DI"[NUMBER,22], "RESULTS"."NAME"[VARCHAR2,50], "RESULTS"."IDX"[NUMBER,22]
   2 - "RESULTS"."MANDNA_KKAJ_DI"[NUMBER,22], "RESULTS"."NAME"[VARCHAR2,50], "RESULTS"."IDX"[NUMBER,22]
   3 - (#keys=1) TO_NUMBER("NAME")[22], "A"."MANDNA_KKAJ_DI"[NUMBER,22], "A"."NAME"[VARCHAR2,50], ROWNUM[22]
   4 - "A"."MANDNA_KKAJ_DI"[NUMBER,22], "NAME"[VARCHAR2,50], ROWNUM[8]
   5 - "A"."MANDNA_KKAJ_DI"[NUMBER,22], "NAME"[VARCHAR2,50]
   6 - "A".ROWID[ROWID,10], "A"."MANDNA_KKAJ_DI"[NUMBER,22]
   7 - "B"."OWNING_OBJECT_ID"[NUMBER,22]
   8 - "C"."MANDNA_KKAJ_DI"[NUMBER,22]
   9 - "B"."OWNING_OBJECT_ID"[NUMBER,22]
  10 - "B".ROWID[ROWID,10]
  11 - "A".ROWID[ROWID,10], "A"."MANDNA_KKAJ_DI"[NUMBER,22]
  12 - "NAME"[VARCHAR2,50]
  13 - "mark_raar_VALUE"[NUMBER,22]
  14 - "PAM_KRIAIS_MAINFATRAARA_AHAH".ROWID[ROWID,10]


120 rows selected.

SQL>
Recently I have encountered an issue where frequent errors were captured in the alert log file about the on demand materialized view refresh failure. The main error reported was ORA-12034: materialized view log on “DIXDROID”.”TEST_STATS” younger than last refresh.
On demand
MV DIXDROID.PRAS_ID_MV was not refreshed successfully.
Number of MV refresh failures: 1.
Encountered error ORA-12034.
kkzifr3g: Encountered error ORA-12034.
2022-01-06T11:14:49.885045+02:00
Errors in file /monkeydb/can/ontadb/rdbms/ontadb/ONTADB/trace/ONTADB_j000_5663.trc:
ORA-12012: error on auto execute of job 1
ORA-12034: materialized view log on "DIXDROID"."TEST_STATS" younger than last refresh
ORA-06512: at "SYS.DBMS_SNAPSHOT_KKXRCA", line 2960
ORA-06512: at "SYS.DBMS_SNAPSHOT_KKXRCA", line 2378
ORA-06512: at "SYS.DBMS_SNAPSHOT_KKXRCA", line 85
ORA-06512: at "SYS.DBMS_SNAPSHOT_KKXRCA", line 245
ORA-06512: at "SYS.DBMS_SNAPSHOT_KKXRCA", line 2360
ORA-06512: at "SYS.DBMS_SNAPSHOT_KKXRCA", line 2916
ORA-06512: at "SYS.DBMS_SNAPSHOT_KKXRCA", line 3199
ORA-06512: at "SYS.DBMS_SNAPSHOT_KKXRCA", line 3255
ORA-06512: at "SYS.DBMS_SNAPSHOT", line 41
ORA-06512: at "SYS.DBMS_IREFRESH", line 703
ORA-06512: at "SYS.DBMS_REFRESH", line 214
ORA-06512: at line 1
It was pointing to the Materialized View Log, about materialized view logs, they are created for a master table, and a materialized view has been created with the REFRESH FAST option, the following timestamps will be used when validating log age.
About potential causes, there could be many i.e.
Definition of the master table is altered.
The last refresh was failed for some reasons.
Altering the master table so that changes don’t go to the materialized view log i.e. truncate, alter partitions drop or truncate
Master table reorganization or when when issuing an MV log purge
Now about the solution, in our case this issue happens when a complete refresh is required before the next fast refresh. So I did the COMPLETE refresh for the MV in question and did the FAST refresh soon after that and that has fixed the issue.
SQL*Plus: Release 12.2.0.1.0 Production on Thu Jan 6 11:14:07 2022

Copyright (c) 1982, 2016, Oracle.  All rights reserved.

Enter user-name: / as sysdba

Connected to:
Oracle Database 12c Enterprise Edition Release 12.2.0.1.0 - 64bit Production

SQL>

-- Following command will perform first time COMPLETE refresh on the materialized views
SQL> execute dbms_snapshot.refresh ('DIXDROID.PRAS_ID_MV', 'C');

PL/SQL procedure successfully completed.

-- After this first time COMPLETE refresh, the successive FAST refresh will be successful.
SQL> execute dbms_snapshot.refresh ('DIXDROID.PRAS_ID_MV', 'F');

PL/SQL procedure successfully completed.

SQL>
Today, one of the customer’s application architect during a team meet asked me if its possible to have the SQL ID in advance, before the SQL execution ? And luckily, I know that’s possible (through Connor McDonald‘s blog post on the same subject) and I was immediately able to answer the customer with a confident ‘Yes, that’s possible!’ 🙂
When I asked, why he want to do that, he said that they are planning to integrate a new module to their CRM application, first into development environment where they want to catch all expensive SQLs, their IDs in advance and later on compare it with the UAT environment and to get some anticipations on SQL runtime latencies. That I guess is a valid reason to have the SQL IDs in advance.
If you’re using Oracle 18c or above then you can use SET FEEDBACK ON SQL_ID, which means the SQL_ID for the currently executed SQL or PL/SQL statement is displayed after the results. This is very useful, and a huge time saver, when all you need is to know the SQL_ID. When feedback for SQL_ID is ON, then the value of the SQL_ID is assigned to a predefined variable _SQL_ID
And if you’re running below 18c then you can use dbms_sql_translator.sql_id package, it provides an interface for creating, configuring, and using SQL translation profiles, and you can use one of its function sql_id to get the SQLID in advance.
Let’s do the demo for both! Though I am running this on 12c, but still be able to use both options as connecting to the database via SQLcl (a SQL Dev CLI) version 21.4 and that has both the options available.
[oracle@ontadomain.fatdba bin]$ ./sql ontadbschema/xxxxxxxxx@testdb_ha

SQLcl: Release 21.4 Production on Tue Jan 04 02:58:04 2022
Copyright (c) 1982, 2022, Oracle.  All rights reserved.
Last Successful login time: Tue Jan 04 2022 02:58:06 +02:00

Connected to:
Oracle Database 12c Enterprise Edition Release 12.2.0.1.0 - 64bit Production

SQL>  select * from dixdroid.testtable;

               STATS_CORRNAME    STATS_CORRVALUE  STATS_CORRDESC
_____________________________ __________________ _________________
DEFAULT_LOCK_DURATI                           60 SECONDS
FIX_ALLOWED_LOCK_DURATI                      120 SECONDS
FIX_RETURNABLE_NUMBERS                       200
FIX_RETURNABLE_RANGES                         10
DEFAULT_RESERVATION_DURATI                    60 MINUTES

SQL>


-- Now trying the first approach which will work on < 18c versions.
SQL>
SQL> select dbms_sql_translator.sql_id('select * from dixdroid.testtable where STATS_CORRVALUE > 150') from dual;

1 row selected.

SQL_ID: 16jcpmjs087ct


-- Trying the second approach using SET FEEDBACK which works great if running >= 18c
SQL> set feedback only sql_id
SQL> select * from dixdroid.testtable where STATS_CORRVALUE > 150;

1 row selected.

SQL_ID: 16jcpmjs087ct
SQL>
SQL>
Last week I was looking into a database problem where the customer reported database hang issues when trying to use their Java based application, and that application requires to connect with the database every now and then. This was a brand new platform where they were doing some UAT testing’s and were using WebLogic which they recently configured to use with connection pooling enabled.
Application team reported that they are getting frequent ‘ORA-00018 maximum number of sessions exceeded’ errors in the alert log and that was a big clue. Operations team tried many times to identify all INACTIVE sessions (session limit was 800 in the DB) and manually kill them, but new JDBC Thin Client gets spawns every time … I was sure that this is most probably the JDBC connection leak issue, and those are always difficult to identify!
This is what it was, the peak at the time of issue
Now talking about – How to detect this problem ?. Though there were multiple other performance problem on this platform, but none of them seems related with the SQLs, as the execution plan were perfect and reflects a well designed SQL workload. So I suspected the application, started with the WebLogic server logs and there I saw multiple instances of “BEA-000627 Reached maximum capacity of pool “cgDataSource”, making “0” new resource instances instead of “1” “ warnings, and with that, it once again solidified my initial assumption that it as happening all as a result of applications’ code not closing connections properly, connection leakage.
A leaked connection is a connection that was not properly returned to the connection pool in the data source. To automatically recover leaked connections, you can specify a value for Inactive Connection Timeout on the JDBC Data Source. When you set a value for Inactive Connection Timeout, WebLogic Server forcibly returns a connection to the data source when there is no activity on a reserved connection for the number of seconds that you specify. When set to 0 (the default value), this feature is turned off. So we have to we need to set one specific parameter for the data source to force close those connections that are not closed by the application.
Click on Services --> Data Sources --> Click on the Data Source you want to configure --> Click on Connection Pool --> Click on Advanced --> “Inactive Connection Timeout”
And it was set to its default value of 0, means no inactive sessions will be snapped or removed and will stay in the database and consume sessions limit. After carefull observation and a discussion with the team, we set it to a reasonable value and bounced Weblogic Admin and manager servers (MS) to make changes persistent.
But if this was the solution to the problem ? No, it was not! and is always a remedy, to immediately handle the situation while the root cause of the problem is investigated. I later on investigated the log files in order to isolate the culprit class. Also noticed that after we’d set the ‘Inactive Connection Timeout’ setting, multiple instances of BEA-001153 Warnings were captured within logs. This was because the code does not close the connection, and was waiting for the “Inactive connection timeout” to trigger closure of these objects and that had caused the warning message printed in the admin server logs.
<Dec 3, 2021 10:12:34 AM GMT>
<Warning> <JDBC> <BEA-001153> <Forcibly releasing inactive connection "weblogic.jdbc.wrapper.PoolConnection_oracle_jdbc_driver_xxCConnection@xxx" back into the connection pool "xxxxxxxx-xxx", currently reserved by: java.lang.Exception
at weblogic.jdbc.common.internal.ConnectionEnv.setup(ConnectionEnv.java:325)
at weblogic.common.resourcepool.ResourcePoolImpl.reserveResource(ResourcePoolImpl.java:363)
at weblogic.common.resourcepool.ResourcePoolImpl.reserveResource(ResourcePoolImpl.java:329)
at weblogic.jdbc.common.internal.ConnectionPool.reserve(ConnectionPool.java:417)
at weblogic.jdbc.common.internal.ConnectionPool.reserve(ConnectionPool.java:324)
at weblogic.jdbc.common.internal.MultiPool.searchLoadBalance(MultiPool.java:312)
at weblogic.jdbc.common.internal.MultiPool.findPool(MultiPool.java:180)
at weblogic.jdbc.common.internal.ConnectionPoolManager.reserve(ConnectionPoolManager.java:89)
at weblogic.jdbc.common.internal.RmiDataSource.getPoolConnection(RmiDataSource.java:350)
at weblogic.jdbc.common.internal.RmiDataSource.getConnection(RmiDataSource.java:369)
at oracle.jbo.server.DBTransactionImpl.establishNewConnection(DBTransactionImpl.java:990)
.....
..........
Later I collected JDBC Diagnostic Dumps via admin console to detect and further troubleshoot this JDBC Connection Leak.
Dumping Resource Pool:cgDataSource
Resource Pool:cgDataSource:dumpPool Current Capacity = 4
Resource Pool:cgDataSource:dumpPool dumping available resources, #entries = 0
Resource Pool:cgDataSource:dumpPool dumping reserved resources, #entries = 4
Resource Pool:cgDataSource:dumpPool reserved[0] = autoCommit=true, enabled=true, isXA=true, isJTS=false, vendorID=11, connUsed=true, doInit=false, 'null', destroyed=false, poolname=cgDataSource, appname=null, moduleName=null, connectTime=4941, dirtyIsolationLevel=false, initialIsolationLevel=2, infected=false, lastSuccessfulConnectionUse=1344715611974, secondsToTrustAnIdlePoolConnection=10, currentUser=java.lang.Exception
  at weblogic.jdbc.common.internal.ConnectionEnv.setup(ConnectionEnv.java:308)
  at weblogic.common.resourcepool.ResourcePoolImpl.reserveResource(ResourcePoolImpl.java:314)
  at weblogic.common.resourcepool.ResourcePoolImpl.reserveResource(ResourcePoolImpl.java:292)
  at weblogic.jdbc.common.internal.ConnectionPool.reserve(ConnectionPool.java:425)
  at weblogic.jdbc.common.internal.ConnectionPool.reserve(ConnectionPool.java:316)
  at weblogic.jdbc.common.internal.ConnectionPoolManager.reserve(ConnectionPoolManager.java:93)
  at weblogic.jdbc.common.internal.ConnectionPoolManager.reserve(ConnectionPoolManager.java:61)
  at weblogic.jdbc.jta.DataSource.getXAConnectionFromPool(DataSource.java:1473)
  at weblogic.jdbc.jta.DataSource.refreshXAConnAndEnlist(DataSource.java:1302)
  at weblogic.jdbc.jta.DataSource.getConnection(DataSource.java:425)
  at weblogic.jdbc.jta.DataSource.connect(DataSource.java:382)
  at weblogic.jdbc.common.internal.RmiDataSource.getConnection(RmiDataSource.java:338)
  at troubleshooting.servlets.JdbcConnections.service(JdbcConnections.java:97)
  at javax.servlet.http.HttpServlet.service(HttpServlet.java:820)
  at weblogic.servlet.internal.StubSecurityHelper$ServletServiceAction.run(StubSecurityHelper.java:227)
......
.........
at weblogic.jdbc.common.internal.RmiDataSource.getConnection(RmiDataSource.java:338)
  at troubleshooting.servlets.JdbcConnections.service(JdbcConnections.java:97)
  at javax.servlet.http.HttpServlet.service(HttpServlet.java:820)
  at weblogic.servlet.internal.StubSecurityHelper$ServletServiceAction.run(StubSecurityHelper.java:227)
.........
...............
at weblogic.jdbc.common.internal.RmiDataSource.getConnection(RmiDataSource.java:338)
  at troubleshooting.servlets.JdbcConnections.service(JdbcConnections.java:97)
  at javax.servlet.http.HttpServlet.service(HttpServlet.java:820)
  at weblogic.servlet.internal.StubSecurityHelper$ServletServiceAction.run(StubSecurityHelper.java:227)
.....
......
at weblogic.jdbc.common.internal.RmiDataSource.getConnection(RmiDataSource.java:338)
  at troubleshooting.servlets.JdbcConnections.service(JdbcConnections.java:97)
  at javax.servlet.http.HttpServlet.service(HttpServlet.java:820)
  at weblogic.servlet.internal.StubSecurityHelper$ServletServiceAction.run(StubSecurityHelper.java:227)
......
.........
If you watch carefully, on all the dumps above, the method that initiates the connection to the database is troubleshooting.servlets.JdbcConnections.service(), specifically at line 97 on Class JdbcConnections.java, as the stack says.
We went back to the source code for the application (dummy code):
      } else if (i == -1) {
        try {
          InitialContext localInitialContext2 = new InitialContext();

          DataSource localDataSource = (DataSource)localInitialContext2.lookup("cgDataSource");    <========== HERE IS WHERE THE LEAK STARTS

          localObject = localDataSource.getConnection();
          localObject = null;                                                                      <========== HERE IS WHERE THE LEAK OCCURS, WHEN OBJECT IS SET TO NULL BUT CONNECTION NOT CLOSED.
          System.out.println("xxxxxxxxx.");
          localInitialContext2.close();
        } catch (Exception localException2) {
localPrintWriter.println("An exception has been thrown while trying to increase the number of JDBC connection to " + i + ", the error is<br><br>");
And application team immediately recognized the cause, there was a need to explicitly closed the connection and was later on fixed by the application team to something below.
          InitialContext localInitialContext2 = new InitialContext();

          DataSource localDataSource = (DataSource)localInitialContext2.lookup("cgDataSource");

          localObject = localDataSource.getConnection();

          System.out.println("xxxxxxxxx.");
          localInitialContext2.close();
        } catch (Exception localException2) {
          localPrintWriter.println("An exception has been thrown while trying to increase the number of JDBC connection to " + i + ", the error is<br><br>");

        } finally{

          localObject.close()
          localObject = null;

         }
So, that’s how it got resolved after changing the problematic code. Connection leakage is a very tricky scenario which requires careful observation primarily of the application code.
Today while doing an analysis for a very complex & a big SQL query (402 lines), I tried to use the Real Time SQL Monitoring Report to get some quick stats about the execution, but it failed and it didn’t showed me any output.
Luckily I found a great article written by my friendMohamed Houriand a metalink note for the problem (Doc ID 1613163.1), which says that there is a default limitation (300 lines) on the plan lines, and the threshold is in place to avoid spending too much time processing these large statements at the expense of other activities. So anything that has more than 300 plan lines won’t be monitored!
The fix to the problem is to set a hidden parameter which can be used to set the limit to a higher value, or you can set it on your SPFILE.
-- To change the default limit to any user defined value.
alter system set "_sqlmon_max_planlines"=450 scope=both;

-- or set it in your SPFILE
_sqlmon_max_planlines=450