Recently someone shared me an AWR report from a production 19c system, and he was very tensed about one of the strange looking wait event called ‘TCP Socket (KGAS)’. He was strained because the event was coming with a very high average wait time of 7863.68ms (7.86 seconds), and was consuming around 98.0% of the total DB Time.
Luckily I’d encountered something similar in the past for one of the customer, where the application team was unable to send the mail as DBMS scheduler, and it was stuck for a long time with wait event “TCP Socket(KGAS)” where problem was not with the scheduler, but was an underlying network or third-party application problem.
So, today’s post is all about the wait event, what it is, how to resolve it etc.
KGAS is a element in the server which handles TCP/IP sockets which is typically used in dedicated connections i.e. by some PLSQL built in packages such as UTL_HTTP and UTL_TCP. A session is waiting for an external host to provide requested data over a network socket. The time that this wait event tracks does not indicate a problem, and even a long wait time is not a reason to contact Oracle Support. It naturally takes time for data to flow between hosts over a network, and for the remote aspect of an application to process any request made to it. An application that communicates with a remote host must wait until the data it will read has arrived.
From an application/network point of view, delays in establishing a network connection may produce unwanted delays for users. We should make sure that the application makes network calls efficiently and that the network is working well such that these delays are minimized.
From the database point of view, these waits can safely be ignored; the wait event does not represent a database issue. It merely reports the total elapsed time for a network connection to be established or for data to arrive from over the network. The database waits for the connection to be established and reports the time taken. Its always good to check with the network or the third-party application vendors to investigate the underlying socket.
But in case of systemwide waits – If the TIME spent waiting for this event is significant then it is best to determine which sessions are showing the wait and drill into what those sessions are doing as the wait is usually related to whatever application code is executing eg: What part of the application may be using UTL_HTTP or similar and is experiencing waits. This statement can be used to see which sessions may be worth tracing
SELECT sid, total_waits, time_waited
FROM v$session_event WHERE event='TCP Socket (KGAS)' and total_waits>0 ORDER BY 3,2;
In order to reduce these waits or to help find the origin of the socket operations try:
Check the current SQL/module/action of V$SESSION for sessions that are waiting on the event at the time that they are waiting to try and identify any common area of application code waiting on the event.
Get an ERRORSTACK level 3 dump of some sessions waiting on the event. This should help show the exact PLSQL and C call stacks invoking the socket operation if the dump is taken when the session is waiting. Customers may need assistance from Oracle Support in order to get and interpret such a dump but it can help pinpoint the relevant application code.
Trace sessions incurring the waits including wait tracing to try and place the waits in the context of the code executing around the waits. eg: Use event 10046 level 8 or DBMS_MONITOR.SESSION_TRACE_ENABLE.
Use DBA_DEPENDENCIES to find any application packages which may ultimately be using UTL_HTTP or UTL_TCP underneath for some operation.
Example: Execute the following SQL from a session on a dedicated connection and then check the resulting trace file to see “TCP Socket (KGAS)” waits:
alter session set events '10046 trace name context forever, level 8';
Hello All, my blog FatDBA have been awarded with the ‘Top 100 Oracle Blogs on the planet‘ (Rank 27) by feedspot. The best Oracle blog list curated from thousands of blogs on the web and ranked by traffic, social media followers, domain authority & freshness.
Alert log is always been a very important logfile which contain important information about error messages and exceptions that occur during database operations. Its very crucial for any analysis or for troubleshooting any critical event that has happened. Specially over the period of last few years, with all those new database releases, its slowly becoming very messy, loud and has got whole lot of new content added to it that it has to record for all those regular and critical database events, and finally with the inception of Oracle 21c we have the ‘Attention Log‘ that helps to segregate all those critical and vital events which otherwise gets mixed up with other regular incidents of alertlog file.
Each of the database has its own Attention log and is a regular JSON format file which is very easy to translate. Few of the important dimensions or its properties are URGENCY: Class with possible values INFO, IMMEDIATE etc. CAUSE : A quick detail about the possible cause or reason. NOTIFICATION : A regular message in case of any event i.e. “PMON (ospid: 1901): terminating the instance due to ORA error 12752” etc. ACTION : What possibly you can do TIME : A timestamp of the event
Let’s see how it looks like!
[oracle@witnessalberta ~]$ !sql
sqlplus / as sysdba

SQL*Plus: Release 21.0.0.0.0 - Production on Fri Apr 8 22:38:25 2022
Version 21.3.0.0.0

Copyright (c) 1982, 2021, Oracle.  All rights reserved.


Connected to:
Oracle Database 21c Enterprise Edition Release 21.0.0.0.0 - Production
Version 21.3.0.0.0

SQL> set linesize 400 pagesize 400


SQL> col NAME for a30
SQL> col value for a70
SQL>
SQL> select name, value from v$diag_info where value like '%attention%';

NAME                           VALUE
------------------------------ ----------------------------------------------------------------------
Attention Log                  /opt/oracle/diag/rdbms/orclcdb/ORCLCDB/trace/attention_ORCLCDB.log


[oracle@witnessalberta trace]$ pwd
/opt/oracle/diag/rdbms/orclcdb/ORCLCDB/trace
[oracle@witnessalberta trace]$

[oracle@witnessalberta trace]$
[oracle@witnessalberta trace]$ ls -ltrh *.log*
-rw-r-----. 1 oracle oinstall 6.0K Apr  8 22:32 attention_ORCLCDB.log
-rw-r-----. 1 oracle oinstall 244K Apr  8 22:34 alert_ORCLCDB.log
[oracle@witnessalberta trace]$


{
  "NOTIFICATION" : "Starting ORACLE instance (normal) (OS id: 3309)",
  "URGENCY"      : "INFO",
  "INFO"         : "Additional Information Not Available",
  "CAUSE"        : "A command to startup the instance was executed",
  "ACTION"       : "Check alert log for progress and completion of command",
  "CLASS"        : "CDB Instance / CDB ADMINISTRATOR / AL-1000",
  "TIME"         : "2022-04-08T22:32:47.914-04:00"
}

....
.....
.........
{
  "NOTIFICATION" : "Shutting down ORACLE instance (immediate) (OS id: 9724)",
  "URGENCY"      : "INFO",
  "INFO"         : "Shutdown is initiated by sqlplus@localhost.ontadomain (TNS V1-V3). ",
  "CAUSE"        : "A command to shutdown the instance was executed",
  "ACTION"       : "Check alert log for progress and completion of command",
  "CLASS"        : "CDB Instance / CDB ADMINISTRATOR / AL-1001",
  "TIME"         : "2021-09-16T23:11:56.812-04:00"
}

.....
......
........

{
  "ERROR"        : "PMON (ospid: 1901): terminating the instance due to ORA error 12752",
  "URGENCY"      : "IMMEDIATE",
  "INFO"         : "Additional Information Not Available",
  "CAUSE"        : "The instance termination routine was called",
  "ACTION"       : "Check alert log for more information relating to instance termination rectify the error and restart the instance",
  "CLASS"        : "CDB Instance / CDB ADMINISTRATOR / AL-1003",
  "TIME"         : "2021-09-16T23:34:26.117-02:00"
}
...
.....
......
{
  "ERROR"        : "PMON (ospid: 3408): terminating the instance due to ORA error 474",
  "URGENCY"      : "IMMEDIATE",
  "INFO"         : "Additional Information Not Available",
  "CAUSE"        : "The instance termination routine was called",
  "ACTION"       : "Check alert log for more information relating to instance termination rectify the error and restart the instance",
  "CLASS"        : "CDB Instance / CDB ADMINISTRATOR / AL-1003",
  "TIME"         : "2022-04-08T23:38:11.258-04:00"
}
Short stacks are a rich source of information which can help you to do analyzing and deconstructing a process which is part of a problem in Oracle databases, and the good part is you don’t have to rely on any OS utilities like gdb, pstack etc. to extract stacks or traces. Its pretty simple and quick to generate the short stacks, you have to pass on the OSPID of the process, and issue SHORT_STACK option for ORADEBUG, and will generate a sequence of all functions involved and their current position in a calls stack. You can also use errorstack for the same, but short_stacks are fast and point-to-point!
Now one can ask – What is a ‘call stack’ ? A call stack is a list of names of methods called at run time from the beginning of a program until the execution of the current statement. A call stack is mainly intended to keep track of the point to which each active subroutine should return control when it finishes executing. Call stack acts as a tool to debug an application when the method to be traced can be called in more than one context. This forms a better alternative than adding tracing code to all methods that call the given method.
Let me run it on a real time system where we are facing issues where due to adaptive switching between Log write methods LGWR was causing excessive ‘log file sync‘ Waits
[oracle@oracleontario ~]$ ps -ef|grep lg
oracle     4402      1  0 00:25 ?        00:00:00 ora_lgwr_dixitdb
oracle     4719   3201  0 00:25 pts/1    00:00:00 grep --color=auto lg

-- Here in the example I am generating short stacks for LGWR process
SQL>
SQL> oradebug setospid 4402
Oracle pid: 19, Unix process pid: 4402, image: oracle@oracleontario.ontadomain (LGWR)
SQL> oradebug short_stack
ksedsts()+426<-ksdxfstk()+58<-ksdxcb()+872<-sspuser()+223<-__sighandler()<-semtimedop()+10<-skgpwwait()+187
<-ksliwat()+2233<-kslwaitctx()+200<-ksarcv()+320<-ksbabs()+670<-ksbrdp()+1167<-opirip()+541<-opidrv()+581<-sou2o()+165
<-opimai_real()+173<-ssthrdmain()+417<-main()+256<-__libc_start_main()+245
SQL>
SQL>


-- After a gap of ~ 10-15 Mins
-- Let me generate the short stack once again just to see if there is any difference.
SQL> oradebug short_stack
ksedsts()+380<-ksdxfstk()+52<-ksdxcb()+3524<-sspuser()+140<-__sighndlr()+12<-call_user_handler()+992 <-sigacthandler()+104
<-_syscall6()+32<-sskgpwwait()+236<-ksliwat()+1752<-kslwait()+240<-ksarcv()+212 <-ksbabs()+764<-ksbrdp()+1616<-opirip()+1680
<-opidrv()+748<-sou2o()+88<-opimai_real()+276<-ssthrdmain()+316<-main()+316<-_start()+380
So, as you’ve seen in above code, the clear change is there in the LGWR short stacks, we did few log switches, modified a big table in the database followed by multiple commits. If you carefully look at the stack, it was function ksedsts() where it was at the time we generated the stack, and function ksdxfstk () called it, followed by ksdxcb(), sspuser() and immediate change after functions called by LGWR internal call stacks. They matched one of the known BUG which gave us a hint that we resolved after modified a undocumented parameter.
So, it can help us locating the buggy functions called by any user session or background processes and is very useful in case when you are battling with a strange looking problem in your Oracle database.
Few of the functions that I am able to recall are given below. semtimedop() is one of the function for semaphore operations also known as semop and is used to perform atomically an array of semaphore operations on the set of semaphores associated with the semaphore identifier specified by semid. ‘ksdxcb’ is a function that’s called usually when the command oradebug is being used. sighandler is the programming signal handler and is used to locate an exception. When a signal is sent to a process, various register and stack operations occur that make it look as though the leaf PC at the time of the signal is the return address for a call to a system function, sigacthandler(). sigacthandler() calls the user-specified signal handler just as any function would call another. The sigaltstack()function allows a thread to define and examine the state of an alternate stack area on which signals are processed.
opidrv() is ORACLE Program Interface DRiVer (IGNORE) opiodr is ORACLE code request driver – route the current request main() is the standard executable entry point ksedst()is the KSE dump the call stack skgmstack() is the call specified function with extra STACK space rpidrv()or the RPI is theRecursive Program Interface DRiVer pfrrun() or PSDEVN is the PL/SQL Interpreter Main Instruction Loop kkxexe()or KKX is to execute plsql
Recently we were facing one performance issue with one of the SQL which references a highly volatile table in the entire database, and one of the largest too. The tables goes through massive DMLs each minute and that has lead to huge randomness in the data distribution, and expectedly few of its critical indexes has a very high (bad) clustering factor (CF).
A quick explanation on the clustering factor, it is a measure of the ordered-ness of an index in comparison to the table that it is based on. That would be a simple explanation on Oracle’s clustering factor (CF), but if you want to read more about it I would recommend to read blog posts by Richard Foote, Jonathan Lewis and few other great articles by Randolf Geist.
Okay, coming back to the case – We tried few methods (fixed BLevel, Leaf_Blocks, degree, stats recollection etc.), but none of them helped much to stabilize performance of the query, and finally we tried something that was introduced in Oracle 12.1 the ‘Attribute Clustering‘ that helped us to resolve the problem. The attribute clustering improves physical IOs for tables and its partitions. An attribute-clustered table stores data in close proximity on disk in an ordered way based on the values of a certain set of columns in the table or a set of columns in the other tables.
Attribute clustering is a user-defined table directive that provides data clustering on one or more columns in a table. The directives can be specified when the table is created or modified. There are two types of attribute clustering:
With Linear Ordering : Linear ordering stores the data according to the order of specified columns. This is the default type of clustering.
With Interleaved Ordering : It accurately determines exactly where data is located on the disk. This enabled I/O Pruning. This uses a special multidimensional clustering technique based on Z-order curve fitting.
Note: Zone mapping is a separately licensed feature.
Let’s do some test to understand the feature better. Here in the demo I would be using linear order clustering without any zonemaps. You can try try pairing the LO clustering with zone maps too. All tests I am doing it on a 19.15.0.0.0 sandbox environment.
For testing purpose, I have created a new tables with some 2000000 random values/rows inserted into it, this is to mimic a bad clustering factor (CF) scenario. I have also created an Index on the top of a column (date) and have collected the statistics.
[oracle@oracleontario ~]$ !sql
sqlplus / as sysdba

SQL*Plus: Release 19.0.0.0.0 - Production on Wed Apr 27 00:13:08 2022
Version 19.15.0.0.0

Copyright (c) 1982, 2022, Oracle.  All rights reserved.


Connected to:
Oracle Database 19c Enterprise Edition Release 19.0.0.0.0 - Production
Version 19.15.0.0.0

SQL>
SQL> create table new_test (id number, DOB date, text varchar2(40));

Table created.

SQL> insert into new_test select rownum, sysdate-trunc(dbms_random.value(0, 20000)), 'PRASHANT DIXIT'
from dual connect by level <= 2000000;  2

2000000 rows created.

SQL>
SQL> commit;
Commit complete.

SQL> create index idx_newtest on new_test(dob);

Index created.

SQL> EXEC DBMS_STATS.gather_table_stats('DIXDROID', 'NEW_TEST', estimate_percent => null, method_opt=>'FOR ALL COLUMNS SIZE 1');

PL/SQL procedure successfully completed.


-- Here you can see the extremely bad CLUSTERING FACTOR of the Index.
SQL> SELECT t.table_name, i.index_name, t.blocks, t.num_rows, i.clustering_factor FROM user_tables t, user_indexes i
WHERE t.table_name = i.table_name AND i.index_name='IDX_NEWTEST';  2

TABLE_NAME INDEX_NAME               BLOCKS   NUM_ROWS CLUSTERING_FACTOR
---------- -------------------- ---------- ---------- -----------------
NEW_TEST   IDX_NEWTEST               10097    2000000           1989246

SQL>
With such a bad clustering factor of the Index, let me try to run a query on the same column and pass a date range and see the execution plan.
SQL> explain plan for select * from new_test where dob between '01-JUN-2017' and '30-JUN-2017';

Explained.

SQL>


SQL> SQL> select * from table(dbms_xplan.display);

PLAN_TABLE_OUTPUT
----------------------------------------------------------------------------------
Plan hash value: 1847055510

------------------------------------------------------------------------------
| Id  | Operation         | Name     | Rows  | Bytes | Cost (%CPU)| Time     |
------------------------------------------------------------------------------
|   0 | SELECT STATEMENT  |          |  3100 | 86800 |  2750   (1)| 00:00:01 |
|*  1 |  TABLE ACCESS FULL| NEW_TEST |  3100 | 86800 |  2750   (1)| 00:00:01 |
------------------------------------------------------------------------------

Predicate Information (identified by operation id):
---------------------------------------------------

   1 - filter("DOB">=TO_DATE(' 2017-06-01 00:00:00', 'syyyy-mm-dd
              hh24:mi:ss') AND "DOB"<=TO_DATE(' 2017-06-30 00:00:00', 'syyyy-mm-dd
              hh24:mi:ss'))

15 rows selected.
With a bad clustering factor, the query is going for a full table scan on NEW_TEST table, and the overall cost of the access path is very high too. Let’s alter the table using Linear attribute clustering – I won’t be using materialized zonemaps here
SQL> alter table NEW_TEST add clustering by linear order(DOB) without materialized zonemap;

Table altered.

SQL> alter table NEW_TEST move online;

Table altered.

-- Now if you check you will the improved CF of the Index.
SQL> SELECT t.table_name, i.index_name, t.blocks, t.num_rows, i.clustering_factor FROM user_tables t, user_indexes i
WHERE t.table_name = i.table_name AND i.index_name='IDX_NEWTEST';

TABLE_NAME INDEX_NAME               BLOCKS   NUM_ROWS CLUSTERING_FACTOR
---------- -------------------- ---------- ---------- -----------------
NEW_TEST   IDX_NEWTEST               10097    2000000              9277
The clustering factor of the Index was greatly improved after altering the table column (DOB) with linear order clustering enabled. Let’s try to run the same SQL and see if there is any improvements or not.
SQL> explain plan for select * from new_test where dob between '01-JUN-2017' and '30-JUN-2017';

Explained.


SQL> select * from table(dbms_xplan.display);

PLAN_TABLE_OUTPUT
------------------------------------------------------
Plan hash value: 1446839462

---------------------------------------------------------------------------------------------------
| Id  | Operation                           | Name        | Rows  | Bytes | Cost (%CPU)| Time     |
---------------------------------------------------------------------------------------------------
|   0 | SELECT STATEMENT                    |             |  3100 | 86800 |    26   (0)| 00:00:01 |
|   1 |  TABLE ACCESS BY INDEX ROWID BATCHED| NEW_TEST    |  3100 | 86800 |    26   (0)| 00:00:01 |
|*  2 |   INDEX RANGE SCAN                  | IDX_NEWTEST |  3100 |       |    11   (0)| 00:00:01 |
---------------------------------------------------------------------------------------------------

Predicate Information (identified by operation id):
---------------------------------------------------

   2 - access("DOB">=TO_DATE(' 2017-06-01 00:00:00', 'syyyy-mm-dd hh24:mi:ss') AND
              "DOB"<=TO_DATE(' 2017-06-30 00:00:00', 'syyyy-mm-dd hh24:mi:ss'))

15 rows selected.

SQL>
SQL>
And we can see the FTS was replaced with a quick INDEX RANGE SCAN on IDX_NEWTEST index (created to cover DOB column). Look at the great reduction in the cost per step and final cost of the access path and plan tree.
Recently during one of the performance taskforce on a newly migrated system, customer DBA asked me to use one of their legacy tool to get more idea about database’s performance, that one of their expert DBA written to collect performance metrics. I’d seen their previous reports collected through the same tool for other systems, and it was good. But, got a runtime exception with an error while calling the script/tool which says ‘PLAN_TABLE physical table present in user schema SYS‘. The error means the user executing it (SYS) owns the table PLAN_TABLE that is the not the Oracle seeded GTT (Global Temporary Table) plan table owned by SYS (PLAN_TABLE$ table with a PUBLIC synonym PLAN_TABLE).
This was little odd to the customer DBAs as they had never experienced this error with the tool, and now when its there, question was Shall we drop the PLAN_TABLE ? Is it risky to do that ? If we drop it, will it impact the execution plan generation or not ? Any other associated risk with drop of plan_table ?
Next when I’d queried DBA_OBJECTS, I saw the table is there in SYS schema, though this system was migrated from 12.2 to 19c, but the table should not be there as the table only by default existed in older versions of Oracle. The object creation date was coming for the time when database was upgraded. It had appeared that someone after upgrade/migration, called the utlrp.sql explicitly (maybe any old 8i/9i DBA) and that’d created the table. Now the question is – It’s safe to dropthis table ?
SQL> select owner, object_name, object_type, created from dba_objects where object_name like '%PLAN_TABLE%'
and owner not in ('SQLTXPLAIN','SQLTXADMIN') ORDER BY 1;

OWNER      OBJECT_NAME          OBJECT_TYPE             CREATED
---------- -------------------- ----------------------- ---------
PUBLIC     PLAN_TABLE           SYNONYM                 17-APR-19
PUBLIC     SQL_PLAN_TABLE_TYPE  SYNONYM                 17-APR-19
PUBLIC     PLAN_TABLE_OBJECT    SYNONYM                 17-APR-19
SYS        SQL_PLAN_TABLE_TYPE  TYPE                    17-APR-19
SYS        PLAN_TABLE           TABLE                   13-MAR-22     ----->>>>> OLD PLAN_TABLE created during the UPGRADE
SYS        SQL_PLAN_TABLE_TYPE  TYPE                    17-APR-19
SYS        PLAN_TABLE_OBJECT    TYPE                    17-APR-19
SYS        PLAN_TABLE$          TABLE                   17-APR-19
SYS        PLAN_TABLE_OBJECT    TYPE BODY               17-APR-19

9 rows selected.


-- Look at the difference between the two, PLAN_TABLE$ is a GLOBAL TEMP TABLE and old PLAN_TABLE is not.
SQL> SELECT TABLE_NAME, owner, temporary from dba_tables where table_name like '%PLAN_TABLE%'
AND owner not in ('SQLTXPLAIN','SQLTXADMIN') ORDER BY 1;

TABLE_NAME                     OWNER                T
------------------------------ -------------------- -
PLAN_TABLE                     SYS                  N
PLAN_TABLE$                    SYS                  Y     ---> Y represents GTT
Let’s first see what’s there inside the PLAN_TABLE and what’s its purpose. Will generate few SQL execution plans will observe changes that happens in PLAN_TABLE.
-- Table columns and details
SQL> desc plan_table
 Name                                      Null?    Type
 ----------------------------------------- -------- ----------------------------
 STATEMENT_ID                                       VARCHAR2(30)
 PLAN_ID                                            NUMBER
 TIMESTAMP                                          DATE
 REMARKS                                            VARCHAR2(4000)
 OPERATION                                          VARCHAR2(30)
 OPTIONS                                            VARCHAR2(255)
 OBJECT_NODE                                        VARCHAR2(128)
 OBJECT_OWNER                                       VARCHAR2(128)
 OBJECT_NAME                                        VARCHAR2(128)
 OBJECT_ALIAS                                       VARCHAR2(261)
 OBJECT_INSTANCE                                    NUMBER(38)
 OBJECT_TYPE                                        VARCHAR2(30)
 OPTIMIZER                                          VARCHAR2(255)
 SEARCH_COLUMNS                                     NUMBER
 ID                                                 NUMBER(38)
 PARENT_ID                                          NUMBER(38)
 DEPTH                                              NUMBER(38)
 POSITION                                           NUMBER(38)
 COST                                               NUMBER(38)
 CARDINALITY                                        NUMBER(38)
 BYTES                                              NUMBER(38)
 OTHER_TAG                                          VARCHAR2(255)
 PARTITION_START                                    VARCHAR2(255)
 PARTITION_STOP                                     VARCHAR2(255)
 PARTITION_ID                                       NUMBER(38)
 OTHER                                              LONG
 DISTRIBUTION                                       VARCHAR2(30)
 CPU_COST                                           NUMBER(38)
 IO_COST                                            NUMBER(38)
 TEMP_SPACE                                         NUMBER(38)
 ACCESS_PREDICATES                                  VARCHAR2(4000)
 FILTER_PREDICATES                                  VARCHAR2(4000)
 PROJECTION                                         VARCHAR2(4000)
 TIME                                               NUMBER(38)
 QBLOCK_NAME                                        VARCHAR2(128)
 OTHER_XML                                          CLOB


-- Let me check other stats or details about the PLAN_TABLE
SQL> select index_name, table_name from dba_indexes where table_name='PLAN_TABLE'
 And owner not in ('SQLTXPLAIN','SQLTXADMIN') ORDER BY 1;

INDEX_NAME                                         TABLE_NAME
-------------------------------------------------- ------------------------------
SYS_IL0000078251C00036$$                           PLAN_TABLE


SQL> select table_name, owner, TABLESPACE_NAME from dba_tables where table_name like '%PLAN_TABLE%'
and owner not in ('SQLTXPLAIN','SQLTXADMIN') ORDER BY 1;

TABLE_NAME                     OWNER                          TABLESPACE_NAME
------------------------------ ------------------------------ ------------------------------
PLAN_TABLE                     SYS                            SYSTEM
PLAN_TABLE$                    SYS


SQL>

-- The OLD PLAN_TABLE is empty at the moment
SQL> select count(*) from plan_table;

  COUNT(*)
----------
         0


-- Lets explain a test SQL to see what happens to the OLD PLAN_TABLE
SQL> explain plan for select count(*) from bigtab;

Explained.

-- And immediately 3 rows related to the plan line ids added to it
SQL> select count(*) from plan_table;

  COUNT(*)
----------
         3


-- Three entries for below 3 IDs.
SQL> select * FROM TABLE(DBMS_XPLAN.DISPLAY);

PLAN_TABLE_OUTPUT
--------------------------------------------------------------------------------
Plan hash value: 2140185107

---------------------------------------------------------------------
| Id  | Operation          | Name   | Rows  | Cost (%CPU)| Time     |
---------------------------------------------------------------------
|   0 | SELECT STATEMENT   |        |     1 |    69   (0)| 00:00:01 |
|   1 |  SORT AGGREGATE    |        |     1 |            |          |
|   2 |   TABLE ACCESS FULL| BIGTAB | 72358 |    69   (0)| 00:00:01 |
---------------------------------------------------------------------

9 rows selected.


-- But the new PLAN_TABLE$ is still empty

SQL> select count(*) from PLAN_TABLE$ ;

  COUNT(*)
----------
         0
So, the question is – Is it safe to drop this table PLAN_TABLE ?
SQL> drop table PLAN_TABLE;

Table dropped.

SQL>

-- And the table is gone
SQL> select owner, object_name, object_type, created from dba_objects where object_name like '%PLAN_TABLE%'
and owner not in ('SQLTXPLAIN','SQLTXADMIN') ORDER BY 1;

OWNER                          OBJECT_NAME          OBJECT_TYPE             CREATED
------------------------------ -------------------- ----------------------- ---------
PUBLIC                         PLAN_TABLE           SYNONYM                 17-APR-19
PUBLIC                         SQL_PLAN_TABLE_TYPE  SYNONYM                 17-APR-19
PUBLIC                         PLAN_TABLE_OBJECT    SYNONYM                 17-APR-19
SYS                            PLAN_TABLE_OBJECT    TYPE BODY               17-APR-19
SYS                            SQL_PLAN_TABLE_TYPE  TYPE                    17-APR-19
SYS                            PLAN_TABLE_OBJECT    TYPE                    17-APR-19
SYS                            PLAN_TABLE$          TABLE                   17-APR-19
SYS                            SQL_PLAN_TABLE_TYPE  TYPE                    17-APR-19

8 rows selected.
Now when the table is gone, lets check if we are still able to generate the execution plan.
SQL>
SQL> explain plan for select count(*) from bigtab;

Explained.

SQL> select * FROM TABLE(DBMS_XPLAN.DISPLAY);

PLAN_TABLE_OUTPUT
----------------------------------------------------------------------------------------------------------------------------------------------------------------------------------------------------------------------------------------------------------------------------------------------------------------------------------------------------------------------------------------------------------------
Plan hash value: 2140185107

---------------------------------------------------------------------
| Id  | Operation          | Name   | Rows  | Cost (%CPU)| Time     |
---------------------------------------------------------------------
|   0 | SELECT STATEMENT   |        |     1 |    69   (0)| 00:00:01 |
|   1 |  SORT AGGREGATE    |        |     1 |            |          |
|   2 |   TABLE ACCESS FULL| BIGTAB | 72358 |    69   (0)| 00:00:01 |
---------------------------------------------------------------------

9 rows selected.


SQL> select count(*) from plan_table$;

  COUNT(*)
----------
         3
And yes, no issues at all. The plan now started to sit inside PLAN_TABLE$ that has a PUBLIC SYNONYM called PLAN_TABLE. So, it’s totally safe to drop the PLAN_TABLE from your schema if it still exists and Oracle has now a public synonym for the same purpose. WARNING: Don’t drop the PLAN_TABLE$ nor the PLAN_TABLE public synonym, these need to exist for the new PLAN_TABLE to work properly.
Last week we faced an interesting issue with one of the production system which was recently migrated from Oracle 12.2. to 19.15. The setup was running on a VMWare machine with limited resources. It all started when the application team started reporting slowness in their daily scheduled jobs and other ad-hoc operations, when checked at the database layer, it was all ‘enq: CR – block range reuse ckpt‘ wait event. Same can be seen in the below ORATOP output, where the BLOCKER ID 3817 is the CKPT or the checkpoint process.
The strange part was, the blocker was CKPT process and it was all for a particular SQL ID (an INSERT operation), see below in next oratop screen fix.
As far as this wait event (other classed), This comes just before you delete or truncate a table, where we need a level segment checkpoint. This is because it must maintain the consistency of the blocks there may be in the buffer memory and what’s on the disc. As per the definition, this wait event happens due to contention on blocks caused by multiple processes trying to update same blocks. This may seem issues from the application logic resulting into this concurrency bottleneck, but interestingly this was happening on a simple INSERT operation, not a DELETE or TRUNCATE.
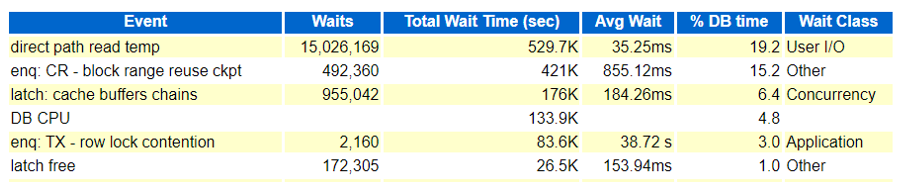
Same can be seen in the AWR and ASH reports too! There are CBC (Cache Buffer Chains) latching and latch free events too along with ‘enq: CR – block range reuse ckpt‘, but the initial focus was to understand the event and its reasons. As far as ‘direct path read temp‘ it was happening due to couple of SELECT statement which we resolved after attaching a better plan with the SQLs.
Wait event source (from ASH)
SQL Text was quite simple, an INSERT INTO statement.
I’ve tried first with the CKPT process traces, just to see if there is anything interesting or useful caught within the process logs or traces. The trace was short and has only got some strange and obscure looking content, but which at least gave us an idea that the reuse block checkpoint of the RBR was failed due to enqueue, and its entry was failed due to abandoned parent. Still, that doesn’t helped us anything, we were unsure about the reason.
--> Info in CKPT trace file ---> XXXXX_ckpt_110528.trc.
RBR_CKPT: adding rbr ckpt failed for 65601 due to enqueue
RBR_CKPT: rbr mark the enqueue for 65601 as failed
RBR_CKPT: adding ckpt entry failed due to abandoned parent 0x1b57b4a88
RBR_CKPT: rbr mark the enqueue for 65601 as failed
There were few things logged in the alert.log, multiple deadlocks (ORA 0060), too many parse errors for one SELECT statement and some checkpoint incomplete errors (log switching was high >35)
-- deadlocks in alert log.
Errors in file /opt/u01/app/oracle/diag/rdbms/xxxxxx/xxxx/trace/xxxx_ora_73010.trc:
2022-04-19T13:41:22.489551+05:30 ◄◄◄◄◄◄◄◄◄◄◄◄◄◄◄◄◄◄◄◄◄
ORA-00060: Deadlock detected. See Note 60.1 at My Oracle Support for Troubleshooting ORA-60 Errors. More info in file /opt/u01/app/oracle/diag/rdbms/pwfmfsm/PWFMFSM/trace/PWFMFSM_ora_73010.trc.

-- From systemstatedumps
[Transaction Deadlock]
The following deadlock is not an ORACLE error. It is a ◄◄◄◄◄◄◄◄◄◄◄◄◄◄◄◄◄◄◄◄◄
deadlock due to user error in the design of an application
or from issuing incorrect ad-hoc SQL. The following
information may aid in determining the deadlock:

Deadlock graph:
------------Blocker(s)----------- ------------Waiter(s)------------
Resource Name process session holds waits serial process session holds waits serial
TX-03AC0014-0000B33A-00000000-00000000 1562 691 X 1632 946 5441 X 56143
TX-01460020-0001A5C2-00000000-00000000 946 5441 X 56143 1562 691 X 1632


-- too many parse errors
2022-04-19T13:57:26.261176+05:30
WARNING: too many parse errors, count=2965 SQL hash=0x8ce1e2ff ◄◄◄◄◄◄◄◄◄◄◄◄◄◄◄◄◄◄◄◄◄
PARSE ERROR: ospid=68036, error=942 for statement:
2022-04-19T13:57:26.272805+05:30
SELECT * FROM ( SELECT xxxxxxxxxxxxxxxxxxxxxx FROM xxxxxxxxxxxxxxxxxxxxxx AND xxxxxxxxxxxxxxxxxxxxxx ORDER BY xxxxxxxxxxxxxxxxxxxxxx ASC ) WHERE ROWNUM <= 750
Additional information: hd=0x546ba1be8 phd=0x61edab798 flg=0x20 cisid=113 sid=113 ciuid=113 uid=113 sqlid=ccmkzhy6f3srz
...Current username=xxxxxxxxxxxxxxxxxxxxxx
...Application: xxxxxxxxxxxxxxxxxxxxxx.exe Action:


-- Checkpoint incomplete
2022-04-19T15:03:16.964470+05:30 ◄◄◄◄◄◄◄◄◄◄◄◄◄◄◄◄◄◄◄◄◄
Thread 1 cannot allocate new log, sequence 186456
Checkpoint not complete
Current log# 11 seq# 186455 mem# 0: +ONLINE_REDO/xxxxxxxxxxxxxxxxxxxxxx/ONLINELOG/group_11.256.1087565999
2022-04-19T15:03:17.785113+05:30
But the alert log was not sufficient to give us any concrete evidences or reasons for CKPT bloking user sessions. So, next we decided to generate the HANGANALYZE and SYSTEMSTATEDUMPs to understand what’s all happening under the hood, through its wait chains. We noticed few interesting things there
Wait chain 1 where a session was waiting on ‘buffer busy waits‘ while doing the “bitmapped file space header” which talks about the space management blocks (nothing to with bitmap indexes) and was related with one SELECT statement.
Wait chain 2 where a session was found waiting on ‘enq: CR – block range reuse ckpt‘ event and was blocked by CKPT process (3817) which was further waiting on ‘control file sequential read‘
Wait chain 4 where SID 1670, was found waiting on ‘buffer busy waits‘ while doing ‘bitmapped file space header’ operations.
Chain 1:
-------------------------------------------------------------------------------
Oracle session identified by:
{
instance: 1 (kpkpkpkpk.kpkpkpkpk)
os id: 46794
process id: 2014, oracle@monkeymachine.prod.fdt.swedish.se
session id: 15
session serial #: 19322
module name: 0 (xxxx.exe)
}
is waiting for 'buffer busy waits' with wait info:
{
p1: 'file#'=0xca
p2: 'block#'=0x2
p3: 'class#'=0xd ◄◄◄◄◄◄◄◄◄◄◄◄◄◄◄◄◄◄◄◄◄ bitmapped file space header
time in wait: 2 min 20 sec
timeout after: never
wait id: 10224
blocking: 0 sessions
current sql_id: 1835193535
current sql: SELECT * FROM ( SELECT xxxxx FROM task JOIN request ON xxxxx = xxxxx JOIN xxxxx ON xxxxx = xxxxx JOIN c_task_assignment_view ON xxxxx = xxxxx
.
.
.
and is blocked by
=> Oracle session identified by:
{
instance: 1 (kpkpkpkpk.kpkpkpkpk)
os id: 23090
process id: 3231, oracle@monkeymachine.prod.fdt.swedish.se
session id: 261
session serial #: 39729
module name: 0 (xxxx.exe)
}
which is waiting for 'buffer busy waits' with wait info:
{
p1: 'file#'=0xca
p2: 'block#'=0x2
p3: 'class#'=0xd ◄◄◄◄◄◄◄◄◄◄◄◄◄◄◄◄◄◄◄◄◄  bitmapped file space header
time in wait: 18.999227 sec ◄◄◄
timeout after: never
wait id: 47356
blocking: 25 sessions ◄◄◄
current sql_id: 0
current sql: <none>
short stack: ksedsts()+426<-ksdxfstk()+58<-ksdxcb()+872<-sspuser()+223<-__sighandler()<-read()+14<-snttread()+16<-nttfprd()+354<-nsbasic_brc()+399<-nioqrc()+438<-opikndf2()+999<-opitsk()+910<-opiino()+936<-opiodr()+1202<-opidrv()+1094<-sou2o()+165<-opimai_real()+422<-ssthrdmain()+417<-main()+256<-__libc_start_main()+245
wait history:
* time between current wait and wait #1: 0.000084 sec
1. event: 'SQL*Net message from client'
time waited: 0.008136 sec
wait id: 47355 p1: 'driver id'=0x28444553
p2: '#bytes'=0x1
* time between wait #1 and #2: 0.000043 sec
2. event: 'SQL*Net message to client'
time waited: 0.000002 sec
wait id: 47354 p1: 'driver id'=0x28444553
p2: '#bytes'=0x1
* time between wait #2 and #3: 0.000093 sec
3. event: 'SQL*Net message from client'
time waited: 2.281674 sec
wait id: 47353 p1: 'driver id'=0x28444553
p2: '#bytes'=0x1
}
and may or may not be blocked by another session.
.
.
.
Chain 2:
-------------------------------------------------------------------------------
Oracle session identified by:
{
instance: 1 (kpkpkpkpk.kpkpkpkpk)
os id: 10122
process id: 2850, oracle@monkeymachine.prod.fdt.swedish.se
session id: 97
session serial #: 47697
module name: 0 (xxxx.exe)
}
is waiting for 'enq: CR - block range reuse ckpt' with wait info: ◄◄◄◄◄◄◄◄◄◄◄◄◄◄◄◄◄◄◄◄◄
{
p1: 'name|mode'=0x43520006
p2: '2'=0x10b22
p3: '0'=0x1
time in wait: 2.018004 sec
timeout after: never
wait id: 81594
blocking: 0 sessions
current sql_id: 1335044282
current sql: <none>
.
.
.
and is blocked by
=> Oracle session identified by:
{
instance: 1 (kpkpkpkpk.kpkpkpkpk)
os id: 110528
process id: 24, oracle@monkeymachine.prod.fdt.swedish.se
session id: 3817 ◄◄◄◄◄◄◄◄◄◄◄◄◄◄◄◄◄◄◄◄◄  CKPT background process
session serial #: 46215
}
which is waiting for 'control file sequential read' with wait info: ◄◄◄◄◄◄◄◄◄◄◄◄◄◄◄◄◄◄◄◄◄
{
p1: 'file#'=0x0
p2: 'block#'=0x11e
p3: 'blocks'=0x1
px1: 'disk number'=0x4
px2: 'au'=0x34
px3: 'offset'=0x98000
time in wait: 0.273981 sec
timeout after: never
wait id: 17482450
blocking: 45 sessions ◄◄◄◄◄◄◄◄◄◄◄◄◄◄◄◄◄◄◄◄◄
current sql_id: 0
current sql: <none>
short stack: ksedsts()+426<-ksdxfstk()+58<-ksdxcb()+872<-sspuser()+223<-__sighandler()<-semtimedop()+10<-skgpwwait()+192<-ksliwat()+2199<-kslwaitctx()+205<-ksarcv()+320<-ksbabs()+602<-ksbrdp()+1167<-opirip()+541<-opidrv()+581<-sou2o()+165<-opimai_real()+173<-ssthrdmain()+417<-main()+256<-__libc_start_main()+245
wait history:
* time between current wait and wait #1: 0.000012 sec
1. event: 'control file sequential read'
time waited: 0.005831 sec
wait id: 17482449 p1: 'file#'=0x0
p2: 'block#'=0x11
p3: 'blocks'=0x1
* time between wait #1 and #2: 0.000012 sec
2. event: 'control file sequential read'
time waited: 0.011667 sec
wait id: 17482448 p1: 'file#'=0x0
p2: 'block#'=0xf
p3: 'blocks'=0x1
* time between wait #2 and #3: 0.000017 sec
3. event: 'control file sequential read'
time waited: 0.009160 sec
wait id: 17482447 p1: 'file#'=0x0
p2: 'block#'=0x1
p3: 'blocks'=0x1
}
.
.
.
Chain 4:
-------------------------------------------------------------------------------
Oracle session identified by:
{
instance: 1 (kpkpkpkpk.kpkpkpkpk)
os id: 46479
process id: 1036, oracle@monkeymachine.prod.fdt.swedish.se
session id: 1670
session serial #: 6238
module name: 0 (xxxx.exe)
}
is waiting for 'buffer busy waits' with wait info:
{
p1: 'file#'=0xca
p2: 'block#'=0x2
p3: 'class#'=0xd ◄◄◄◄◄◄◄◄◄◄◄◄◄◄◄◄◄◄◄◄◄  bitmapped file space header
time in wait: 18.954206 sec ◄◄◄◄◄◄◄◄◄◄◄◄◄◄◄◄◄◄◄◄◄
timeout after: never
wait id: 20681
blocking: 0 sessions
current sql_id: 343919375
current sql: SELECT * FROM ( SELECT xxxxx FROM task JOIN request ON xxxxx = xxxxx JOIN xxxxx ON xxxxx = xxxxx JOIN c_task_assignment_view ON xxxxx = xxxxx
.
.
.
and is blocked by
=> Oracle session identified by:
{
instance: 1 (kpkpkpkpk.kpkpkpkpk)
os id: 44958
process id: 523, oracle@monkeymachine.prod.fdt.swedish.se
session id: 4681
session serial #: 41996
module name: 0 (xxxx.exemonkeymachine.prod.fdt.swedish.se (TNS)
}
which is waiting for 'buffer busy waits' with wait info: ◄◄◄◄◄◄◄◄◄◄◄◄◄◄◄◄◄◄◄◄◄
{
p1: 'file#'=0xca
p2: 'block#'=0x2
p3: 'class#'=0xd ◄◄◄◄◄◄◄◄◄◄◄◄◄◄◄◄◄◄◄◄◄ bitmapped file space header
time in wait: 18.959429 sec ◄◄◄◄◄◄◄◄◄◄◄◄◄◄◄◄◄◄◄◄◄
timeout after: never
wait id: 153995
blocking: 101 sessions ◄◄◄◄◄◄◄◄◄◄◄◄◄◄◄◄◄◄◄◄◄
current sql_id: 343919375
current sql:  INSERT INTO xx_xxx_xx(xxxxxxxxxxxxxxxxxxxxxxxxxxxxxxxxxxxxxxxxx, xxxxxxxxxxxxxxxxxxxxxxxxxxxxxxxxxxxxxxxxx, xxxxxxxxxxxxxxxxxxxxxxxxxxxxxxxxxxxxxxxxx, xxxxxxxxxxxxxxxxxxxxxxxxxxxxxxxxxxxxxxxxx, xxxxxxxxxxxxxxxxxxxxxxxxxxxxxxxxxxxxxxxxx) VALUES (xxxxxxxxxxxxxxxxxxxxxxxxxxxxxxxxxxxxxxxxx, xxxxxxxxxxxxxxxxxxxxxxxxxxxxxxxxxxxxxxxxx, xxxxxxxxxxxxxxxxxxxxxxxxxxxxxxxxxxxxxxxxx, xxxxxxxxxxxxxxxxxxxxxxxxxxxxxxxxxxxxxxxxx, xxxxxxxxxxxxxxxxxxxxxxxxxxxxxxxxxxxxxxxxx)
short stack: ksedsts()+426<-ksdxfstk()+58<-ksdxcb()+872<-sspuser()+223<-__sighandler()<-semtimedop()+10<-skgpwwait()+192<-ksliwat()+2199<-kslwaitctx()+205<-ksqcmi()+21656<-ksqcnv()+809<-ksqcov()+95<-kcbrbr_int()+2476<-kcbrbr()+47<-ktslagsp()+2672<-ktslagsp_main()+945<-kdliAllocCache()+37452<-kdliAllocBlocks()+1342<-kdliAllocChunks()+471<-kdliWriteInit()+1249<-kdliWriteV()+967<-kdli_fwritev()+904<-kdlxNXWrite()+577<-kdlx_write()+754<-kdlxdup_write1()+726<-kdlwWriteCallbackOld_pga()+1982<-kdlw_write()+1321<-kdld_write()+410<-kdl
wait history:
* time between current wait and wait #1: 0.756195 sec
1. event: 'direct path write temp'
time waited: 0.406543 sec
wait id: 153994 p1: 'file number'=0xc9
p2: 'first dba'=0xb28fc
p3: 'block cnt'=0x4
* time between wait #1 and #2: 0.000001 sec
2. event: 'ASM IO for non-blocking poll'
time waited: 0.000000 sec
wait id: 153993 p1: 'count'=0x4
p2: 'where'=0x2
p3: 'timeout'=0x0
* time between wait #2 and #3: 0.000002 sec
3. event: 'ASM IO for non-blocking poll'
time waited: 0.000001 sec
wait id: 153992 p1: 'count'=0x4
p2: 'where'=0x2
p3: 'timeout'=0x0
}
and may or may not be blocked by another session.
.
.
Though, we wanted to try couple of hidden parameters to enable fast object level truncation and checkpointing, as they had helped us a lot in the past in similar scenarios, but had to involve Oracle support and after carefully analyzing the situation, they too agreed and want us to try them as they started suspecting it as an aftermath of a known bug of 19c.
[oracle@oracleontario ~]$ !sql
sqlplus / as sysdba
SQL*Plus: Release 19.0.0.0.0 - Production on Sun Apr 24 00:24:47 2022
Version 19.15.0.0.0
Copyright (c) 1982, 2022, Oracle. All rights reserved.
Connected to:
Oracle Database 19c Enterprise Edition Release 19.0.0.0.0 - Production
Version 19.15.0.0.0
SQL>
SQL> @hidden
Enter value for param: db_fast_obj_truncate
old 5: and a.ksppinm like '%¶m%'
new 5: and a.ksppinm like '%db_fast_obj_truncate%'
Parameter Session Value Instance Value descr
--------------------------------------------- ------------------------- ------------------------- ------------------------------------------------------------
_db_fast_obj_truncate TRUE TRUE enable fast object truncate
_db_fast_obj_ckpt TRUE TRUE enable fast object checkpoint
SQL> ALTER SYSTEM SET "_db_fast_obj_truncate" = false sid = '*';
System altered.
SQL>
SQL> ALTER SYSTEM SET "_db_fast_obj_ckpt" = false sid = '*';
System altered.
SQL>
And soon after setting them, we saw a drastic drop in the waits and system seemed better, much better. But it all happened during an off-peak hour, so there wasn’t much of a workload to see anything odd.
And as we suspected, the issue repeated itself, and next day during peak business hours we started seeing the same issue, same set of events back into existence. This time the ‘latch: cache buffers chains‘ was quite high and prominent which was not that much earlier.
Initially we tried to fix some of the expensive statements on ‘logical IOs’ or memory reads, but that hardly helped. The issue persisted even after setting a higher value for db_block_hash_latches and decreasing cursor_db_buffers_pinned. AWR continues to show ‘latch: cache buffers chains’ in the top ten, foreground timed events, and ‘latch free‘ in first place in the background timed events. Oracle support confirmed the behavior was due to published bug 33025005 where excessive Latch CBC waits were seen after upgrading from 12c to 19c, and suggested to apply patch 33025005 and then to set hidden parameter “_post_multiple_shared_waiters” to value FALSE (in MEMORY only to test) which disables multiple shared waiters in the database.
-- After applying patch 33025005

SQL> ALTER SYSTEM SET "_post_multiple_shared_waiters" = FALSE SCOPE = MEMORY;

System altered.
And even after applying the patch and setting the recommended undocumented parameter, the issue persisted and we were totally clueless.
And as a last resort, we tried to flush the buffer cache of the database, and bingo that crude method of purging the cache helped to drastically to reduce the load on ‘CBC Latching‘ and for ‘enq: cr block range reuse ckpt‘, and the system ran fine soon after the flush of the DB Buffer cache.
So, nothing worked for us, we changed multiple checkpointing and shared writers related parameters in the database, applied a bug fix patch (33025005), but of no use. Finally, the flush of buffer cache worked for us! Oracle support agreed that this was happening due to a new/unpublished bug (33125873 or 31844316) which is not yet fixed in 19.15 and will be included in 23.1, and they are in status 11 that means still being worked by Development so there is no fix for it yet.
Today’s post is about one of the good featured added into Oracle 19c for DBMS_XPLAN package that provides an easy way to display the output of the EXPLAIN PLAN using a new function called COMPARE_PLANS. This function compares each plan in the list to a reference plan and returns a report and makes life of a DBA little easy.
The following example illustrates the usage of the COMPARE_PLANS function in 19c.
-- Lets create a sample table
SQL> CREATE TABLE bigtab (
   id         NUMBER,
   weight     NUMBER,
   adate      DATE
);

Table created.

-- Insert some dummy rows into it
SQL> INSERT INTO bigtab (id, weight, adate)
SELECT MOD(ROWNUM,1000),
       DBMS_RANDOM.RANDOM,
       SYSDATE-1000+DBMS_RANDOM.VALUE(0,1000)
 FROM all_objects
/

84217 rows created.

SQL>


-- Lets query the table with our conditions
SQL> select count(*) from bigtab where ID between 280 and 500;

  COUNT(*)
----------
     18564

SQL>
SQL> select count(*) from bigtab where ID not between 280 and 500;

  COUNT(*)
----------
     65653


-- All set lets get the SQLID for both of the SQLs that we ran
SQL> set linesize 400 pagesize 400
SQL> select sql_id, sql_text from v$sqlarea where sql_text like '%from bigtab where ID%';

SQL>

SQL_ID        SQL_TEXT
------------- --------------------------------------------------------------------------------
3k1b0y7scc8bd select count(*) from bigtab where ID not between :"SYS_B_0" and :"SYS_B_1"
51tfy4wqb5sg3 select count(*) from bigtab where ID between :"SYS_B_0" and :"SYS_B_1"
Now we have SQLIDs for both of the SQLs I ran in last session, let’s call DBMS_XPLAN.COMPARE_PLANS and compare both of the plans and see how the compare reports looks like and what all information it presents. There are multiple parameters available with the reference_plan and compare_plan_list, but to keep it simple I will be using only cursor_cache_object (to get all plans in the cursor cache generated for SQL ID) and plan_object_list(cursor_cache_object) which is a TYPE
Other available plan sources are: plan_table_object(owner, plan_table_name, statement_id, plan_id) : for schedules cursor_cache_object(sql_id, child_number) : For cursor cache awr_object(sql_id, dbid, con_dbid, plan_hash_value) : for Hours or if you want to check for two different PHVs sqlset_object (sqlset_owner, sqlset_name, sql_id, plan_hash_value) : for SQL Tuning Set spm_object (sql_handle, plan_name) : For SQL Plan management sql_profile_object (profile_name) : For SQL configuration file
Let’s go simple and will use cursor_cache_object with plan_object_list to get a simple plain execution plan compare report.
SQL>
SQL> VARIABLE v_rep CLOB
SQL>
SQL> BEGIN
:v_rep := DBMS_XPLAN.COMPARE_PLANS(
reference_plan => cursor_cache_object('3k1b0y7scc8bd', NULL),
compare_plan_list => plan_object_list(cursor_cache_object('51tfy4wqb5sg3', NULL)),
type => 'TEXT',
level => 'TYPICAL',
section => 'ALL');
END;
/

PL/SQL procedure successfully completed.

SQL>


-- Now lets call the variable to see contents inside, the compare report.
SQL> set long 100000
SQL> COLUMN report FORMAT a200
SQL>
SQL> SELECT :v_rep REPORT FROM DUAL;

REPORT
--------------------------------------------------------------------------------------------------------------------------------------------------------------------------------------------------------

COMPARE PLANS REPORT
---------------------------------------------------------------------------------------------
  Current user           : SYS
  Total number of plans  : 2
  Number of findings     : 2
---------------------------------------------------------------------------------------------

COMPARISON DETAILS
---------------------------------------------------------------------------------------------
 Plan Number            : 1 (Reference Plan)
 Plan Found             : Yes
 Plan Source            : Cursor Cache
 SQL ID                 : 3k1b0y7scc8bd
 Child Number           : 0
 Plan Database Version  : 19.0.0.0
 Parsing Schema         : "SYS"
 SQL Text               : select count(*) from bigtab where ID not between
                        :"SYS_B_0" and :"SYS_B_1"

Plan
-----------------------------

 Plan Hash Value  : 2140185107

--------------------------------------------------------------------------
| Id  | Operation            | Name   | Rows  | Bytes  | Cost | Time     |
--------------------------------------------------------------------------
|   0 | SELECT STATEMENT     |        |       |        |   82 |          |
|   1 |   SORT AGGREGATE     |        |     1 |     13 |      |          |
| * 2 |    TABLE ACCESS FULL | BIGTAB | 54028 | 702364 |   82 | 00:00:01 |
--------------------------------------------------------------------------

Predicate Information (identified by operation id):
------------------------------------------
* 2 - filter(("ID"<:SYS_B_0 OR "ID">:SYS_B_1))


Notes
-----
- Dynamic sampling used for this statement ( level = 2 )


---------------------------------------------------------------------------------------------
 Plan Number            : 2
 Plan Found             : Yes
 Plan Source            : Cursor Cache
 SQL ID                 : 51tfy4wqb5sg3
 Child Number           : 0
 Plan Database Version  : 19.0.0.0
 Parsing Schema         : "SYS"
 SQL Text               : select count(*) from bigtab where ID between
                        :"SYS_B_0" and :"SYS_B_1"

Plan
-----------------------------

 Plan Hash Value  : 3865534252

---------------------------------------------------------------------------
| Id  | Operation             | Name   | Rows  | Bytes  | Cost | Time     |
---------------------------------------------------------------------------
|   0 | SELECT STATEMENT      |        |       |        |   79 |          |
|   1 |   SORT AGGREGATE      |        |     1 |     13 |      |          |
| * 2 |    FILTER             |        |       |        |      |          |
| * 3 |     TABLE ACCESS FULL | BIGTAB | 17969 | 233597 |   79 | 00:00:01 |
---------------------------------------------------------------------------

Predicate Information (identified by operation id):
------------------------------------------
* 2 - filter(:SYS_B_1>=:SYS_B_0)
* 3 - filter(("ID">=:SYS_B_0 AND "ID"<=:SYS_B_1))


Notes
-----
- Dynamic sampling used for this statement ( level = 2 )


Comparison Results (2):
-----------------------------
 1. Query block SEL$1, Alias "BIGTAB"@"SEL$1": Some lines (id: 2) in the
    current plan are missing in the reference plan.
 2. Query block SEL$1, Alias "BIGTAB"@"SEL$1": Some columns (ID, PARENT_ID,
    DEPTH) do not match between the reference plan (id: 2) and the current plan
    (id: 3).


---------------------------------------------------------------------------------------------


SQL>
SQL>
This is great feature when the execution plans are messy and behemoth and just a glance is not enough and you want to compare two such execution plans. This will present a ‘comparison result’ at the end of the report like in our example the report says the Query Block with name SEL$1 which is an alias of BIGTAB in the current plan doesn’t have the line ID 2 (FILTER method in our case) and similar other observations.
Recently while looking into a system (was running on 19.3.0.0.0 standalone) where ‘log file sync’ was bugging the database, and after we tried all other possible solutions, we thought to increase the priroty of the LGWR background process to see if that helps.
Increasing the LGWR priority is putting the LGWR process in the Round-Robin (SCHED_RR) class. You can increase process’s priority both using OS (renice, nice commands) or Database methods, but this post is about setting the priority using ‘_high_priority_process’ an undocumented/hidden parameter that prioritizes your database managed processes.
I am using Oracle 19.3 for the test where the LGWR is not by default comes with any priority in the DB, starting from 21.3.0.0.0 LGWR process is part of _high_priority_processes group along with VKTM & LMS* processes. Note: This being a hidden/undocumented parameter I advise to consult with Oracle support before going and changing the parameter value. Try other possible ways to reduce log file sync, before jumping into this crude method of prioritizing LGWR over others.
[oracle@oracleontario ~]$ !sql
sqlplus / as sysdba
SQL*Plus: Release 19.0.0.0.0 - Production on Sun Apr 10 03:36:06 2022
Version 19.3.0.0.0
Copyright (c) 1982, 2019, Oracle. All rights reserved.
Connected to:
Oracle Database 19c Enterprise Edition Release 19.0.0.0.0 - Production
Version 19.3.0.0.0
SQL> @hidden
Enter value for param: high_prio
old 5: and a.ksppinm like '%¶m%'
new 5: and a.ksppinm like '%priority_processes%'
Parameter Session Value Instance Value descr
--------------------------------------------- ------------------------- ------------------------- ------------------------------------------------------------
_highest_priority_processes VKTM VKTM Highest Priority Process Name Mask
_high_priority_processes LMS*|VKTM LMS*|VKTM High Priority Process Name Mask
And by default in Oracle version 19.3.0.0 the parameter is set to prioritize VKTM (Virtual keeper of time) and LMS (Lock Manager, a RAC process). Let me check VKTM’s current priority class, and it is set to RR class (SCHED_RR scheduling class) for the process as its defined via _high_priority_processes parameter.
Let’s change the priority and reboot the database to persistent the change!
SQL> alter system set "_high_priority_processes"='LMS*|VKTM|LGWR' scope=spfile;
System altered.
SQL> shut immediate
Database closed.
Database dismounted.
ORACLE instance shut down.
SQL> startup
ORACLE instance started.
Total System Global Area 1593831936 bytes
Fixed Size 8897024 bytes
Variable Size 1107296256 bytes
Database Buffers 469762048 bytes
Redo Buffers 7876608 bytes
Database mounted.
Database opened.
SQL> @hidden
Enter value for param: high_priority_processes
old 5: and a.ksppinm like '%¶m%'
new 5: and a.ksppinm like '%high_priority_processes%'
Parameter Session Value Instance Value descr
--------------------------------------------- ------------------------- ------------------------- ------------------------------------------------------------
_high_priority_processes LMS*|VKTM|LGWR LMS*|VKTM|LGWR High Priority Process Name Mask
At the same time I can see the same was logged into the Alert log file.
2022-04-10T03:54:31.488732-04:00
LGWR started with pid=8, OS id=26058 at elevated (RT) priority
So, we have reniced the priority of LGWR on the system, I mean the higher value of priority actually makes the process lower priority; it means the process demands fewer system resources (and therefore is a “nicer” process). Now lets check the scheduling class of the process at the OS, it should be now changed to RR from TS.
Last week I was part of one system/database stability short term assignment where customer running a critical Telco application on 2-Node RAC Cluster (RHEL) on 11.2.0.3.1 reported slowness in few of the critical data processing modules, which in turn had slowed down their entire system. Todays post is about buggy behavior of an adaptive feature which had caused a huge mess in the system in the form of ‘Log File Sync‘ waits.
After few of the initial calls with the customer, we come to know that the database has a history of high ‘log file sync‘ waits, but they simply come and go, and it seemed that the events were never handled correctly or being analyzed! And interestingly, restarting the cluster resolves the issue for few hours, sometimes for few days. LFS event was quite prominently seen in this database and on an average found consuming > 38% of the total DB Time% available with very high average wait times (248 ms).
Below are few of the database statistics captured from the problem time.
About the event, When a user session commits, all redo records generated by that session’s transaction need to be flushed from memory to the redo logfile to insure changes to the database made by that transaction become permanent. The time between the user session posting the LGWR and the LGWR posting the user after the write has completed is the wait time for ‘log file sync’ that the user session will show. This event is known as the time lost as a result of the LGWR process waiting while users initiate a Transaction Commit or Rollback.
Next in order to get more idea about the event, I ran the lfsdiag.sql (Oracle provided script to catch diag info on it – Doc ID 1064487.1)). The script will look at the important parameters involved in log file sync waits, wait histogram data, and at the worst average LFS times in the active session history data and AWR data and dump information to help determine why those times were the highest.
Below are the ASH LFS background process waits caught during its worst minute and it had some really bad stats captured for the worst minute for the same time when customer had worst application performance.
Another intersting section was the Histogram data for LFS and other related events. Here was can see the LFS waits at “wait_time_milli” and specially the high wait times to correlate them with other wait events. From below stats its evident that Node 2 of this RAC cluster was severely impacted with the LFS waits., with very high wait counts and wait times (ms), and lot of ‘gcs log flush sync’ along with LFS events that pushes LGWR process to write data to the disk.
The stats are very bad, with highest wait time of 1048576 ms on Node 2 and average of 99864 ms (1.6 mins), both ‘log file parallel write’ and ‘gcs log flush sync’ were quite high too.
As a possible solution, we tried few of the quick ones i.e. batching redo (commit_logging = batch) for the log writer (I know it has its own risks) to reduce LFS, but that didn’t worked either.
Next thing I’d generated the system state dump to understand the system and situation bettern, and the LFS events were caught in the system state dump as well with wait chains pointing to ‘rdbms ipc message'<=’log file sync’.
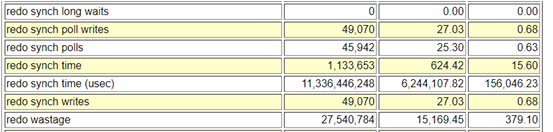
Process traces are always considered a wealth of diagnostic information, So I’d checked the LGWR process traces and thats where I saw some strangeness with frequent entries related with switching between post/wait and polling method which is an adaptive way to control switching between post/wait (older way) and polling (new method) for log file syncs. This gave me little hint about the possible reason on why so many LFS waits.
Talking about the adaptive log file sync, there are 2 methods by which LGWR and foreground processes can communicate in order to acknowledge that a commit has completed: Post/wait: traditional method available in previous Oracle releases LGWR explicitly posts all processes waiting for the commit to complete. The advantage of the post/wait method is that sessions should find out almost immediately when the redo has been flushed to disk. Polling: Foreground processes sleep and poll to see if the commit is complete, this was introduced to free high CPU usage by the LGWR.
This behavior is controlled by the parameter “_use_adaptive_log_file_sync” and was introduced in 11gR2 and controls whether adaptive switching between post/wait and polling is enabled. In 11.2.0.1 and 11.2.0.2 the default value for the parameter is false. From 11.2.0.3, the default value has been changed to true.
-- LGWR traces
WARNING:io_submit failed due to kernel limitations MAXAIO for process=128 pending aio=128
WARNING:asynch I/O kernel limits is set at AIO-MAX-NR=1048576 AIO-NR=169402

*** 2022-04-07 06:03:31.916
Warning: log write broadcast wait time 2612477ms (SCN 0xad1.f8c170fe)

*** 2022-04-07 06:03:31.916
Warning: log write broadcast wait time 2598008ms (SCN 0xad1.f8c21251)
kcrfw_update_adaptive_sync_mode: post->poll long#=33 sync#=202 sync=5963 poll=8730 rw=383 rw+=383 ack=3982 min_sleep=1135

*** 2022-04-07 07:46:20.018
Log file sync switching to polling --------------------->>>>>>> It shows current method is polling
Current scheduling delay is 1 usec
Current approximate redo synch write rate is 67 per sec

*** 2022-04-07 07:47:13.877
kcrfw_update_adaptive_sync_mode: poll->post current_sched_delay=0 switch_sched_delay=1 current_sync_count_delta=63 switch_sync_count_delta=202

*** 2022-04-07 07:47:13.877
Log file sync switching to post/wait ------------------>>>>>>>> It shows current method is post/wait
Current approximate redo synch write rate is 21 per sec


-- Below stats shows that the POLLING is happening on the database for LGWR wrtes
SQL> select name,value from v$sysstat where name in ('redo synch poll writes','redo synch polls');

NAME                                                                  VALUE
---------------------------------------------------------------- ----------
redo synch poll writes                                             10500129
redo synch polls                                                   10773618
As there were no other symptoms of issues with I/O or in other areas, the problem could be with excessive switching between post/wait and polling wait methods.
After consulting with Oracle support, we found the issue was happening due to BUG (25178179) and the issue gets severe when only while using log file sync “polling mode“. To prevent the problem from happening, they suggested us to turn off the _use_adaptive_log_file_sync by setting it to FALSE in either in the spfile and restarting the database or dynamically in memory. This will force the log file sync waits to use (the traditional) “post/wait mode” rather than the automatically switching between “post/wait mode” and “polling mode” based on performance statistics. Changing the said parameter to FALSE disabled adaptive LFS in the database and that resolved the issue and system performance was restored.
-- Set the parameter _use_adaptive_log_file_sync = false and restart the database:
SQL> ALTER SYSTEM SET "_use_adaptive_log_file_sync" = FALSE;

-- In cases where a restart is not feasible, then you can set in memory and also in the SP file for when a restart does occur:
SQL> ALTER SYSTEM SET "_use_adaptive_log_file_sync"=FALSE; -- to set in memory and spfile as by default scope=both
SQL> ALTER SYSTEM SET "_use_adaptive_log_file_sync"=FALSE scope=sfile sid='*'; -- to set on spfile, so parameter is used at next restart.
Though In the vast majority of cases adaptive log file sync improves the overall performance of log file synchronization, but there are few bugs associated with this feature i.e. 13707904, 13074706 and 25178179.