Recently while working on a custom OEM 13c Information Publisher Report to automate monitoring production database I’d encountered an error which says “Error rendering element. Exception: ORA-00942: table or view does not exist” while previewing an underlying custom SQL. The SQL was a join between multiple OEM repository views (mgmt$target_properties, gc_metric_values, mgmt_targets, mgmt$db_datafiles, mgmt$metric_current, mgmt$db_init_params etc.) and throws an error whenever I tried to run the code. Interestingly the SQL working absolutely when I ran it directly on the OEM repository database, but failed when I tried to call the same SQL via Information report on OEM.
I was confused as I was connected with the SYSMAN, passing the same SQL which I’d tested on OMS database directly, all OMS logs were clean, then why its failing for Information Reports. Though from error it was evident that those objects belongs to another schema but I was already connected using SYSMAN in OEM …
I did a quick test to verify if this the reason. As a test ran this simple query as a report first from the EM reports.
select target_name,target_type from mgmt_targets where target_name ='FATDB';
Next, I tried from the repo and granted SELECT ON privilege on mgmt_target view to report owner MGMT_VIEW, and re ran the query, and this time it worked 🙂
SQL> Grant SELECT ON mgmt_targets to MGMT_VIEW;
So, the reason was, the Information Publisher reports uses the MGMT_VIEW user to generate reports and MGMT_VIEW has privileges to access the MGMT$ views only. This is an account used by Oracle Enterprise Manager Database Control for reports. As my custom SQL referenced multiple non-MGMT$ views i.e. gc_metric_values & mgmt_targets and hence failed to recognize them and needs permissions to read data from those views.
Recently while applying the latest (July 2022) GI Release Update 19.16.0.0.220719 on GI+DB homes I’ve encountered an issue where the GI patching failed with an (expected) error ‘oracle.opatch.opatchsdk.OPatchException: Prerequisite check “CheckActiveFilesAndExecutables” failed’ and ended with ‘OPATCHAUTO-68061: The orchestration engine failed‘. Below pasted is what exactly happened …
[root@monkeybox patches]# /test/patch/dir/grid/OPatch/opatchauto apply /patchdir/july2022/34130714

OPatchauto session is initiated
.....
..........

Performing prepatch operations on CRS - bringing down CRS service on home /test/patch/dir/grid
Prepatch operation log file location: /testdir/app/grid/crsdata/monkeyboxcrsconfig/hapatch_xxxxxx.log
CRS service brought down successfully on home /test/dir/grid

Start applying binary patch on home /oracledir/app/oracle/product/19c/dbhome
Binary patch applied successfully on home /oracledir/app/oracle/product/19c/dbhome

Start applying binary patch on home /test/patch/dir/grid
Failed while applying binary patches on home /test/patch/dir/grid   >>>>>>>>>>>>>>>>>>>>>>>>>>>>>>>>>>>

Execution of [OPatchAutoBinaryAction] patch action failed, check log for more details. Failures:
Patch Target : monkeybox->/test/patch/dir/grid Type[siha]
Details: [
---------------------------Patching Failed---------------------------------
Command execution failed during patching in home: /test/patch/dir/grid, host: monkeybox.
Command failed:  /test/patch/dir/grid/OPatch/opatchauto  apply /patchdir/july2022/34130714 -oh /test/patch/dir/grid -target_type has -binary -invPtrLoc /test/patch/dir/grid/oraInst.loc -jre /test/patch/dir/grid/OPatch/jre -persistresult /test/patch/dir/grid/opatchautocfg/db/sessioninfo/sessionresult_monkeybox_siha_1.ser -analyzedresult /test/patch/dir/grid/opatchautocfg/db/sessioninfo/sessionresult_analyze_monkeybox_siha_1.ser
Command failure output:
==Following patches FAILED in apply:

Patch: /patchdir/july2022/34130714/33575402
Log: /test/patch/dir/grid/cfgtoollogs/opatchauto/core/opatch/xxxx.log
Reason: Failed during Patching: oracle.opatch.opatchsdk.OPatchException: Prerequisite check "CheckActiveFilesAndExecutables" failed.

Patch: /patchdir/july2022/34130714/34133642
Log: /test/patch/dir/grid/cfgtoollogs/opatchauto/core/opatch/xxxxxxxxx.log
Reason: Failed during Patching: oracle.opatch.opatchsdk.OPatchException: Prerequisite check "CheckActiveFilesAndExecutables" failed. >>>>>>>>>>>>>

Patch: /patchdir/july2022/34130714/34139601
Log: /test/patch/dir/grid/cfgtoollogs/opatchauto/core/opatch/xxxxxxxxx.log
Reason: Failed during Patching: oracle.opatch.opatchsdk.OPatchException: Prerequisite check "CheckActiveFilesAndExecutables" failed. >>>>>>>>>>>>>

Patch: /patchdir/july2022/34130714/34160635
Log: /test/patch/dir/grid/cfgtoollogs/opatchauto/core/opatch/xxxxxxxxx.log
Reason: Failed during Patching: oracle.opatch.opatchsdk.OPatchException: Prerequisite check "CheckActiveFilesAndExecutables" failed. >>>>>>>>>>>>>

Patch: /patchdir/july2022/34130714/34318175
Log: /test/patch/dir/grid/cfgtoollogs/opatchauto/core/opatch/xxxxxxxxx.log
Reason: Failed during Patching: oracle.opatch.opatchsdk.OPatchException: Prerequisite check "CheckActiveFilesAndExecutables" failed. >>>>>>>>>>>>>

After fixing the cause of failure Run opatchauto resume  >>>>>>>>>>>>>

]
OPATCHAUTO-68061: The orchestration engine failed. >>>>>>>>>>>>>
OPATCHAUTO-68061: The orchestration engine failed with return code 1
OPATCHAUTO-68061: Check the log for more details.
OPatchAuto failed.

OPatchauto session completed at xxxxxxxxx
Time taken to complete the session 8 minutes, 50 seconds
This is a classic case where the patching failed as there were few executables/files from the HOME still active. Same you can verify in the standard logging directory cfgtoollogs for opatchauto for the patch failed.
[INFO]    Prerequisite check "CheckActiveFilesAndExecutables" failed.
The details are:

Following active files/executables/libs are used by ORACLE_HOME :/test/dir/grid

/test/dir/grid/lib/libclntsh.so.19.1
/test/dir/grid/lib/libasmclntsh19.so
The easiest way to fix this issue is to find which opened process is using a file, a directory or a socket, and that you can do it using fuser command. The fuser command lists the process numbers of local processes that use the local or remote files specified by the File parameter. Let’s do it!
Now when we have killed those two opened files (libclntsh.so.19.1 and libasmclntsh19.so), lets resume the patch from the same spot where it has left last time before crashing. I mean opatchauto was able to patch DB HOME before it failed while applying it on GI HOME. So, this will resume from the same spot and will igore previous applied patches. So, will use ‘opatchauto resume’ instruction/command as this operation resumes a previous patching session.
opatchauto is a really powerful tool which even let you resume your patch even when the patching crashed in between by any reasons like server crash, reboot cases or even manual CTRL+C etc. The other two regular options are rollback and version.
[root@monkeybox patches]# /test/dir/grid/OPatch/opatchauto resume

OPatchauto session is initiated at xxxxxxxxx
Session log file is .....
Resuming existing session with id xxxxxx
....
.......
...............
OPatchAuto successful.

Patching is completed successfully. Please find the summary as follows:

OPatchauto session completed at xxxxxx
Time taken to complete the session 9 minutes, 12 seconds

[root@monkeybox patches]#
Lately I was in discussion with one of my friend who was facing an issue with Oracle 19c database where the vendor asked him to apply a patch to fix the problem, but he did not want to apply that single patch because their Oracle homes were shared and he didn’t want to increase the complexity of their patching cycles. Then later on Oracle suggested them to try a workaround which requires a setting using fix controls.
So many times Oracle recommends to set a fix control in case of a bug fix, but what exactly are they ? Their purpose ? & tools and methods to control these bug fixes ? This post is all about explaining all of them in detail.
So, What are they ? – Fix controls are bug fix control parameters introduced in 10.2 and they are typically used to enable/disable certain bug fixes in Oracle database. You cannot pull-back any patch, the patch you trying must have the option to use _FIX_CONTROL, and must be visible under V$SYSTEM_FIX_CONTROL views.
Let’s understand this using one of the case where mview push predicate was not happening due to wrong cardinality estimate in one of the production system running on 12.1.0.2. It was rejecting join predicate pushdown (JPPD) transformations and this was avoiding view to be joined with index-based nested-loop join method and causing issues. This was happening all due to bug 21802552. Let’s check if the bug number is present in fix control views and what’s its status.
SQL> select bugno, value, description from v$system_fix_control where bugno=21802552;

     BUGNO      VALUE DESCRIPTION
---------- ---------- ----------------------------------------------------------------------
  21802552          1 correct cardinality adjusted by DS

-- You can get similar information using DBMS_SQLDIAG.GET_FIX_CONTROL(BUG NUMBER) proc as well.
So, its there in the view’s output and its enabled (value 1), and we can turn it off, lets do it. A proper syntax of using them is given below.
-- To enable:
"_fix_control"='Bugno:ON'    (OR)   "_fix_control"="Bugno:1"

-- To disable:
"_fix_control"='Bugno:OFF'  (OR)   "_fix_control"="Bugno:0"


SQL> ALTER SYSTEM SET "_fix_control" = '21802552:OFF';

System altered.

SQL>

SQL> select bugno, value, description from v$system_fix_control where bugno=21802552;

     BUGNO      VALUE DESCRIPTION
---------- ---------- ----------------------------------------------------------------------
  21802552          0 correct cardinality adjusted by DS


-- same was recorded in alert log file as well

2022-07-16T09:04:02.371313-04:00
ALTER SYSTEM SET _fix_control='21802552:OFF' SCOPE=BOTH;
You can do the same using the new dbms_optim_bundle.set_fix_controls package, it was introduced in 12.1.0.2 to implement Oracle’s approach of ‘Automatic Fix Control Persistence’ framework. Let’s try to the same using said package.
-- This will set given _fix_controls in scope=BOTH on all instances
-- Lets enable it again before we disable it back again
SQL> exec dbms_optim_bundle.set_fix_controls('21802552:1','*', 'BOTH', 'NO');

PL/SQL procedure successfully completed.

SQL> select bugno, value, description from v$system_fix_control where bugno=21802552;

     BUGNO      VALUE DESCRIPTION
---------- ---------- ----------------------------------------------------------------------
  21802552          1 correct cardinality adjusted by DS


-- Lets roll it back
SQL> exec dbms_optim_bundle.set_fix_controls('21802552:0','*', 'BOTH', 'NO');

PL/SQL procedure successfully completed.

SQL> select bugno, value, description from v$system_fix_control where bugno=21802552;

     BUGNO      VALUE DESCRIPTION
---------- ---------- ----------------------------------------------------------------------
  21802552          0 correct cardinality adjusted by DS

--
-- Entry in parameter file made by the dbms_optim_bundle package for fix control
*._fix_control='21802552:0'#added through dbms_optim_bundle package
Recently while working on a slow stats gathering case, someone asked if there is a way to know what’s happening beneath the surface ? what all flags and calculations its doing internally while on the front end the DBMS_STATS still running ? Yes, there is a way! As with most of the Oracle utilities, DBMS_STATS too comes with its own tracing facility which you can call using dbms_stats.set_global_prefs. Today’s post is all about enabling tracing on DBMS_STATS package.
Few of the commonly used DBMS_STATS flags/options are given below, you can always do a combination if wanted to club …
4 = This is to trace table stats 8 = This is to trace index stats 16 = This is to trace columnar stats 512 = auto stats job 1024 = This is to trace parallel executions 4096 = This is to trace partition prunes 16384 = This one traces extended column stats 32768 = To trace approximate NDV (number distinct values) ….
Let’s quickly collect traces for both Indexes and Tables followed by the stas collection for a table and its dependent Indices.
SQL>
SQL> exec dbms_stats.set_global_prefs('TRACE',4+8);

PL/SQL procedure successfully completed.

SQL>

SQL> set time on
13:28:55 SQL>
13:28:56 SQL>
13:28:56 SQL>
13:28:56 SQL> exec DBMS_STATS.GATHER_TABLE_STATS (ownname => 'SYS' , tabname => 'BIGTAB',cascade => true, estimate_percent => 10,method_opt=>'for all indexed columns size 1', granularity => 'ALL', degree => 4);

PL/SQL procedure successfully completed.

13:28:59 SQL>
13:29:00 SQL>


SQL> select name, value from v$diag_info where name='Diag Trace';

NAME                                     VALUE
---------------------------------------- ------------------------------------------------------------------------------------
Diag Trace                               /u01/app/oracle/diag/rdbms/localdb/localdb/trace
Alright, we have our trace ready, let’s dig in deep what’s all inside the trace that we have collected for both the Table and it’s Index. It starts with a standard header in the trace files, followed by all by default explicitly mentioned flags/options with DBMS_STATS in XML format.
Next comes the preferences set for the called Table, ‘BIGTAB’ in our case. This will give you more idea about what all options were set overall and if there is any scope to tune and tweak anyone of them.
Next sections is where it monitors the stats gathering for Table and its Index, their start and end times were captured, for example : “APPROX_NDV_ALGORITHM => Non-Incremental” was chosen. Table level stats were used i.e. row count, blocks, average row length, sample size, number of indexes etc.
Next it jumps to the Index where it tries to calculate the global statistics for the partitioned Index by aggregating the partition-level statistics but as its a non-partitioned Index, it simples moves to the next stage. Next it triggers the Indexing options (just enables them at the start) i.e. nlb (number of leaf blocks), ndk (number of distinct keys), clf (clustering factor), nblks (number of blocks), sample percentage, degree (parallelism), nrw (key counts) etc by allocating them value 1 which means to consider them. Finally it starts to analyze the Index structure (In this case it’s not using approximate_ndv algorithm) and calculates the final values of nrw, nlb, ndk, clf etc.
Few Internal options were also used i.e. ctx.conc_ctx, ctx.batching_coeff etc.
-- Table Stats
DBMS_STATS: Started table SYS.BIGTAB. at 28-JUN-22 01.28.58.499744000 PM -04:00. Execution phase: SERIAL (NON-CONCURRENT) stattype: DATA Reporting
DBMS_STATS: reporting_man_log_task: target: "SYS"."BIGTAB" objn: 108254 auto_stats: FALSE status: IN PROGRESS ctx.batching_coeff: 0
DBMS_STATS: Start construct analyze using SQL .. Execution Phase: SERIAL (NON-CONCURRENT) granularity: ALL global_requested: NULL pfix:
DBMS_STATS: APPROX_NDV_ALGORITHM chosen: HLL in incremental (no stats exist)
DBMS_STATS: Start gather part -- ctx.conc_ctx.global_requested: NULL gran: ALL execution phase: 1
DBMS_STATS: APPROX_NDV_ALGORITHM chosen: AS in non-incremental
DBMS_STATS: Start gather_stats.. pfix:  ownname: SYS tabname: BIGTAB pname:  spname:  execution phase: 1
DBMS_STATS: Number of rows in the table = 492190, blocks = , average row length = 19, chain count = , scan rate = 0, sample size = 49219, cstats.count = 3, cind = 2

-- Index part
DBMS_STATS: Started index SYS.IDX_DIXIT at 28-JUN-22 01.28.58.816819000 PM -04:00 granularity: ALL gIdxGran:
DBMS_STATS: Specified granularity = , New granularity = ALL, Fixed granularity = ALL
DBMS_STATS: granularity ALL
DBMS_STATS: reporting_man_log_task: target: "SYS"."IDX_DIXIT" objn: 108255 auto_stats: FALSE status: IN PROGRESS ctx.batching_coeff: 0
DBMS_STATS:  Gather index subpartition stats...
DBMS_STATS:  Gather index partition stats...
DBMS_STATS:  Gather global index stats...
DBMS_STATS: Start analyze_index_using_sql
DBMS_STATS: tab_stats_stale: BIGTAB not analyzed using full compute
DBMS_STATS:   Number of blocks in the index: 1030
DBMS_STATS: Start execute_analyze_index(owner= SYS, indname= IDX_DIXIT, fobjn= , sample_pct= 10, seed= 0, degree= 4, collect_nrw= 1, collect_nlb= 1, collect_ndk= 1, collect_clf= 1, bmi= 0, iot_ov= 0, iot_sec= 0, ppredtxt= , nblks= 1030)
DBMS_STATS: execute_analyze_index(): Not using approximate_ndv, pct=111.529126213592233009708737864077669903,sample_pct=10
DBMS_STATS: End execute_analyze_index(ssize= 494100, nrw= 494100, nlb= 1027, ndk= 1000, clf= 494100)
DBMS_STATS: target_size: 1027
DBMS_STATS: Finished index SYS.IDX_DIXIT at 28-JUN-22 01.28.59.464468000 PM -04:00

DBMS_STATS: Finished table SYS.BIGTAB. at 28-JUN-22 01.28.59.519495000 PM -04:00
Once you are done with the stats tracing, close it immediately!
Recently someone shared me an AWR report from a production 19c system, and he was very tensed about one of the strange looking wait event called ‘TCP Socket (KGAS)’. He was strained because the event was coming with a very high average wait time of 7863.68ms (7.86 seconds), and was consuming around 98.0% of the total DB Time.
Luckily I’d encountered something similar in the past for one of the customer, where the application team was unable to send the mail as DBMS scheduler, and it was stuck for a long time with wait event “TCP Socket(KGAS)” where problem was not with the scheduler, but was an underlying network or third-party application problem.
So, today’s post is all about the wait event, what it is, how to resolve it etc.
KGAS is a element in the server which handles TCP/IP sockets which is typically used in dedicated connections i.e. by some PLSQL built in packages such as UTL_HTTP and UTL_TCP. A session is waiting for an external host to provide requested data over a network socket. The time that this wait event tracks does not indicate a problem, and even a long wait time is not a reason to contact Oracle Support. It naturally takes time for data to flow between hosts over a network, and for the remote aspect of an application to process any request made to it. An application that communicates with a remote host must wait until the data it will read has arrived.
From an application/network point of view, delays in establishing a network connection may produce unwanted delays for users. We should make sure that the application makes network calls efficiently and that the network is working well such that these delays are minimized.
From the database point of view, these waits can safely be ignored; the wait event does not represent a database issue. It merely reports the total elapsed time for a network connection to be established or for data to arrive from over the network. The database waits for the connection to be established and reports the time taken. Its always good to check with the network or the third-party application vendors to investigate the underlying socket.
But in case of systemwide waits – If the TIME spent waiting for this event is significant then it is best to determine which sessions are showing the wait and drill into what those sessions are doing as the wait is usually related to whatever application code is executing eg: What part of the application may be using UTL_HTTP or similar and is experiencing waits. This statement can be used to see which sessions may be worth tracing
SELECT sid, total_waits, time_waited
FROM v$session_event WHERE event='TCP Socket (KGAS)' and total_waits>0 ORDER BY 3,2;
In order to reduce these waits or to help find the origin of the socket operations try:
Check the current SQL/module/action of V$SESSION for sessions that are waiting on the event at the time that they are waiting to try and identify any common area of application code waiting on the event.
Get an ERRORSTACK level 3 dump of some sessions waiting on the event. This should help show the exact PLSQL and C call stacks invoking the socket operation if the dump is taken when the session is waiting. Customers may need assistance from Oracle Support in order to get and interpret such a dump but it can help pinpoint the relevant application code.
Trace sessions incurring the waits including wait tracing to try and place the waits in the context of the code executing around the waits. eg: Use event 10046 level 8 or DBMS_MONITOR.SESSION_TRACE_ENABLE.
Use DBA_DEPENDENCIES to find any application packages which may ultimately be using UTL_HTTP or UTL_TCP underneath for some operation.
Example: Execute the following SQL from a session on a dedicated connection and then check the resulting trace file to see “TCP Socket (KGAS)” waits:
alter session set events '10046 trace name context forever, level 8';
Alert log is always been a very important logfile which contain important information about error messages and exceptions that occur during database operations. Its very crucial for any analysis or for troubleshooting any critical event that has happened. Specially over the period of last few years, with all those new database releases, its slowly becoming very messy, loud and has got whole lot of new content added to it that it has to record for all those regular and critical database events, and finally with the inception of Oracle 21c we have the ‘Attention Log‘ that helps to segregate all those critical and vital events which otherwise gets mixed up with other regular incidents of alertlog file.
Each of the database has its own Attention log and is a regular JSON format file which is very easy to translate. Few of the important dimensions or its properties are URGENCY: Class with possible values INFO, IMMEDIATE etc. CAUSE : A quick detail about the possible cause or reason. NOTIFICATION : A regular message in case of any event i.e. “PMON (ospid: 1901): terminating the instance due to ORA error 12752” etc. ACTION : What possibly you can do TIME : A timestamp of the event
Let’s see how it looks like!
[oracle@witnessalberta ~]$ !sql
sqlplus / as sysdba

SQL*Plus: Release 21.0.0.0.0 - Production on Fri Apr 8 22:38:25 2022
Version 21.3.0.0.0

Copyright (c) 1982, 2021, Oracle.  All rights reserved.


Connected to:
Oracle Database 21c Enterprise Edition Release 21.0.0.0.0 - Production
Version 21.3.0.0.0

SQL> set linesize 400 pagesize 400


SQL> col NAME for a30
SQL> col value for a70
SQL>
SQL> select name, value from v$diag_info where value like '%attention%';

NAME                           VALUE
------------------------------ ----------------------------------------------------------------------
Attention Log                  /opt/oracle/diag/rdbms/orclcdb/ORCLCDB/trace/attention_ORCLCDB.log


[oracle@witnessalberta trace]$ pwd
/opt/oracle/diag/rdbms/orclcdb/ORCLCDB/trace
[oracle@witnessalberta trace]$

[oracle@witnessalberta trace]$
[oracle@witnessalberta trace]$ ls -ltrh *.log*
-rw-r-----. 1 oracle oinstall 6.0K Apr  8 22:32 attention_ORCLCDB.log
-rw-r-----. 1 oracle oinstall 244K Apr  8 22:34 alert_ORCLCDB.log
[oracle@witnessalberta trace]$


{
  "NOTIFICATION" : "Starting ORACLE instance (normal) (OS id: 3309)",
  "URGENCY"      : "INFO",
  "INFO"         : "Additional Information Not Available",
  "CAUSE"        : "A command to startup the instance was executed",
  "ACTION"       : "Check alert log for progress and completion of command",
  "CLASS"        : "CDB Instance / CDB ADMINISTRATOR / AL-1000",
  "TIME"         : "2022-04-08T22:32:47.914-04:00"
}

....
.....
.........
{
  "NOTIFICATION" : "Shutting down ORACLE instance (immediate) (OS id: 9724)",
  "URGENCY"      : "INFO",
  "INFO"         : "Shutdown is initiated by sqlplus@localhost.ontadomain (TNS V1-V3). ",
  "CAUSE"        : "A command to shutdown the instance was executed",
  "ACTION"       : "Check alert log for progress and completion of command",
  "CLASS"        : "CDB Instance / CDB ADMINISTRATOR / AL-1001",
  "TIME"         : "2021-09-16T23:11:56.812-04:00"
}

.....
......
........

{
  "ERROR"        : "PMON (ospid: 1901): terminating the instance due to ORA error 12752",
  "URGENCY"      : "IMMEDIATE",
  "INFO"         : "Additional Information Not Available",
  "CAUSE"        : "The instance termination routine was called",
  "ACTION"       : "Check alert log for more information relating to instance termination rectify the error and restart the instance",
  "CLASS"        : "CDB Instance / CDB ADMINISTRATOR / AL-1003",
  "TIME"         : "2021-09-16T23:34:26.117-02:00"
}
...
.....
......
{
  "ERROR"        : "PMON (ospid: 3408): terminating the instance due to ORA error 474",
  "URGENCY"      : "IMMEDIATE",
  "INFO"         : "Additional Information Not Available",
  "CAUSE"        : "The instance termination routine was called",
  "ACTION"       : "Check alert log for more information relating to instance termination rectify the error and restart the instance",
  "CLASS"        : "CDB Instance / CDB ADMINISTRATOR / AL-1003",
  "TIME"         : "2022-04-08T23:38:11.258-04:00"
}
Short stacks are a rich source of information which can help you to do analyzing and deconstructing a process which is part of a problem in Oracle databases, and the good part is you don’t have to rely on any OS utilities like gdb, pstack etc. to extract stacks or traces. Its pretty simple and quick to generate the short stacks, you have to pass on the OSPID of the process, and issue SHORT_STACK option for ORADEBUG, and will generate a sequence of all functions involved and their current position in a calls stack. You can also use errorstack for the same, but short_stacks are fast and point-to-point!
Now one can ask – What is a ‘call stack’ ? A call stack is a list of names of methods called at run time from the beginning of a program until the execution of the current statement. A call stack is mainly intended to keep track of the point to which each active subroutine should return control when it finishes executing. Call stack acts as a tool to debug an application when the method to be traced can be called in more than one context. This forms a better alternative than adding tracing code to all methods that call the given method.
Let me run it on a real time system where we are facing issues where due to adaptive switching between Log write methods LGWR was causing excessive ‘log file sync‘ Waits
[oracle@oracleontario ~]$ ps -ef|grep lg
oracle     4402      1  0 00:25 ?        00:00:00 ora_lgwr_dixitdb
oracle     4719   3201  0 00:25 pts/1    00:00:00 grep --color=auto lg

-- Here in the example I am generating short stacks for LGWR process
SQL>
SQL> oradebug setospid 4402
Oracle pid: 19, Unix process pid: 4402, image: oracle@oracleontario.ontadomain (LGWR)
SQL> oradebug short_stack
ksedsts()+426<-ksdxfstk()+58<-ksdxcb()+872<-sspuser()+223<-__sighandler()<-semtimedop()+10<-skgpwwait()+187
<-ksliwat()+2233<-kslwaitctx()+200<-ksarcv()+320<-ksbabs()+670<-ksbrdp()+1167<-opirip()+541<-opidrv()+581<-sou2o()+165
<-opimai_real()+173<-ssthrdmain()+417<-main()+256<-__libc_start_main()+245
SQL>
SQL>


-- After a gap of ~ 10-15 Mins
-- Let me generate the short stack once again just to see if there is any difference.
SQL> oradebug short_stack
ksedsts()+380<-ksdxfstk()+52<-ksdxcb()+3524<-sspuser()+140<-__sighndlr()+12<-call_user_handler()+992 <-sigacthandler()+104
<-_syscall6()+32<-sskgpwwait()+236<-ksliwat()+1752<-kslwait()+240<-ksarcv()+212 <-ksbabs()+764<-ksbrdp()+1616<-opirip()+1680
<-opidrv()+748<-sou2o()+88<-opimai_real()+276<-ssthrdmain()+316<-main()+316<-_start()+380
So, as you’ve seen in above code, the clear change is there in the LGWR short stacks, we did few log switches, modified a big table in the database followed by multiple commits. If you carefully look at the stack, it was function ksedsts() where it was at the time we generated the stack, and function ksdxfstk () called it, followed by ksdxcb(), sspuser() and immediate change after functions called by LGWR internal call stacks. They matched one of the known BUG which gave us a hint that we resolved after modified a undocumented parameter.
So, it can help us locating the buggy functions called by any user session or background processes and is very useful in case when you are battling with a strange looking problem in your Oracle database.
Few of the functions that I am able to recall are given below. semtimedop() is one of the function for semaphore operations also known as semop and is used to perform atomically an array of semaphore operations on the set of semaphores associated with the semaphore identifier specified by semid. ‘ksdxcb’ is a function that’s called usually when the command oradebug is being used. sighandler is the programming signal handler and is used to locate an exception. When a signal is sent to a process, various register and stack operations occur that make it look as though the leaf PC at the time of the signal is the return address for a call to a system function, sigacthandler(). sigacthandler() calls the user-specified signal handler just as any function would call another. The sigaltstack()function allows a thread to define and examine the state of an alternate stack area on which signals are processed.
opidrv() is ORACLE Program Interface DRiVer (IGNORE) opiodr is ORACLE code request driver – route the current request main() is the standard executable entry point ksedst()is the KSE dump the call stack skgmstack() is the call specified function with extra STACK space rpidrv()or the RPI is theRecursive Program Interface DRiVer pfrrun() or PSDEVN is the PL/SQL Interpreter Main Instruction Loop kkxexe()or KKX is to execute plsql
Recently during one of the performance taskforce on a newly migrated system, customer DBA asked me to use one of their legacy tool to get more idea about database’s performance, that one of their expert DBA written to collect performance metrics. I’d seen their previous reports collected through the same tool for other systems, and it was good. But, got a runtime exception with an error while calling the script/tool which says ‘PLAN_TABLE physical table present in user schema SYS‘. The error means the user executing it (SYS) owns the table PLAN_TABLE that is the not the Oracle seeded GTT (Global Temporary Table) plan table owned by SYS (PLAN_TABLE$ table with a PUBLIC synonym PLAN_TABLE).
This was little odd to the customer DBAs as they had never experienced this error with the tool, and now when its there, question was Shall we drop the PLAN_TABLE ? Is it risky to do that ? If we drop it, will it impact the execution plan generation or not ? Any other associated risk with drop of plan_table ?
Next when I’d queried DBA_OBJECTS, I saw the table is there in SYS schema, though this system was migrated from 12.2 to 19c, but the table should not be there as the table only by default existed in older versions of Oracle. The object creation date was coming for the time when database was upgraded. It had appeared that someone after upgrade/migration, called the utlrp.sql explicitly (maybe any old 8i/9i DBA) and that’d created the table. Now the question is – It’s safe to dropthis table ?
SQL> select owner, object_name, object_type, created from dba_objects where object_name like '%PLAN_TABLE%'
and owner not in ('SQLTXPLAIN','SQLTXADMIN') ORDER BY 1;

OWNER      OBJECT_NAME          OBJECT_TYPE             CREATED
---------- -------------------- ----------------------- ---------
PUBLIC     PLAN_TABLE           SYNONYM                 17-APR-19
PUBLIC     SQL_PLAN_TABLE_TYPE  SYNONYM                 17-APR-19
PUBLIC     PLAN_TABLE_OBJECT    SYNONYM                 17-APR-19
SYS        SQL_PLAN_TABLE_TYPE  TYPE                    17-APR-19
SYS        PLAN_TABLE           TABLE                   13-MAR-22     ----->>>>> OLD PLAN_TABLE created during the UPGRADE
SYS        SQL_PLAN_TABLE_TYPE  TYPE                    17-APR-19
SYS        PLAN_TABLE_OBJECT    TYPE                    17-APR-19
SYS        PLAN_TABLE$          TABLE                   17-APR-19
SYS        PLAN_TABLE_OBJECT    TYPE BODY               17-APR-19

9 rows selected.


-- Look at the difference between the two, PLAN_TABLE$ is a GLOBAL TEMP TABLE and old PLAN_TABLE is not.
SQL> SELECT TABLE_NAME, owner, temporary from dba_tables where table_name like '%PLAN_TABLE%'
AND owner not in ('SQLTXPLAIN','SQLTXADMIN') ORDER BY 1;

TABLE_NAME                     OWNER                T
------------------------------ -------------------- -
PLAN_TABLE                     SYS                  N
PLAN_TABLE$                    SYS                  Y     ---> Y represents GTT
Let’s first see what’s there inside the PLAN_TABLE and what’s its purpose. Will generate few SQL execution plans will observe changes that happens in PLAN_TABLE.
-- Table columns and details
SQL> desc plan_table
 Name                                      Null?    Type
 ----------------------------------------- -------- ----------------------------
 STATEMENT_ID                                       VARCHAR2(30)
 PLAN_ID                                            NUMBER
 TIMESTAMP                                          DATE
 REMARKS                                            VARCHAR2(4000)
 OPERATION                                          VARCHAR2(30)
 OPTIONS                                            VARCHAR2(255)
 OBJECT_NODE                                        VARCHAR2(128)
 OBJECT_OWNER                                       VARCHAR2(128)
 OBJECT_NAME                                        VARCHAR2(128)
 OBJECT_ALIAS                                       VARCHAR2(261)
 OBJECT_INSTANCE                                    NUMBER(38)
 OBJECT_TYPE                                        VARCHAR2(30)
 OPTIMIZER                                          VARCHAR2(255)
 SEARCH_COLUMNS                                     NUMBER
 ID                                                 NUMBER(38)
 PARENT_ID                                          NUMBER(38)
 DEPTH                                              NUMBER(38)
 POSITION                                           NUMBER(38)
 COST                                               NUMBER(38)
 CARDINALITY                                        NUMBER(38)
 BYTES                                              NUMBER(38)
 OTHER_TAG                                          VARCHAR2(255)
 PARTITION_START                                    VARCHAR2(255)
 PARTITION_STOP                                     VARCHAR2(255)
 PARTITION_ID                                       NUMBER(38)
 OTHER                                              LONG
 DISTRIBUTION                                       VARCHAR2(30)
 CPU_COST                                           NUMBER(38)
 IO_COST                                            NUMBER(38)
 TEMP_SPACE                                         NUMBER(38)
 ACCESS_PREDICATES                                  VARCHAR2(4000)
 FILTER_PREDICATES                                  VARCHAR2(4000)
 PROJECTION                                         VARCHAR2(4000)
 TIME                                               NUMBER(38)
 QBLOCK_NAME                                        VARCHAR2(128)
 OTHER_XML                                          CLOB


-- Let me check other stats or details about the PLAN_TABLE
SQL> select index_name, table_name from dba_indexes where table_name='PLAN_TABLE'
 And owner not in ('SQLTXPLAIN','SQLTXADMIN') ORDER BY 1;

INDEX_NAME                                         TABLE_NAME
-------------------------------------------------- ------------------------------
SYS_IL0000078251C00036$$                           PLAN_TABLE


SQL> select table_name, owner, TABLESPACE_NAME from dba_tables where table_name like '%PLAN_TABLE%'
and owner not in ('SQLTXPLAIN','SQLTXADMIN') ORDER BY 1;

TABLE_NAME                     OWNER                          TABLESPACE_NAME
------------------------------ ------------------------------ ------------------------------
PLAN_TABLE                     SYS                            SYSTEM
PLAN_TABLE$                    SYS


SQL>

-- The OLD PLAN_TABLE is empty at the moment
SQL> select count(*) from plan_table;

  COUNT(*)
----------
         0


-- Lets explain a test SQL to see what happens to the OLD PLAN_TABLE
SQL> explain plan for select count(*) from bigtab;

Explained.

-- And immediately 3 rows related to the plan line ids added to it
SQL> select count(*) from plan_table;

  COUNT(*)
----------
         3


-- Three entries for below 3 IDs.
SQL> select * FROM TABLE(DBMS_XPLAN.DISPLAY);

PLAN_TABLE_OUTPUT
--------------------------------------------------------------------------------
Plan hash value: 2140185107

---------------------------------------------------------------------
| Id  | Operation          | Name   | Rows  | Cost (%CPU)| Time     |
---------------------------------------------------------------------
|   0 | SELECT STATEMENT   |        |     1 |    69   (0)| 00:00:01 |
|   1 |  SORT AGGREGATE    |        |     1 |            |          |
|   2 |   TABLE ACCESS FULL| BIGTAB | 72358 |    69   (0)| 00:00:01 |
---------------------------------------------------------------------

9 rows selected.


-- But the new PLAN_TABLE$ is still empty

SQL> select count(*) from PLAN_TABLE$ ;

  COUNT(*)
----------
         0
So, the question is – Is it safe to drop this table PLAN_TABLE ?
SQL> drop table PLAN_TABLE;

Table dropped.

SQL>

-- And the table is gone
SQL> select owner, object_name, object_type, created from dba_objects where object_name like '%PLAN_TABLE%'
and owner not in ('SQLTXPLAIN','SQLTXADMIN') ORDER BY 1;

OWNER                          OBJECT_NAME          OBJECT_TYPE             CREATED
------------------------------ -------------------- ----------------------- ---------
PUBLIC                         PLAN_TABLE           SYNONYM                 17-APR-19
PUBLIC                         SQL_PLAN_TABLE_TYPE  SYNONYM                 17-APR-19
PUBLIC                         PLAN_TABLE_OBJECT    SYNONYM                 17-APR-19
SYS                            PLAN_TABLE_OBJECT    TYPE BODY               17-APR-19
SYS                            SQL_PLAN_TABLE_TYPE  TYPE                    17-APR-19
SYS                            PLAN_TABLE_OBJECT    TYPE                    17-APR-19
SYS                            PLAN_TABLE$          TABLE                   17-APR-19
SYS                            SQL_PLAN_TABLE_TYPE  TYPE                    17-APR-19

8 rows selected.
Now when the table is gone, lets check if we are still able to generate the execution plan.
SQL>
SQL> explain plan for select count(*) from bigtab;

Explained.

SQL> select * FROM TABLE(DBMS_XPLAN.DISPLAY);

PLAN_TABLE_OUTPUT
----------------------------------------------------------------------------------------------------------------------------------------------------------------------------------------------------------------------------------------------------------------------------------------------------------------------------------------------------------------------------------------------------------------
Plan hash value: 2140185107

---------------------------------------------------------------------
| Id  | Operation          | Name   | Rows  | Cost (%CPU)| Time     |
---------------------------------------------------------------------
|   0 | SELECT STATEMENT   |        |     1 |    69   (0)| 00:00:01 |
|   1 |  SORT AGGREGATE    |        |     1 |            |          |
|   2 |   TABLE ACCESS FULL| BIGTAB | 72358 |    69   (0)| 00:00:01 |
---------------------------------------------------------------------

9 rows selected.


SQL> select count(*) from plan_table$;

  COUNT(*)
----------
         3
And yes, no issues at all. The plan now started to sit inside PLAN_TABLE$ that has a PUBLIC SYNONYM called PLAN_TABLE. So, it’s totally safe to drop the PLAN_TABLE from your schema if it still exists and Oracle has now a public synonym for the same purpose. WARNING: Don’t drop the PLAN_TABLE$ nor the PLAN_TABLE public synonym, these need to exist for the new PLAN_TABLE to work properly.
Last week I was part of one system/database stability short term assignment where customer running a critical Telco application on 2-Node RAC Cluster (RHEL) on 11.2.0.3.1 reported slowness in few of the critical data processing modules, which in turn had slowed down their entire system. Todays post is about buggy behavior of an adaptive feature which had caused a huge mess in the system in the form of ‘Log File Sync‘ waits.
After few of the initial calls with the customer, we come to know that the database has a history of high ‘log file sync‘ waits, but they simply come and go, and it seemed that the events were never handled correctly or being analyzed! And interestingly, restarting the cluster resolves the issue for few hours, sometimes for few days. LFS event was quite prominently seen in this database and on an average found consuming > 38% of the total DB Time% available with very high average wait times (248 ms).
Below are few of the database statistics captured from the problem time.
About the event, When a user session commits, all redo records generated by that session’s transaction need to be flushed from memory to the redo logfile to insure changes to the database made by that transaction become permanent. The time between the user session posting the LGWR and the LGWR posting the user after the write has completed is the wait time for ‘log file sync’ that the user session will show. This event is known as the time lost as a result of the LGWR process waiting while users initiate a Transaction Commit or Rollback.
Next in order to get more idea about the event, I ran the lfsdiag.sql (Oracle provided script to catch diag info on it – Doc ID 1064487.1)). The script will look at the important parameters involved in log file sync waits, wait histogram data, and at the worst average LFS times in the active session history data and AWR data and dump information to help determine why those times were the highest.
Below are the ASH LFS background process waits caught during its worst minute and it had some really bad stats captured for the worst minute for the same time when customer had worst application performance.
Another intersting section was the Histogram data for LFS and other related events. Here was can see the LFS waits at “wait_time_milli” and specially the high wait times to correlate them with other wait events. From below stats its evident that Node 2 of this RAC cluster was severely impacted with the LFS waits., with very high wait counts and wait times (ms), and lot of ‘gcs log flush sync’ along with LFS events that pushes LGWR process to write data to the disk.
The stats are very bad, with highest wait time of 1048576 ms on Node 2 and average of 99864 ms (1.6 mins), both ‘log file parallel write’ and ‘gcs log flush sync’ were quite high too.
As a possible solution, we tried few of the quick ones i.e. batching redo (commit_logging = batch) for the log writer (I know it has its own risks) to reduce LFS, but that didn’t worked either.
Next thing I’d generated the system state dump to understand the system and situation bettern, and the LFS events were caught in the system state dump as well with wait chains pointing to ‘rdbms ipc message'<=’log file sync’.
Process traces are always considered a wealth of diagnostic information, So I’d checked the LGWR process traces and thats where I saw some strangeness with frequent entries related with switching between post/wait and polling method which is an adaptive way to control switching between post/wait (older way) and polling (new method) for log file syncs. This gave me little hint about the possible reason on why so many LFS waits.
Talking about the adaptive log file sync, there are 2 methods by which LGWR and foreground processes can communicate in order to acknowledge that a commit has completed: Post/wait: traditional method available in previous Oracle releases LGWR explicitly posts all processes waiting for the commit to complete. The advantage of the post/wait method is that sessions should find out almost immediately when the redo has been flushed to disk. Polling: Foreground processes sleep and poll to see if the commit is complete, this was introduced to free high CPU usage by the LGWR.
This behavior is controlled by the parameter “_use_adaptive_log_file_sync” and was introduced in 11gR2 and controls whether adaptive switching between post/wait and polling is enabled. In 11.2.0.1 and 11.2.0.2 the default value for the parameter is false. From 11.2.0.3, the default value has been changed to true.
-- LGWR traces
WARNING:io_submit failed due to kernel limitations MAXAIO for process=128 pending aio=128
WARNING:asynch I/O kernel limits is set at AIO-MAX-NR=1048576 AIO-NR=169402
*** 2022-04-07 06:03:31.916
Warning: log write broadcast wait time 2612477ms (SCN 0xad1.f8c170fe)
*** 2022-04-07 06:03:31.916
Warning: log write broadcast wait time 2598008ms (SCN 0xad1.f8c21251)
kcrfw_update_adaptive_sync_mode: post->poll long#=33 sync#=202 sync=5963 poll=8730 rw=383 rw+=383 ack=3982 min_sleep=1135
*** 2022-04-07 07:46:20.018
Log file sync switching to polling --------------------->>>>>>> It shows current method is polling
Current scheduling delay is 1 usec
Current approximate redo synch write rate is 67 per sec
*** 2022-04-07 07:47:13.877
kcrfw_update_adaptive_sync_mode: poll->post current_sched_delay=0 switch_sched_delay=1 current_sync_count_delta=63 switch_sync_count_delta=202
*** 2022-04-07 07:47:13.877
Log file sync switching to post/wait ------------------>>>>>>>> It shows current method is post/wait
Current approximate redo synch write rate is 21 per sec
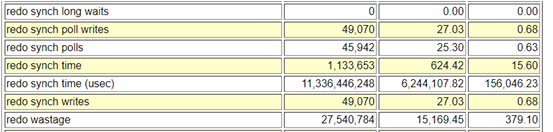
-- Below stats shows that the POLLING is happening on the database for LGWR wrtes
SQL> select name,value from v$sysstat where name in ('redo synch poll writes','redo synch polls');
NAME VALUE
---------------------------------------------------------------- ----------
redo synch poll writes 10500129
redo synch polls 10773618
As there were no other symptoms of issues with I/O or in other areas, the problem could be with excessive switching between post/wait and polling wait methods.
After consulting with Oracle support, we found the issue was happening due to BUG (25178179) and the issue gets severe when only while using log file sync “polling mode“. To prevent the problem from happening, they suggested us to turn off the _use_adaptive_log_file_sync by setting it to FALSE in either in the spfile and restarting the database or dynamically in memory. This will force the log file sync waits to use (the traditional) “post/wait mode” rather than the automatically switching between “post/wait mode” and “polling mode” based on performance statistics. Changing the said parameter to FALSE disabled adaptive LFS in the database and that resolved the issue and system performance was restored.
-- Set the parameter _use_adaptive_log_file_sync = false and restart the database:
SQL> ALTER SYSTEM SET "_use_adaptive_log_file_sync" = FALSE;

-- In cases where a restart is not feasible, then you can set in memory and also in the SP file for when a restart does occur:
SQL> ALTER SYSTEM SET "_use_adaptive_log_file_sync"=FALSE; -- to set in memory and spfile as by default scope=both
SQL> ALTER SYSTEM SET "_use_adaptive_log_file_sync"=FALSE scope=sfile sid='*'; -- to set on spfile, so parameter is used at next restart.
Though In the vast majority of cases adaptive log file sync improves the overall performance of log file synchronization, but there are few bugs associated with this feature i.e. 13707904, 13074706 and 25178179.
Recently someone asked me, How to run oratop utility on Oracle database version that is above 12.1 ? He was using Oracle version 19.3.0.0.0 and was getting error ‘error while loading shared libraries’ when tried to call the oratop, and it was quite an obvious error as the script trying to locate a shared object file called libclntshcore.so under $ORACLE_HOME/lib directory for version 12.1, whereas it was version 19.1 and hence the shared object version was libclntshcore.so.19.1
[oracle@oracleontario ~]$ ./oratop.RDBMS_12.1_LINUX_X64 -d -f -i 3 / as sysdba
./oratop.RDBMS_12.1_LINUX_X64: error while loading shared libraries: libclntshcore.so.12.1: cannot open shared object file: No such file or directory
[oracle@oracleontario ~]$
Solution to the problem is, starting from Oracle 19c, oratop is part of Oracle supplied tool and is present under ORACLE_HOME/suptools directory, and is not version specific. Other tools that you will see along with oratop in suptools directory are orachk and tfa. Let’s call it and see if it runs!
[oracle@oracleontario ~]$ cd $ORACLE_HOME/suptools/
[oracle@oracleontario suptools]$ ls
orachk  oratop  tfa
[oracle@oracleontario suptools]$ cd oratop/
[oracle@oracleontario oratop]$ ls
oratop
[oracle@oracleontario oratop]$
[oracle@oracleontario oratop]$

[oracle@oracleontario oratop]$ ./oratop  -f -i 3 / as sysdba

oratop: Release 15.0.0 Production on Thu Mar 10 07:33:49 2022
Copyright (c) 2011, Oracle.  All rights reserved.

Connecting ..
Processing ...

Oracle 19c - Primary dixitd 07:33:45 up: 5.2h,  1 ins,    0 sn,   0 us, 1.5G sga,    0% fra,   1 er,                        0.5%db
ID CPU  %CPU %DCP LOAD  AAS  ASC  ASI  ASW  IDL  ASP  LAT  MBPS IOPS  R/S  W/S  LIO  GCPS %FR  PGA TEMP UTPS  UCPS  RT/X DCTR DWTR
 1   1   9.1  0.2  0.2  0.0    0    0    0    0    0    0   0.1    3    3    0    3     0  45 153M    0    0     0  110m  118    8

EVENT (C)                                                         TOTAL WAITS   TIME(s)  AVG_MS  PCT                    WAIT_CLASS
db file sequential read                                                  5175        65    12.6   32                      User I/O
DB CPU                                                                               42           21
oracle thread bootstrap                                                    81        40   503.8   20                         Other
db file scattered read                                                    593        29    50.4   15                      User I/O
external table read                                                         1        23 23470.8   12                      User I/O

ID   SID     SPID USERNAME  PROGRAM    SRV  SERVICE  PGA  SQLID/BLOCKER OPN  E/T  STA  STE  WAIT_CLASS  EVENT/*LATCH           W/T
 1    58    14884 SYS       sqlplus@o  DED  SYS$USE 1.4M           1:77 UPD 8.0s  ACT  WAI  Applicatio  enq: TX - row lock co 7.8s


[oracle@oracleontario oratop]$
[oracle@oracleontario oratop]$